Brambles Limited and LEAP India Limited: Global Platform Economics vs. Domestic Consolidation as Supply Chain Friction Tests Pooling Velocity
1. Brambles Limited [ASX: BXB] recorded FY2026 sales revenue of USD 7,042.9 million, generating an EBIT of USD 1,494.4 million, while US repair bottlenecks stranded 3.4 million pallets, triggering USD 116.9 million in irrecoverable pooling provisions.
2. LEAP India Limited expanded its pool beyond 14.7 million assets, capturing INR 7,295.33 million (USD 83.71 million) in operational revenue and an EBITDA margin of 50.69% after merging CHEP India across 29 domestic hubs.
3. Operating leverage diverged sharply: Brambles posted revenue per employee of USD 601,597 versus LEAP India’s USD 241,945, reflecting deep automation moats versus emerging-market labor structures amid an upcoming INR 4,800 million Indian IPO.
Figure GLOBAL PALLET & CONTAINER POOLING BENCHMARK 2026
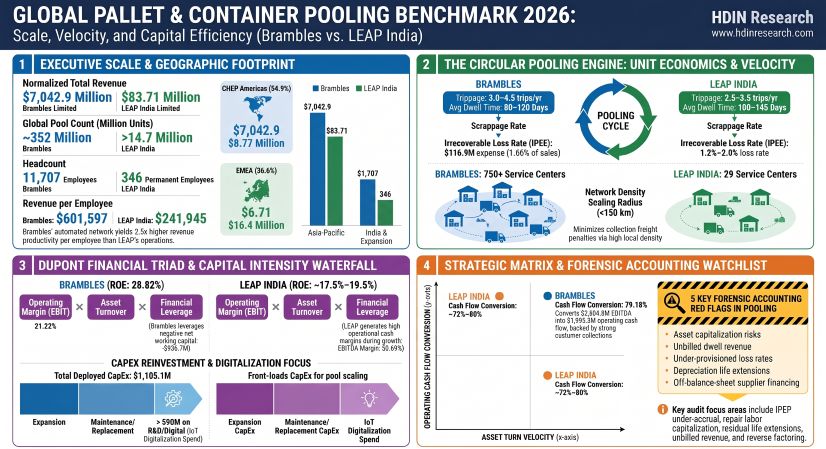 Segmental Realities, Loss Accounting, and Capital Efficiency
Forensic accounting across both asset pooling operators demonstrates how volume throughput, physical leakage, and contractual recovery dictate operating leverage. Brambles Limited reported FY2026 sales revenue of USD 7,042.9 million (+6.0% actual FX; +2.0% constant FX), driven by 1% net volume growth (+3% net new business wins offsetting a 2% like-for-like decline) and 1% price realization. Operating profit (Underlying Profit) matched EBIT at USD 1,494.4 million (21.22% EBIT margin), yielding continuing profit after tax (PAT) of USD 948.5 million (USD 954.0 million total PAT).
LEAP India Limited generated consolidated operational revenue of INR 7,295.33 million (USD 83.71 million, converted at 1 USD = 87.1468 INR), reflecting a 56.39% year-over-year surge following the statutory merger of CHEP India Private Limited in April 2025. Total income reached INR 7,473.55 million (USD 85.76 million), delivering consolidated EBITDA of INR 3,788.30 million (USD 43.47 million, +38% YoY) and a 50.69% EBITDA margin. Profit before tax stood at INR 808.52 million (USD 9.28 million, an 11.08% PBT margin), and net PAT rose 66% YoY to INR 623.41 million (USD 7.15 million).
Table FY2026 Asset Pool and Property, Plant & Equipment (PPE) Roll-Forward: Brambles Limited vs. LEAP India Limited
| Roll-Forward Line Item (FY2026) | Brambles Limited (USD Millions) | LEAP India Limited (USD / INR Normalized) | Forensic Disclosures & Audit Mechanics |
| Beginning Pool Count | ~352 million assets | ~10.0–11.5 million assets | Brambles spans ~60 countries; LEAP baseline precedes CHEP India integration |
| Ending Pool Count | ~352 million assets | >14.7 million assets | LEAP enlarged platform through statutory consolidation |
| Beginning Gross Book Value | USD 8,774.8m (P&E) / $8,968.6m total | ~USD 68.0–75.0m | Brambles valuation at July 1, 2025 |
| Beginning Net Book Value (NBV) | USD 6,112.3m (P&E) / $6,218.3m total | ~USD 58.0–64.0m | Brambles baseline NBV |
| + Gross Additions (CapEx) | USD 1,089.7m (P&E) / $1,105.1m accrual | High-growth fleet expansion | Includes 1.3m US emergency pallets bought by Brambles |
| - Disposals / Scrapped Assets | (USD 119.1m) | Routine scrap & reconditioning | Brambles collected USD 202.0m in asset compensations |
| - Depreciation Charge | (USD 692.2m P&E / $708.9m total PPE) | Consolidated D&A charge | Straight-line across 5–10 years for Brambles; 3–7 years for LEAP |
| - Irrecoverable Provision (IPEP) | (USD 116.9m) | ~1.2%–2.0% estimated provision | Brambles expense up 25.0% YoY from USD 93.5m in FY2025 |
| +/- FX & Other Adjustments | (USD 0.1m) Net | Consolidation adjustment | FX (-
5.3m), Hyperinflation (+$0.7m) |
| Ending Gross Book Value | USD 9,224.7m (P&E) / $9,433.1m total | ~USD 120.0–135.0m | Position at June 30, 2026 |
| Accumulated D&A and IPEP | (USD 2,951.0m) | Consolidated balance | Brambles accumulated IPEP within D&A: USD 59.0m (FY25: $63.2m) |
| Ending Net Book Value (NBV) | USD 6,273.7m (P&E) / $6,378.4m total | ~USD 102.1m | Brambles carrying amount at June 30, 2026 |
Brambles' Irrecoverable Pooling Equipment Provision (IPEP) rose to USD 116.9 million, representing 1.66% of sales revenue, 1.86% of net plant and equipment book value, and 1.27% of gross plant cost. Implied physical losses represented 4.2 to 6.0 million units lost across non-customer channels, uncompensated distributor yards, and rogue recycling networks. In 4Q26, US repair bottlenecks forced 3.4 million unrepaired pallets into storage, reducing pool velocity and inducing unauthorized reuse that drove an incremental USD 10 million in uncompensated IPEP losses. LEAP India controlled its annualized loss rate within 1.2% to 2.0% across its 14.7 million assets, mitigating loss risks across traditional Indian trade networks through contractual indemnities and gate-pass serial scans across 10,000+ customer touchpoints.
Capital turnover metrics show Brambles generating an Asset Turnover on total PPE of 1.10x (1.12x on plant and equipment) and a Group Return on Capital Invested (ROCI) of 22.56% on Average Capital Invested (ACI) of USD 6,623.8 million. Average global cycle times of 80 to 120 days (Europe: 4.0–4.5 trips/year; US: 3.5–4.0 trips/year; APAC: 3.0–3.5 trips/year) contrast with LEAP India's asset turnover of ~0.82x on net PPE and cycle times of 100 to 145 days (2.5–3.5 trips/year). A 3.8-day cycle reduction at Brambles frees 11.5 million pallets, cutting capital expenditure by USD 135 million, reducing depreciation and IPEP by USD 22 million, and expanding Group ROCI by 100 basis points.
Infrastructure Footprint, Logistics Cost Structures, and Moats
Brambles deploys an operational mesh of 750+ service centers across ~60 countries, positioning hubs within 100 to 150 km of core FMCG distribution centers. The network combines company-owned facilities and third-party operating sites. Transport costs totaled USD 1,532.5 million (+7.8% YoY), consuming 21.76% of sales revenue and 26.22% of total operating expenses (USD 5,843.8 million). Plant operating costs reached USD 1,553.7 million (26.59% of OpEx). Subcontractor turnover in the Central and Northeastern US during 4Q26 forced emergency pallet transshipments at spot freight rates, generating a USD 35 million transport cost increase and an aggregate USD 55 million operational margin compression. Subcontracted freight accounted for 57.0% (703.7 ktCO2-e) of Brambles' 1,275.6 ktCO2-e Scope 3 footprint.
LEAP India operates 29 fulfillment centers serving 10,000+ touchpoints, concentrated in key corridors: Bhiwandi (Mumbai), Chakan/Bhosari (Pune), NCR (Delhi-Gurugram), Sriperumbudur (Chennai), Bengaluru, and Hyderabad. The merger of CHEP India eliminated overlapping facilities and redundant transit miles. LEAP's material handling subsidiary, TARON Material Handling Equipments Private Limited, posted FY2026 turnover of INR 1,172.41 million (USD 13.45 million) with total assets of INR 2,746.89 million (USD 31.52 million). Warehouse solar arrays in Hyderabad and Bhiwandi generated 58,990.5 kWh, cutting 58.81 tonnes of CO2. LEAP initiated GCC market penetration via LEAP Gulf Company (Riyadh, incorporated December 2025) and LEAP MENA Holdings Limited (ADGM, incorporated July 2026).
Revenue generation remains anchored in standard wooden platforms, contributing USD 6,564.3 million (93.2%) for Brambles and USD 70.52 million (INR 6,145.52 million standalone operational revenue) for LEAP India. Intermediate bulk containers, reusable plastic crates, and automotive units comprise the remainder: Brambles generated USD 331.6 million in Containers and USD 147.0 million in RPCs; LEAP leveraged CHEP India's client contracts across domestic automotive corridors.
To defend against asset leakage, Brambles is implementing its Serialisation+ architecture. Read infrastructure covers roughly two-thirds of planned pallet flows in the United States and 100% of flows in Chile, where manual customer inventory declarations and physical sample audits have been fully eliminated across 15 net new accounts. Over five years, Brambles directed USD 1.5 billion into group transformation (~USD 600 million in the US), including more than USD 90 million in FY2026 for central R&D, digital customer software, and its Global Automation & Technology Centre in Texas.
HDIN Institutional Verdict
Brambles' negative net working capital (-USD 936.7 million, -13.30% of sales) and low debt ratio (Net Debt to EBITDA of 1.17x against a 3.5x covenant limit) confirm balance sheet strength. S&P upgraded the credit rating to A- (stable) in October 2025, alongside Baa1 from Moody's. The company generated USD 1,983.3 million in operating cash flow, fully funding USD 1,096.7 million in cash PPE CapEx (1.81x coverage), USD 606.1 million in dividends, and USD 528.7 million in share repurchases, with financial leverage at 2.872x driving return on equity to 28.82%.
However, management's narrative attributing 4Q26 margin compression solely to external labor shortages obscures an operational vulnerability: an over-reliance on third-party service center labor and manual repair benches within the Central and Northeastern US network. This bottleneck resulted in an adverse USD 90 million Underlying Profit impact (USD 45 million in lost revenue, USD 35 million in spot freight rerouting, and USD 10 million in uncompensated IPEP leakage) and forced an unbudgeted procurement of 1.3 million emergency pallets. While commercial surcharge indexation recovered USD 299.3 million, pass-through time lags of 1 to 6 months leave earnings exposed to short-term cost spikes when timber prices rise (new pallet capital costs rose 4% in FY26).
Table DUPONT FINANCIAL DECOMPOSITION MATRIX
|
Metric |
Brambles Limited |
LEAP India Limited |
|---|---|---|
|
Operating Revenue |
USD 7,042.9 million |
USD 83.71 million |
|
Operating Margin (EBIT / Total Income) |
21.22% (EBIT / Sales) |
11.08% (PBT / Total Income) |
|
Asset Turnover (Sales / Average Assets) |
0.745x |
~0.68x–0.76x |
|
Financial Leverage (Assets / Equity) |
2.872x |
~2.80x–3.20x |
|
DuPont Return on Equity (ROE) |
28.82% |
~17.5%–19.5% |
|
Reported ROCI / Estimated ROCE |
22.56% (ROCI) |
~15.5%–17.0% (ROCE) |
|
Cash Flow from Operations (Statutory) |
USD 1,983.3 million |
Cash EBITDA: USD 43.47 million |
|
Gross Cash Capital Expenditure (PPE) |
USD 1,096.7 million |
Front-loaded fleet investment |
|
Cash Conversion Ratio (OCF / EBITDA) |
79.18% |
~72%–80% |
|
Net Working Capital (NWC) |
-USD 936.7 million |
Positive working capital buffer |
|
Net Debt / EBITDA |
1.17x |
IND A / Stable / IND A1 |
|
Revenue per Employee |
USD 601,597 |
USD 241,945 |
|
EBIT (or PBT) per Employee |
USD 127,650 |
USD 26,814 |
LEAP India displays the capital traits of a high-growth emerging-market platform. With a 50.69% EBITDA margin and bank facilities rated IND A/Stable/IND A1 by India Ratings, LEAP has expanded into the vacuum left by CHEP's domestic exit. Operating metrics—such as revenue per employee of USD 241,945 versus Brambles' USD 601,597—highlight its reliance on flexible local labor rather than high-density automation.
As LEAP advances its IPO (seeking up to INR 4,800 million in fresh issue equity alongside an INR 25,000 million offer for sale), long-term performance hinges on preventing working-capital dilution, maintaining asset controls across fragmented trade routes, and containing expansion drag as it scales operations in Saudi Arabia and the United Arab Emirates.
Presentation Download & Video Access:
- Presentation Download: Click the PDF download link under 'Related Topics' to access the full institutional presentation of this report.
- Video Link: Click this link to watch the HDIN analyst briefing on YouTube.
About HDIN Research:
HDIN Research is a premier global market intelligence and strategic advisory firm specializing in institutional-grade financial analysis, supply chain audits, and macroeconomic forecasting. Our dedicated sector analysts deliver actionable, data-driven insights tailored for private equity, hedge funds, and corporate strategy teams. Visit us at http://www.hdinresearch.com.
2026 AI Transparency Footer:
"This intelligence report was authored by HDIN Research analysts following a rigorous audit of official corporate filings. AI was utilized for massive-scale data synthesis and structural drafting, ensuring 100% inclusion of reported data points. All strategic insights, financial modeling, and final verdicts were verified by our editorial board to ensure professional accuracy and compliance with 2026 Google Search E-E-A-T standards."