Exascale Labs Holdings Inc.: Software-Orchestrated GaaS Surges 124.0% Across US and Asia-Pacific as 10.8x Float Expansion Tests Valuation Floor
Date : 2026-11-03
Reading : 228
HDIN Executive Takeaways
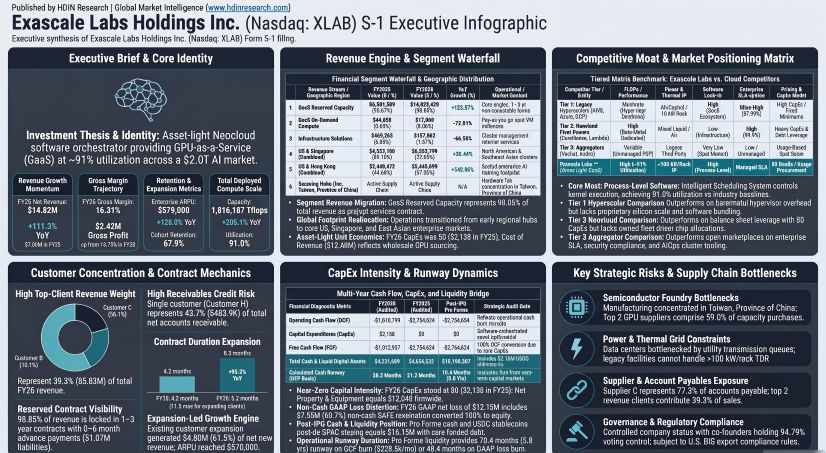
1. Exascale Labs Holdings Inc. [NASDAQ: XLAB] expanded net revenue 111.3% year-over-year to $14,822,799 in FY2026, driven by a 124.0% surge in GPU-as-a-Service (GaaS) and 128.0% ARPU expansion to $570,000.
2. The asset-light delivery architecture achieved zero FY2026 capital expenditures and 91.0% GPU utilization, but relies on East Asian fabrication foundries, while Supplier B and Supplier C generate 59.0% of total compute capacity sourcing.
3. Post-de-SPAC registration of 12,250,000 resale Class A shares expands the tradeable float 10.8 times above the 1,134,789-share baseline, creating severe downward overhang against 94.79% founder-controlled voting power.
Figure Exascale Labs S-1 Executive Infographic
 Segmental Realities, ASC 606 Contractual Architecture, and Operating Leverage
Exascale Labs Holdings Inc. operates as an asset-light orchestrator within the global artificial intelligence compute market, contextualized by Gartner’s forecast of over $2.0 trillion in global AI infrastructure spending by 2026, CreditSights’ projection of top-five hyperscaler capital expenditures escalating from $256.0 billion in 2024 to $602.0 billion in 2026, and McKinsey & Company’s estimate of $6.7 trillion in cumulative global data center investments through 2030 ($5.2 trillion, or 77.6%, dedicated to AI).
For the fiscal year ended June 30, 2026 (FY2026), Exascale Labs Holdings Inc. generated $14,822,799 in consolidated net revenue, an increase of 111.29% (+$7,807,287) compared to $7,015,512 in FY2025. Standalone quarterly historical results were not reported. The expansion was propelled by enterprise compute contracts, with existing customer expansion providing $4.80 million (61.5%) of net new revenue, while new enterprise acquisition generated $3.00 million (38.5%). Active accounts expanded from 28 in FY2025 to approximately 50 distinct clients in FY2026, driving average revenue per customer (ARPU) up 128.00% from $250,000 to $570,000. The cohort customer retention rate adjusted from ~90.0% in FY2025 to 67.86% in FY2026 (19 of 28 clients retained) as the business transitioned away from smaller regional users.
Under ASC Topic 606, revenues are recognized gross as principal across two offerings: Intelligent Computing Power Service (GaaS), treated as a single bundled performance obligation recognized over time using a time-elapsed output method; and Comprehensive Data Center Service (Infrastructure Solutions), recognized as distinct standalone performance obligations.
Table FY2025–FY2026 Revenue Breakdown by Business Segment, Growth Dynamics and ASC 606 Contract Structures
Operating capacity indicators expanded as the company shifted toward higher-density hardware:
* Average Contracted GPU Supply: Rose 38.43% from 935.3 to 1,294.7 GPUs; average theoretical compute power contracted rose 199.23% from 733,231 Tflops to 2,194,087 Tflops.
* Average Deployed GPU Capacity: Rose 41.39% from 816.7 to 1,154.7 GPUs; average theoretical compute power deployed rose 205.13% from 595,289 Tflops to 1,816,187 Tflops.
* Average Customer-Contracted GPU Capacity: Rose 39.23% from 754.7 to 1,050.8 GPUs; theoretical contracted power rose 196.87% from 532,238 Tflops to 1,580,057 Tflops.
* Available vs. Billable Volume: Available GPU-hours increased 41.39% from 7,154,000 to 10,114,880 hours; billable GPU-hours monetized grew 39.24% from 6,610,880 to 9,205,008 hours.
* Utilization & Duration: Deployed GPU utilization contracted by 140 basis points from 92.40% to 91.00%. Weighted-average remaining contract term doubled, rising 95.24% from 4.2 months to 8.2 months, while expanding enterprise accounts averaged 11.8 months.
* Revenue Backlog: Contract liabilities (unearned revenue from advance payments) climbed 147.34% from $432,760 on June 30, 2025, to $1,070,378 on June 30, 2026.
Table FY2025–FY2026 Consolidated Financial Performance, Cash Flow, Liquidity and Balance Sheet Analysis
Income tax expense was $0 in FY2025 and $800 in FY2026. In accordance with ASC 740, management maintains a 100% valuation allowance against all net deferred tax assets, covering $9.90 million in U.S. federal net operating loss (NOL) carryforwards and $6.10 million in state NOL carryforwards (both expanded from $5.60 million in FY2025). Share-based compensation expense dropped from $153,266 in FY2025 to $0 in FY2026 prior to the post-IPO adoption of the 2026 Omnibus Equity Incentive Plan.
Physical Supply Chain Architecture, East Asian Bottlenecks, and Infrastructure Assets
Exascale Labs Holdings Inc. decouples its orchestration layer from physical asset ownership, holding zero real estate, data center parcels, or greenfield utility connections. The company's physical presence is restricted to leased corporate offices in Houston, Texas (5 full-time personnel), and an operating subsidiary, Evana Alpha Pte. Ltd., in Singapore (7 full-time personnel), representing 12 full-time employees firmwide.
Geographic revenue generated across paired regional markets indicates an operational pivot:
* FY2024 (Phase 1): Initial commercial revenue originated in Canada and Hong Kong.
* FY2025 (Phase 2): United States & Singapore combined contributed $4,567,100 (65.10% of total revenue); United States & Hong Kong combined generated $2,448,412 (34.90%).
* FY2026 (Phase 3): United States & Hong Kong combined scaled to $8,448,995 (57.00% of total revenue); United States & Singapore combined represented $6,322,799 (42.65%), distributed across approximately 50 global enterprise accounts.
The operating model relies on third-party AI Data Centers (AIDCs) and specialized GPU capacity suppliers under usage-based, non-exclusive arrangements. These agreements exclude take-or-pay clauses, minimum purchase commitments, long-term capital leases, and standalone power purchase agreements (PPAs), bundling power, thermal cooling, rack space, and networking into operational capacity fees. However, this structure concentrates operational exposure:
* Advanced Silicon Sourcing: Accelerators (e.g., NVIDIA H100, H200, Blackwell series) depend on single-source semiconductor fabrication foundries located in Taiwan, Province of China. Compute deployment remains subject to U.S. Export Administration Regulations (EAR) and Bureau of Industry and Security (BIS) compliance, including proposed rules regarding Infrastructure-as-a-Service (IaaS) foreign client monitoring.
* Thermal & Power Grid Interconnects: High-density accelerators generate Thermal Design Power (TDP) exceeding 1,000 Watts per GPU, rendering legacy air-cooled facilities (10–15 kW per rack) obsolete and requiring direct-to-chip liquid cooling and facility densities exceeding 100 kW per rack. Deployment remains restricted by municipal utility queues and transmission bottlenecks.
* Capacity Supplier Concentration: In FY2026, compute sourcing was dominated by four vendors: Supplier B represented 31.0%, Supplier C represented 28.0%, Supplier D represented 18.4%, and Supplier E represented 11.1% of total capacity purchases (Top 2 = 59.0%). Supplier C accounted for 77.3% of total outstanding accounts payable as of June 30, 2026.
* Customer Counterparty Concentration: FY2026 revenue was anchored by Customer C ($2.98 million, 20.1%) and Customer D ($2.85 million, 19.2%), comprising 39.3% ($5.83 million) of net revenue, shifting from FY2025 anchors Customer A (14.0%) and Customer B (12.5%). Accounts receivable concentration is elevated: Customer H comprised 43.7% ($483,900) of net receivables ($1.11 million total; allowance for credit losses of $38,022), followed by Customer I at 12.8% and Customer D at 10.2% (Top 2 = 56.5%), whereas FY2025 receivables were concentrated in Customer E (42.7%), Customer F (38.3%), and Customer G (19.0%).
To mitigate infrastructure bottlenecks, Exascale Labs Holdings Inc. developed proprietary, pre-commercial technology assets:
* Granted Intellectual Property: U.S. Patent No. 12,058,179, "Computing Power Network System" (granted August 6, 2024).
* Pending Patent Applications: U.S. App No. 19/440,612, "AIOps Scheduling Method and System Based on Multi-Agent Collaborative Autonomy" (filed January 5, 2026); U.S. App No. 19/440,577, "An Adaptive External Supply-and-Return Water Temperature Regulation System and Method for a Modular Data Center" (filed January 5, 2026); U.S. App No. 19/444,167, "A Method and System for Maximizing Throughput of a GPU Cluster" (filed January 8, 2026).
* Software Copyright: "Exascale Artificial Intelligence Computing Power Management Platform", Case No. 1-15021399291 (filed October 15, 2025).
HDIN Institutional Verdict: Capital Structure Overhang, Related-Party Exposures, and Governance Audit
An institutional audit of Exascale Labs Holdings Inc.'s capital architecture confirms significant structural overhang resulting from the August 27, 2026 de-SPAC transaction with D. Boral ARC Acquisition I Corp. While the conversion of $29.12 million in Simple Agreements for Future Equity (SAFEs) eliminated volatile Level 3 P&L fair-value adjustments, the S-1 registration of 12,250,000 resale Class A common shares and 100,000 warrant shares expands immediately tradable supply 10.8 times above the baseline public float of 1,134,789 shares (1.76% of basic capitalization). Against an October 29, 2026 share price of $3.15, this registration creates structural selling resistance.
The share dilution bridge outlines total potential share expansion:
The conversion schedule from the business combination comprised:
* Legacy SAFEs: Converted into 8,864,761 Class A shares (13.78% economic ownership, 1.37% voting power).
* Base Camp Agreement: Converted into 312,500 Class A shares.
* Legacy Equity Incentive Awards: Converted into 77,000 Class A shares.
* Legacy Class A Stockholders: Converted into 10,100,000 Class A shares.
* Legacy Class B Stockholders: Converted into 30,645,739 Class B shares (carrying 20 votes per share).
* Institutional Allocations: MilunaC Technology Limited (Hao Yuan, CEO) holds 5,926,956 Class A shares (9.21% economic, 0.92% voting); ARC Group International Limited (Abraham Cinta, CEO) holds 4,946,413 Class A shares (7.69% economic, 0.76% voting); Sponsor MFH 1, LLC holds 12,200,000 Class A shares (18.96% economic, 1.89% voting; originally 12,000,000 founder shares purchased for $25,000, alongside a $350,000 promissory line where $225,461 was drawn and repaid); Public and other holders maintain 1,750,920 Class A shares (2.72% economic, 0.27% voting).
Subsequent float distribution events follow a strict chronological schedule:
* FINRA Underwriter Lock-Up (Expires February 23, 2027): 1,000,000 Class A Representative Shares held by D. Boral Capital LLC (issued at a deemed value of $10.00 per share, or $10.00 million) locked under FINRA Rule 5110(e)(1).
* Six-Month Post-Closing Insider Lock-Up (Expires February 27, 2027): Releases 50,000,000 common shares (19,354,261 Class A and 30,645,739 Class B) held by former Legacy Exascale insiders. Releases automatically upon a Change of Control, with early sponsor founder releases if Class A shares trade at or above $12.00 for 20 of 30 trading days starting 150 days post-closing.
* Warrant Expiration (August 27, 2031): 14,099,992 warrants exercisable at $11.50 per share. The company may redeem them at $0.01 per warrant if the stock equals or exceeds $18.00 for 20 of 30 trading days. Full cash exercise would yield $162.15 million in cash proceeds.
Corporate governance analysis reveals significant concentration risks. Under the amended certificate of incorporation (authorizing 260,000,000 Class A, 35,000,000 Class B, and 5,000,000 Preferred shares with par value $0.0001; zero preferred shares outstanding), Co-Founders Wenying Jia (Chairperson, Class II Director, holding 25,645,739 Class B shares via Zerowave Ltd; 39.86% economic, 79.33% voting) and Dr. Hoansoo Lee (CEO, Class III Director, holding 5,000,000 Class B shares via HSL Capital and family trusts; 7.77% economic, 15.46% voting) control 612,914,780 votes, or 94.79% of total voting power.
Operating as a "Controlled Company" under Nasdaq rules, the company is exempt from independent board majority and nominating committee requirements, reinforced by a staggered board (Class I terms expire 2027: Jaeyoung Shin [Audit Chair], Dr. Shachar Kariv; Class II terms expire 2028: Wenying Jia, Dr. David Card [Lead Independent Director, Nobel Laureate]; Class III term expires 2029: Dr. Hoansoo Lee), a 66 2/3% supermajority vote requirement to amend charter or bylaws, and an absence of cumulative voting.
Forensic audit logs highlight historical non-arm’s-length transactions:
* CEO Compensation Step-Up: Dr. Hoansoo Lee was historically paid via contractor consulting fees ($75,245 in FY2024; $100,150 in FY2025; $27,000 in Q1 FY2026 at $9,000 per month). On October 1, 2025, he transitioned to employee status at a base salary of $108,000 per year ($81,000 earned, totaling $108,000 cash in FY2026). Effective August 27, 2026, his post-closing agreement increased his base salary by 288.89% to $420,000 per annum, with a $150,000 annual cash bonus starting in FY2028, 900,000 Class A RSUs vesting over three years (300,000 RSUs annually), and 300,000 ARR performance RSUs ($20.0 million and $30.0 million thresholds). His golden parachute guarantees full salary and bonuses through August 27, 2029, alongside 100% RSU acceleration upon a Change-in-Control termination. This structural reset adds $312,000 in fixed annual cash overhead.
* CFO Terms & Advisory Overlap: CFO Jake Carney (appointed September 25, 2026) receives $6,000 monthly ($72,000 annually) at-will with one month's notice, without equity participation. Carney previously served as Managing Director at ARC Group Limited until April 2025, which holds 4,946,413 Class A shares.
* Sponsor Affiliated Transactions: BCAR paid $20,000 monthly ($120,000 in the six months ended June 30, 2026) to an affiliate of MFH 1, LLC for office space and administrative support, terminated upon transaction closing.
* Material Internal Control Deficiencies: Management cited material weaknesses in internal control over financial reporting, specifically a deficiency of U.S. GAAP personnel and SEC disclosure protocols. In FY2025 and FY2026, an individual employee held up to $1,207,626 in investor SAFE proceeds in trust within personal or designated accounts (recorded under "Other Receivables" on June 30, 2025; SAFE proceeds handled totaled $32,500 in FY2025 and $500,000 in FY2026), disbursing supplier payments directly at management's instruction. While fully resolved to $0 by June 30, 2026, this informal treasury workaround demonstrates historic control lapses.
Independent auditor HTL International, LLC issued an unqualified opinion on September 28, 2026, omitting Critical Audit Matters (CAMs) due to Emerging Growth Company status, with no SOX 404(b) attestation conducted.
Total fixed contractual cash commitments outside operations remain low: zero funded debt, zero facility leases, zero take-or-pay capacity liabilities, zero unfulfilled CapEx commitments, and $1,260,000 in total future executive base salary obligations ($420,000 due in less than 1 year; $840,000 due in 1–3 years). No material litigation, patent infringement proceedings, or regulatory inquiries are outstanding.
Exascale Labs Holdings Inc. displays top-line momentum and zero hardware debt, but institutional capital must weigh the commercial viability of its 16.31% gross margin against the immediate market pressure of a 10.8x float expansion and total founder voting control.
Presentation Download & Video Access:
* Presentation Download: Click the PDF download link under 'Related Topics' to access the full institutional presentation of this report.
* Video Link: Click this link to watch the HDIN analyst briefing on YouTube.
About HDIN Research:
HDIN Research is a premier global market intelligence and strategic advisory firm specializing in institutional-grade financial analysis, supply chain audits, and macroeconomic forecasting. Our dedicated sector analysts deliver actionable, data-driven insights tailored for private equity, hedge funds, and corporate strategy teams. Visit us at http://www.hdinresearch.com.
2026 AI Transparency Footer:
"This intelligence report was authored by HDIN Research analysts following a rigorous audit of official corporate filings. AI was utilized for massive-scale data synthesis and structural drafting, ensuring 100% inclusion of reported data points. All strategic insights, financial modeling, and final verdicts were verified by our editorial board to ensure professional accuracy and compliance with 2026 Google Search E-E-A-T standards."
1. Exascale Labs Holdings Inc. [NASDAQ: XLAB] expanded net revenue 111.3% year-over-year to $14,822,799 in FY2026, driven by a 124.0% surge in GPU-as-a-Service (GaaS) and 128.0% ARPU expansion to $570,000.
2. The asset-light delivery architecture achieved zero FY2026 capital expenditures and 91.0% GPU utilization, but relies on East Asian fabrication foundries, while Supplier B and Supplier C generate 59.0% of total compute capacity sourcing.
3. Post-de-SPAC registration of 12,250,000 resale Class A shares expands the tradeable float 10.8 times above the 1,134,789-share baseline, creating severe downward overhang against 94.79% founder-controlled voting power.
Figure Exascale Labs S-1 Executive Infographic
Segmental Realities, ASC 606 Contractual Architecture, and Operating LeverageExascale Labs Holdings Inc. operates as an asset-light orchestrator within the global artificial intelligence compute market, contextualized by Gartner’s forecast of over $2.0 trillion in global AI infrastructure spending by 2026, CreditSights’ projection of top-five hyperscaler capital expenditures escalating from $256.0 billion in 2024 to $602.0 billion in 2026, and McKinsey & Company’s estimate of $6.7 trillion in cumulative global data center investments through 2030 ($5.2 trillion, or 77.6%, dedicated to AI).
For the fiscal year ended June 30, 2026 (FY2026), Exascale Labs Holdings Inc. generated $14,822,799 in consolidated net revenue, an increase of 111.29% (+$7,807,287) compared to $7,015,512 in FY2025. Standalone quarterly historical results were not reported. The expansion was propelled by enterprise compute contracts, with existing customer expansion providing $4.80 million (61.5%) of net new revenue, while new enterprise acquisition generated $3.00 million (38.5%). Active accounts expanded from 28 in FY2025 to approximately 50 distinct clients in FY2026, driving average revenue per customer (ARPU) up 128.00% from $250,000 to $570,000. The cohort customer retention rate adjusted from ~90.0% in FY2025 to 67.86% in FY2026 (19 of 28 clients retained) as the business transitioned away from smaller regional users.
Under ASC Topic 606, revenues are recognized gross as principal across two offerings: Intelligent Computing Power Service (GaaS), treated as a single bundled performance obligation recognized over time using a time-elapsed output method; and Comprehensive Data Center Service (Infrastructure Solutions), recognized as distinct standalone performance obligations.
Table FY2025–FY2026 Revenue Breakdown by Business Segment, Growth Dynamics and ASC 606 Contract Structures
| Business Segment / Revenue Stream | FY2025 Revenue ($) | FY2025 Share (%) | FY2026 Revenue ($) | FY2026 Share (%) | YoY Dollar Change ($) | YoY Growth Rate (%) | ASC 606 Contract Structure & Term Mechanics |
| GPU-as-a-Service (GaaS) | $6,546,249 | 93.31% | $14,664,937 | 98.93% | +$8,118,688 | +124.02% | Bundled bare-metal/VM instances; output method. |
| — Reserved Capacity Arrangements | $6,501,569 | 92.67% | $14,652,429 | 98.85% | +$8,150,860 | +125.37% | 1–3 yr non-cancelable; 0–6 mo prepayments. |
| — On-Demand Arrangements | $44,680 | 0.64% | $12,508 | 0.08% | -$32,172 | -72.01% | Spot usage; billed hourly per consumed GPU-hour. |
| Infrastructure Solutions | $469,263 | 6.69% | $157,862 | 1.07% | -$311,401 | -66.36% | Project milestones & SLA monthly retainers. |
| — GPU Cluster Management Services | $469,263 | 6.69% | $157,862 | 1.07% | -$311,401 | -66.36% | Full lifecycle operational tooling for 2 AIDC clients. |
| — Modular DC / Liquid Cooling / Power IP | $0 | 0.00% | $0 | 0.00% | $0 | N/A | Systems integration/EPC royalties; pre-revenue. |
| Total Consolidated Net Revenues | $7,015,512 | 100.00% | $14,822,799 | 100.00% | +$7,807,287 | +111.29% | Gross basis as principal across all streams. |
Operating capacity indicators expanded as the company shifted toward higher-density hardware:
* Average Contracted GPU Supply: Rose 38.43% from 935.3 to 1,294.7 GPUs; average theoretical compute power contracted rose 199.23% from 733,231 Tflops to 2,194,087 Tflops.
* Average Deployed GPU Capacity: Rose 41.39% from 816.7 to 1,154.7 GPUs; average theoretical compute power deployed rose 205.13% from 595,289 Tflops to 1,816,187 Tflops.
* Average Customer-Contracted GPU Capacity: Rose 39.23% from 754.7 to 1,050.8 GPUs; theoretical contracted power rose 196.87% from 532,238 Tflops to 1,580,057 Tflops.
* Available vs. Billable Volume: Available GPU-hours increased 41.39% from 7,154,000 to 10,114,880 hours; billable GPU-hours monetized grew 39.24% from 6,610,880 to 9,205,008 hours.
* Utilization & Duration: Deployed GPU utilization contracted by 140 basis points from 92.40% to 91.00%. Weighted-average remaining contract term doubled, rising 95.24% from 4.2 months to 8.2 months, while expanding enterprise accounts averaged 11.8 months.
* Revenue Backlog: Contract liabilities (unearned revenue from advance payments) climbed 147.34% from $432,760 on June 30, 2025, to $1,070,378 on June 30, 2026.
Table FY2025–FY2026 Consolidated Financial Performance, Cash Flow, Liquidity and Balance Sheet Analysis
| Consolidated Financial Statement Metrics | FY2025 (Ended June 30, 2025) ($) | FY2026 (Ended June 30, 2026) ($) | YoY Change (%) / Delta | Audit Notes & Accounting Treatment |
| Cost of Goods Sold (COGS) | $5,910,315 | $12,404,546 | +109.88% | Third-party supplier capacity, colocation, direct power. |
| Consolidated Gross Profit | $1,105,197 | $2,418,253 | +118.81% | Gross margin expanded 56 bps from 15.75% to 16.31%. |
| Research & Development (R&D) | $2,797,906 | $5,490,185 | +96.22% | 100% expensed as incurred under ASC 730; $0 capitalized. |
| Selling & Marketing (S&M) | $989,155 | $499,392 | -49.51% | S&M expense ratio fell 1,073 bps from 14.10% to 3.37%. |
| General & Administrative (G&A) | $362,982 | $1,229,516 | +238.73% | Reflects public compliance scaling and administrative costs. |
| Total Operating Expenses | $4,150,043 | $7,219,093 | +73.95% | Excludes direct hosting costs embedded in COGS. |
| Operating Loss | -$3,044,846 | -$4,800,840 | +57.67% | Unmitigated by software capitalization. |
| SAFE Fair Value Adjustment (Non-Cash) | -$4,614,821 | -$7,377,383 | +59.86% | Level 3 fair-value revaluation; 60.66% of FY26 net loss. |
| GAAP Consolidated Net Loss | -$7,659,667 | -$12,162,391 | +58.78% | Distorted by pre-closing SAFE liability accounting. |
| Pro Forma Combined Net Loss | N/A | -$6,049,020 | N/A | Reflects post-closing capital structure baseline. |
| Operating Cash Flow (OCF) | -$1,010,799 | -$2,754,624 | +172.52% | Monthly OCF burn escalated from ~
229,552. |
| Capital Expenditures (CapEx) | $2,138 | $0 | -100.00% | Zero hardware CapEx; asset-light model verification. |
| Free Cash Flow (FCF = OCF - CapEx) | -$1,012,937 | -$2,754,624 | +171.94% | Identical to OCF due to zero FY2026 asset acquisition. |
| Cash & Cash Equivalents (Standalone) | $4,231,689 | $2,693,586 | -36.35% | June 30 balance sheet baseline. |
| USDC Stablecoin Holding | $0 | $2,160,746 | N/A | Current digital asset held with single third-party custodian. |
| Total Standalone Liquid Reserves | $4,231,689 | $4,854,332 | +14.71% | Combined cash and USDC holdings. |
| Pro Forma Post-Closing Liquidity | N/A | $16,150,207 | N/A | Provides 40.4 to 70.4 months (3.4 to 5.8 yrs) cash runway. |
| Funded Debt / Financial Borrowings | $0 | $0 | 0.00% | Zero funded bank debt, notes, or credit lines. |
| Property & Equipment, Net | $19,600 | $12,840 | -34.49% | Validates total absence of physical facility real estate. |
| Total Liabilities (Pre-Conversion) | $20,319,721 | $31,885,500 | +56.92% | Included $29.12M in Level 3 SAFE conversion obligations. |
| Pro Forma Total Liabilities | N/A | $2,714,232 | N/A | Accounts payable and contract customer liabilities. |
Income tax expense was $0 in FY2025 and $800 in FY2026. In accordance with ASC 740, management maintains a 100% valuation allowance against all net deferred tax assets, covering $9.90 million in U.S. federal net operating loss (NOL) carryforwards and $6.10 million in state NOL carryforwards (both expanded from $5.60 million in FY2025). Share-based compensation expense dropped from $153,266 in FY2025 to $0 in FY2026 prior to the post-IPO adoption of the 2026 Omnibus Equity Incentive Plan.
Physical Supply Chain Architecture, East Asian Bottlenecks, and Infrastructure Assets
Exascale Labs Holdings Inc. decouples its orchestration layer from physical asset ownership, holding zero real estate, data center parcels, or greenfield utility connections. The company's physical presence is restricted to leased corporate offices in Houston, Texas (5 full-time personnel), and an operating subsidiary, Evana Alpha Pte. Ltd., in Singapore (7 full-time personnel), representing 12 full-time employees firmwide.
Geographic revenue generated across paired regional markets indicates an operational pivot:
* FY2024 (Phase 1): Initial commercial revenue originated in Canada and Hong Kong.
* FY2025 (Phase 2): United States & Singapore combined contributed $4,567,100 (65.10% of total revenue); United States & Hong Kong combined generated $2,448,412 (34.90%).
* FY2026 (Phase 3): United States & Hong Kong combined scaled to $8,448,995 (57.00% of total revenue); United States & Singapore combined represented $6,322,799 (42.65%), distributed across approximately 50 global enterprise accounts.
The operating model relies on third-party AI Data Centers (AIDCs) and specialized GPU capacity suppliers under usage-based, non-exclusive arrangements. These agreements exclude take-or-pay clauses, minimum purchase commitments, long-term capital leases, and standalone power purchase agreements (PPAs), bundling power, thermal cooling, rack space, and networking into operational capacity fees. However, this structure concentrates operational exposure:
* Advanced Silicon Sourcing: Accelerators (e.g., NVIDIA H100, H200, Blackwell series) depend on single-source semiconductor fabrication foundries located in Taiwan, Province of China. Compute deployment remains subject to U.S. Export Administration Regulations (EAR) and Bureau of Industry and Security (BIS) compliance, including proposed rules regarding Infrastructure-as-a-Service (IaaS) foreign client monitoring.
* Thermal & Power Grid Interconnects: High-density accelerators generate Thermal Design Power (TDP) exceeding 1,000 Watts per GPU, rendering legacy air-cooled facilities (10–15 kW per rack) obsolete and requiring direct-to-chip liquid cooling and facility densities exceeding 100 kW per rack. Deployment remains restricted by municipal utility queues and transmission bottlenecks.
* Capacity Supplier Concentration: In FY2026, compute sourcing was dominated by four vendors: Supplier B represented 31.0%, Supplier C represented 28.0%, Supplier D represented 18.4%, and Supplier E represented 11.1% of total capacity purchases (Top 2 = 59.0%). Supplier C accounted for 77.3% of total outstanding accounts payable as of June 30, 2026.
* Customer Counterparty Concentration: FY2026 revenue was anchored by Customer C ($2.98 million, 20.1%) and Customer D ($2.85 million, 19.2%), comprising 39.3% ($5.83 million) of net revenue, shifting from FY2025 anchors Customer A (14.0%) and Customer B (12.5%). Accounts receivable concentration is elevated: Customer H comprised 43.7% ($483,900) of net receivables ($1.11 million total; allowance for credit losses of $38,022), followed by Customer I at 12.8% and Customer D at 10.2% (Top 2 = 56.5%), whereas FY2025 receivables were concentrated in Customer E (42.7%), Customer F (38.3%), and Customer G (19.0%).
To mitigate infrastructure bottlenecks, Exascale Labs Holdings Inc. developed proprietary, pre-commercial technology assets:
* Granted Intellectual Property: U.S. Patent No. 12,058,179, "Computing Power Network System" (granted August 6, 2024).
* Pending Patent Applications: U.S. App No. 19/440,612, "AIOps Scheduling Method and System Based on Multi-Agent Collaborative Autonomy" (filed January 5, 2026); U.S. App No. 19/440,577, "An Adaptive External Supply-and-Return Water Temperature Regulation System and Method for a Modular Data Center" (filed January 5, 2026); U.S. App No. 19/444,167, "A Method and System for Maximizing Throughput of a GPU Cluster" (filed January 8, 2026).
* Software Copyright: "Exascale Artificial Intelligence Computing Power Management Platform", Case No. 1-15021399291 (filed October 15, 2025).
HDIN Institutional Verdict: Capital Structure Overhang, Related-Party Exposures, and Governance Audit
An institutional audit of Exascale Labs Holdings Inc.'s capital architecture confirms significant structural overhang resulting from the August 27, 2026 de-SPAC transaction with D. Boral ARC Acquisition I Corp. While the conversion of $29.12 million in Simple Agreements for Future Equity (SAFEs) eliminated volatile Level 3 P&L fair-value adjustments, the S-1 registration of 12,250,000 resale Class A common shares and 100,000 warrant shares expands immediately tradable supply 10.8 times above the baseline public float of 1,134,789 shares (1.76% of basic capitalization). Against an October 29, 2026 share price of $3.15, this registration creates structural selling resistance.
The share dilution bridge outlines total potential share expansion:
| Share Class / Convertible Instrument | Shares Outstanding / Reserved | % of Basic Common Shares | % of Fully Diluted Capitalization | Exercise Terms & S-1 Conversion Mechanics |
| Class A Common Stock (Public & Inst.) | 33,689,050 | 52.36% | 38.10% | 1 vote per share; public float = 1,134,789 shares (1.76%). |
| Class B Common Stock (Co-Founders) | 30,645,739 | 47.64% | 34.65% | 20 votes per share; 1:1 convertible into Class A. |
| Total Basic Common Shares Outstanding | 64,334,789 | 100.00% | 72.75% | Basic Capitalization Baseline (as of October 29, 2026). |
| Public & Private Placement Warrants | 14,099,992 | 21.92% | 15.94% | Exercisable at $11.50/share; expires Aug 27, 2031; call at $18.00. |
| 2026 Omnibus Equity Incentive Reserve | 10,000,000 | 15.54% | 11.31% | Class A share pool; features 5.0% annual evergreen clause. |
| Total Fully Diluted Capitalization | 88,434,781 | 137.46% | 100.00% | Fully Diluted Share Basis. |
The conversion schedule from the business combination comprised:
* Legacy SAFEs: Converted into 8,864,761 Class A shares (13.78% economic ownership, 1.37% voting power).
* Base Camp Agreement: Converted into 312,500 Class A shares.
* Legacy Equity Incentive Awards: Converted into 77,000 Class A shares.
* Legacy Class A Stockholders: Converted into 10,100,000 Class A shares.
* Legacy Class B Stockholders: Converted into 30,645,739 Class B shares (carrying 20 votes per share).
* Institutional Allocations: MilunaC Technology Limited (Hao Yuan, CEO) holds 5,926,956 Class A shares (9.21% economic, 0.92% voting); ARC Group International Limited (Abraham Cinta, CEO) holds 4,946,413 Class A shares (7.69% economic, 0.76% voting); Sponsor MFH 1, LLC holds 12,200,000 Class A shares (18.96% economic, 1.89% voting; originally 12,000,000 founder shares purchased for $25,000, alongside a $350,000 promissory line where $225,461 was drawn and repaid); Public and other holders maintain 1,750,920 Class A shares (2.72% economic, 0.27% voting).
Subsequent float distribution events follow a strict chronological schedule:
* FINRA Underwriter Lock-Up (Expires February 23, 2027): 1,000,000 Class A Representative Shares held by D. Boral Capital LLC (issued at a deemed value of $10.00 per share, or $10.00 million) locked under FINRA Rule 5110(e)(1).
* Six-Month Post-Closing Insider Lock-Up (Expires February 27, 2027): Releases 50,000,000 common shares (19,354,261 Class A and 30,645,739 Class B) held by former Legacy Exascale insiders. Releases automatically upon a Change of Control, with early sponsor founder releases if Class A shares trade at or above $12.00 for 20 of 30 trading days starting 150 days post-closing.
* Warrant Expiration (August 27, 2031): 14,099,992 warrants exercisable at $11.50 per share. The company may redeem them at $0.01 per warrant if the stock equals or exceeds $18.00 for 20 of 30 trading days. Full cash exercise would yield $162.15 million in cash proceeds.
Corporate governance analysis reveals significant concentration risks. Under the amended certificate of incorporation (authorizing 260,000,000 Class A, 35,000,000 Class B, and 5,000,000 Preferred shares with par value $0.0001; zero preferred shares outstanding), Co-Founders Wenying Jia (Chairperson, Class II Director, holding 25,645,739 Class B shares via Zerowave Ltd; 39.86% economic, 79.33% voting) and Dr. Hoansoo Lee (CEO, Class III Director, holding 5,000,000 Class B shares via HSL Capital and family trusts; 7.77% economic, 15.46% voting) control 612,914,780 votes, or 94.79% of total voting power.
Operating as a "Controlled Company" under Nasdaq rules, the company is exempt from independent board majority and nominating committee requirements, reinforced by a staggered board (Class I terms expire 2027: Jaeyoung Shin [Audit Chair], Dr. Shachar Kariv; Class II terms expire 2028: Wenying Jia, Dr. David Card [Lead Independent Director, Nobel Laureate]; Class III term expires 2029: Dr. Hoansoo Lee), a 66 2/3% supermajority vote requirement to amend charter or bylaws, and an absence of cumulative voting.
Forensic audit logs highlight historical non-arm’s-length transactions:
* CEO Compensation Step-Up: Dr. Hoansoo Lee was historically paid via contractor consulting fees ($75,245 in FY2024; $100,150 in FY2025; $27,000 in Q1 FY2026 at $9,000 per month). On October 1, 2025, he transitioned to employee status at a base salary of $108,000 per year ($81,000 earned, totaling $108,000 cash in FY2026). Effective August 27, 2026, his post-closing agreement increased his base salary by 288.89% to $420,000 per annum, with a $150,000 annual cash bonus starting in FY2028, 900,000 Class A RSUs vesting over three years (300,000 RSUs annually), and 300,000 ARR performance RSUs ($20.0 million and $30.0 million thresholds). His golden parachute guarantees full salary and bonuses through August 27, 2029, alongside 100% RSU acceleration upon a Change-in-Control termination. This structural reset adds $312,000 in fixed annual cash overhead.
* CFO Terms & Advisory Overlap: CFO Jake Carney (appointed September 25, 2026) receives $6,000 monthly ($72,000 annually) at-will with one month's notice, without equity participation. Carney previously served as Managing Director at ARC Group Limited until April 2025, which holds 4,946,413 Class A shares.
* Sponsor Affiliated Transactions: BCAR paid $20,000 monthly ($120,000 in the six months ended June 30, 2026) to an affiliate of MFH 1, LLC for office space and administrative support, terminated upon transaction closing.
* Material Internal Control Deficiencies: Management cited material weaknesses in internal control over financial reporting, specifically a deficiency of U.S. GAAP personnel and SEC disclosure protocols. In FY2025 and FY2026, an individual employee held up to $1,207,626 in investor SAFE proceeds in trust within personal or designated accounts (recorded under "Other Receivables" on June 30, 2025; SAFE proceeds handled totaled $32,500 in FY2025 and $500,000 in FY2026), disbursing supplier payments directly at management's instruction. While fully resolved to $0 by June 30, 2026, this informal treasury workaround demonstrates historic control lapses.
Independent auditor HTL International, LLC issued an unqualified opinion on September 28, 2026, omitting Critical Audit Matters (CAMs) due to Emerging Growth Company status, with no SOX 404(b) attestation conducted.
Total fixed contractual cash commitments outside operations remain low: zero funded debt, zero facility leases, zero take-or-pay capacity liabilities, zero unfulfilled CapEx commitments, and $1,260,000 in total future executive base salary obligations ($420,000 due in less than 1 year; $840,000 due in 1–3 years). No material litigation, patent infringement proceedings, or regulatory inquiries are outstanding.
Exascale Labs Holdings Inc. displays top-line momentum and zero hardware debt, but institutional capital must weigh the commercial viability of its 16.31% gross margin against the immediate market pressure of a 10.8x float expansion and total founder voting control.
Presentation Download & Video Access:
* Presentation Download: Click the PDF download link under 'Related Topics' to access the full institutional presentation of this report.
* Video Link: Click this link to watch the HDIN analyst briefing on YouTube.
About HDIN Research:
HDIN Research is a premier global market intelligence and strategic advisory firm specializing in institutional-grade financial analysis, supply chain audits, and macroeconomic forecasting. Our dedicated sector analysts deliver actionable, data-driven insights tailored for private equity, hedge funds, and corporate strategy teams. Visit us at http://www.hdinresearch.com.
2026 AI Transparency Footer:
"This intelligence report was authored by HDIN Research analysts following a rigorous audit of official corporate filings. AI was utilized for massive-scale data synthesis and structural drafting, ensuring 100% inclusion of reported data points. All strategic insights, financial modeling, and final verdicts were verified by our editorial board to ensure professional accuracy and compliance with 2026 Google Search E-E-A-T standards."