Chilwa Minerals Ltd.: Downstream Separation Pivot Near Lake Chilwa as A$969k Monthly Burn Signals Looming Q2 2027 Capital Exhaustion
Date : 2026-11-04
Reading : 111
HDIN Executive Takeaways
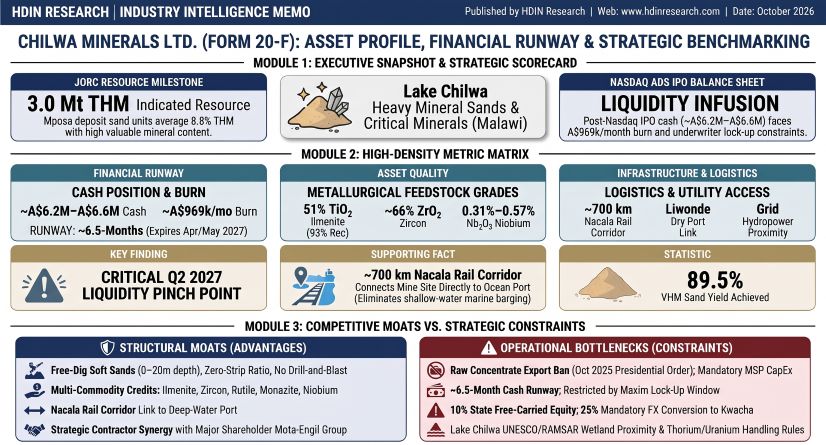
1. Chilwa Minerals Ltd. faces a critical liquidity pinch point by May 2027 as its A$6.2M to A$6.6M post-IPO cash runway depletes at A$969k per month against a Maxim Group LLC equity lock-up covenant expiring April 2, 2027.
2. Presidential decrees prohibiting unrefined mineral exports in Malawi compel a high-CapEx Mineral Separation Plant buildout near Lake Chilwa, invalidating low-capital Heavy Mineral Concentrate export models.
3. Corporate governance audits reveal non-independent board control, a 29.1% cornerstone supplier interlock with Mota-Engil Group, and 25.25M performance rights tied exclusively to non-market, non-economic operational milestones.
Figure CHLWA MINERALS LTD (FORM 20-F) ASSET PROFILE, FINANCIAL RUNWAY & STRATEGIC BENCHMARKING
 Balance Sheet Contraction, Dilution Mechanics, and Capital Allocation
Chilwa Minerals Ltd. [ASX: CHW / NASDAQ: CHWM] operates as an exploration-stage critical minerals entity with zero commercial mining revenue. In the fiscal year ended June 30, 2026, the company generated A$85,364 in total income, comprising interest and A$11,181 in secondary third-party sample preparation fees at its Zalewa laboratory facility, down from A$125,991 in FY 2025 and A$202,811 in FY 2024.
Operating expenditures expanded 99.7% year-over-year in FY 2026 to A$6,966,967, up from A$3,489,086 in FY 2025 and A$2,017,420 in FY 2024. The cost profile was driven by:
* Non-cash share-based payments of A$2,850,673 (representing 40.9% of total operating overhead), an increase of 200.5% over FY 2025 (A$948,505) and FY 2024 (A$389,741), reflecting the accounting amortization of Class F performance rights.
* Compliance and regulatory costs rising 193.9% to A$1,568,832 (versus A$533,782 in FY 2025 and A$435,116 in FY 2024), driven by A$726,388 in non-deductible listing expenses associated with the U.S. Nasdaq dual-listing.
* Employee benefits expense of A$1,297,676 (versus A$915,366 in FY 2025 and A$755,300 in FY 2024).
* Direct exploration expenses not eligible for capitalization totaling A$151,370 (representing 2.1% of Malawian operating subsidiary spend; A$0 in FY 2024 and FY 2025).
Net operating loss before tax reached A$6,881,603 in FY 2026, expanding 104.6% from A$3,363,095 in FY 2025 and 279.2% from A$1,814,609 in FY 2024. Under IFRS 6, the company capitalized A$7,428,098 of Exploration and Evaluation (E&E) expenditures in FY 2026, bringing total capitalized E&E assets to A$26,026,776 (up from A$18,598,678 in FY 2025 and A$11,333,988 in FY 2024), with zero cumulative impairments. Under U.S. GAAP standards requiring the expensing of exploration costs, FY 2026 net loss would have exceeded A$14.3M. Unrecognized deferred tax assets accumulated to A$7,703,793 in Australian revenue tax losses (A$2.31M tax benefit at 30%) and MWK 9.86 billion in Malawian tax losses (~A$8.20M equivalent, A$2.47M tax benefit).
Table FY2024–FY2026 Financial Performance, Cash Burn, Working Capital and Capital Structure Analysis
At June 30, 2026, Chilwa recorded a working capital deficit of -A$976,874 (current assets of A$1,600,756 against current liabilities of A$2,577,630), narrowing from a deficit of -A$2,011,061 in FY 2025. Current liabilities included A$2.44M in trade payables, of which A$967,429 was due to operational contractor Mota-Engil Group for drilling invoices. Independent auditor BDO Audit Pty Ltd issued a Going Concern explanatory paragraph citing recurring losses and A$11,631,563 in combined operational and investing cash outflows.
Dilution accelerated across FY 2025 and FY 2026. Ordinary shares outstanding grew 45.8% from 67,200,001 in FY 2024 to 98,006,092 at June 30, 2026, driven by:
* Conversion of 10,000,000 Class A performance rights into ordinary shares on July 10, 2025, upon meeting the 3.0 Mt Total Heavy Mineral (THM) JORC Indicated Resource target (including 1,721,740 shares issued to CEO Cadell Buss).
* Placement of 3,933,334 shares at A$1.05 in August 2025, raising A$4.13M gross.
* Placements of 6,691,667 shares at A$1.20 in October 2025 and January 2026, raising A$8.03M gross (including 1,500,000 shares subscribed by Mota-Engil subsidiary Mota Gestão e Participações SGPS SA for A$1.80M).
* Exercise of 1,622,127 unlisted options.
On October 1–2, 2026, Chilwa closed its Nasdaq Capital Market IPO, issuing 625,000 American Depositary Shares (ADSs, representing 10 ordinary shares each) at US$5.60 per ADS, generating US$3.50M gross (~A$5.2M). On October 16, 2026, the underwriter partially exercised its over-allotment option for 56,834 ADSs (568,340 ordinary shares) at US$5.59 per ADS, raising US$317,702 gross (~A$475k). Net proceeds after underwriting discounts and expenses were ~US$2.6M (~A$3.9M), lifting total shares outstanding to 104,917,832.
The transaction created an equity overhang comprising:
* 25,250,000 unvested performance rights (zero exercise price): Class B (5.0M, Pre-Feasibility Study completion by June 30, 2027); Class C (5.0M, Feasibility Study completion by June 30, 2028); Class D (5.0M, formal Decision to Mine by June 30, 2028); Class E (3.25M, Mining Licence grant in Malawi by November 30, 2028); Class F (7.0M, JORC Indicated TREO Resource by November 30, 2027, split evenly between 35 Mt @ 1.0% TREO and 60 Mt @ 2.0% TREO).
* 877,873 unlisted options.
* 717,000 warrants (625,000 public and 92,000 underwriter) exercisable at US$5.60 per ADS through October 2, 2031, alongside 34,091 representative warrants exercisable at US$7.00 per ADS.
As of October 19, 2026, total available cash stood between A$6.2M and A$6.6M (incorporating ~A$2.4M existing cash, excluding A$30,000 restricted term deposits and US$0.4M trapped in Malawian operating subsidiaries, plus US$3.14M gross IPO proceeds). At the FY 2026 monthly cash burn rate of ~A$969,297 (A$293,907 operating plus A$675,390 investing), the survival runway is 6.4 to 6.8 months, depleting available reserves by late April or May 2027. Underwriter Maxim Group LLC imposed a restrictive covenant prohibiting additional equity issuances prior to April 2, 2027, without prior written consent, concentrating liquidity default exposure at the expiration of that lock-up window. Statutory tenement commitments across exploration licenses total A$912,518 (A$227,874 due within 12 months; A$684,644 due within 1 to 5 years). A transition to care and maintenance would lower cash burn to ~A$294k monthly, extending runway to 21–22 months, but would cause default under Malawian statutory exploration work programs.
Geological Footprint, Flowsheet Constraints, and Logistics Corridors
Chilwa holds an 881.0136 km² landholding across three Exploration Licences in southern Malawi surrounding Lake Chilwa, held via operating subsidiaries Chilwa Minerals Africa Limited and Phalombe Minerals Limited:
* EL0670/22R1 (418.2851 km²): Encircles the north, west, and south shores across Phalombe, Zomba, and Mulanje Districts. Granted September 27, 2022; expires July 17, 2028. Footprint reduced 50% from 865.86 km² under statutory relinquishment provisions.
* EL0671/22R1 (12.84 km²): Covers Chisi Island within Lake Chilwa. Granted September 26, 2022; expires July 17, 2028. Retained 100% of area due to falling below the 25 km² statutory surrender threshold.
* EL0835/25 (449.8885 km²): Granted July 18, 2025; expires July 17, 2030, in Mulanje, Phalombe, and Zomba Districts. Subject to 50% area relinquishments upon each of two allowable 3-year extensions.
Chilwa reports zero Mineral Resource Estimates or Mineral Reserves under SEC Regulation S-K Subpart 1300 and has completed no Preliminary Economic Assessment (PEA), Scoping Study, or Feasibility Study. Exploration drilling across the portfolio comprises over 6,700 meters of sonic drilling (>1,700 holes) and over 2,050 meters of diamond core drilling (>12 holes).
Table Exploration Target Inventory, Mineralization Characteristics and Metallurgical Assessment Across Key Deposit Areas
Metallurgical flowsheet design is governed by a September 2025 Phase 2 bulk testwork program on a 4.2-tonne composite (2,909 drill intervals) from Mposa. Ore is crushed to 80% passing 3mm at the Zalewa prep laboratory in Malawi, with 500g splits assayed via Heavy Liquid Separation (HLS) at LightDeepEarth in South Africa. Primary wet gravity concentration utilizes hydrocyclones for slimes removal (<45 µm) and spirals to generate a Heavy Mineral Concentrate (HMC) exceeding 88% VHM purity.
Downstream processing faces regulatory and radiological hurdles:
1. Malawian Processing Mandate: A Presidential Executive Order issued October 23, 2025 (effective October 21, 2025) strictly prohibits the export of raw, unrefined minerals, encompassing HMS and REE concentrates. Chilwa cannot export unseparated HMC to offshore toll refiners (an approach requiring A$15M to A$30M in capital), but must construct an on-site Mineral Separation Plant (MSP), elevating pre-production development capital to an estimated A$60M to A$120M+.
2. Radionuclide Separation: Monazite ((Ce,La,Nd,Th)PO₄) represents 2% to 3% of the non-magnetic heavy mineral fraction at Mposa, exhibiting 0.64% to 0.85% CeO₂ in non-magnetic tails and producing a concentrate grading >24% TREO. Monazite hosts Thorium (Th⁴⁺) and Uranium (U⁴⁺) substitutions. Under IMO and IAEA Class 7 radiological transport rules, shipments exceeding 500 ppm combined Th + U (or 10 Bq/g) face hazardous classifications and off-taker penalty rejections. Chilwa must insert a froth flotation circuit following electrostatic dry separation to isolate monazite from zircon (~66% ZrO₂), followed by hydrometallurgical cracking (concentrated H₂SO₄/NaOH digestion at 200°C–400°C) to recover rare earths and neutralize radioactive waste.
Logistics require trucking refined mineral products from the mine gate over the S131 gravel road and M3 tarred highway to the Liwonde Dry Port. Refined containers will transfer to the ~700 km Nacala Rail Corridor traversing Mozambique to the Nacala Deep Water Port for bulk ocean vessel loading, avoiding marine barging transshipments. Tenement EL0670/22R1 encircles Lake Chilwa, a designated UNESCO Biosphere Reserve and RAMSAR Wetland of International Importance, placing environmental permitting under the Malawi Environmental Protection Authority (MEPA) pursuant to the Environment Management Act, 2017. Baseline studies are conducted by ESS Africa. Large-scale mining licenses require a Resettlement Management Plan (RMP), environmental closure bank guarantees, and a Community Development Agreement (CDA) mandating an annual expenditure of ≥0.45% of gross commercial revenues.
HDIN Institutional Verdict
Chilwa Minerals exhibits fundamental governance frictions and capital allocation vulnerabilities. The board of directors lacks independent control, with three of five seats held by insiders: CEO Cadell Buss, Chairman Alexander Shaw (CEO of Luso Global Mining B.V.), and Manuel Mota (Chief Business Development Officer of Mota-Engil SGPS, S.A.). Luso Global Mining controls a 29.1% interest (30,555,432 shares as of October 16, 2026), while Mota-Engil operates as Chilwa's primary operational contractor under a Services Deed that channeled A$4,515,788 to the contractor in FY 2026 (following A$2,888,004 in FY 2025 and A$2,405,321 in FY 2024). Trade payables at fiscal year-end included A$967,429 owed to Mota-Engil, alongside an unrecovered prepayment balance of A$633,302 on a diamond drill rig purchased by Chilwa for Mota-Engil to operate under a 30% invoice credit mechanism. Mota-Engil Engenharia further leases storage facilities to Chilwa under a 10-year contract at A$7,200 annually.
Chilwa bypasses standard Nasdaq marketplace protections under Foreign Private Issuer exemptions (Rule 5615(a)(3)), operating without a standalone Compensation Committee, without a standalone Nominations Committee, without regular executive sessions for its two independent directors (José Martins and Graham Hewson), and with a non-compliant two-person Audit Committee under a one-year IPO phase-in concession. Chief Financial Officer Mark Laybourn serves on an outsourced basis via CFO Centre (WA) Pty Ltd at a daily rate of A$2,350. Internal control deficiencies identified by BDO Audit Pty Ltd—including inadequate IT general controls, absent formal accounting policies, and lacking review precision—remain unremediated.
Executive remuneration reinforces operational moral hazard. In FY 2026, total compensation to directors and officers rose 136.0% to A$3,582,797 (versus A$1,517,875 in FY 2025), comprising A$725,996 in cash, A$54,022 in superannuation, and A$2,802,779 in non-cash performance rights vesting charges. CEO Cadell Buss's base salary increased 14.3% to A$400,000 per annum, with total compensation reaching A$1,791,276 (A$1,321,004 in share-based charges). Chairman Alexander Shaw received A$882,219 (A$802,219 in rights), Manuel Mota A$641,665 (A$601,665 in rights), and José Martins A$178,371 (A$150,530 in rights).
Because all 25,250,000 outstanding performance rights (Classes B through F) rely on non-market operational triggers (PFS delivery, FS delivery, decision to mine, license issuance, resource size) without share price, market capitalization, or relative Total Shareholder Return (TSR) hurdles under IFRS 2 Note 18, management is financially incentivized to complete engineering studies regardless of underlying equity value creation.
Compounding these structural liabilities are Malawian sovereign encumbrances:
* Section 260 of the Mines and Minerals Act No. 25 of 2023 entitles the Malawian Government to a 10% free-carried, non-dilutable equity interest upon conversion to a large-scale mining license at zero cost.
* The Foreign Exchange Act (2025) requires 25% of all gross export proceeds to be mandatorily converted into Malawi Kwacha, exposing project revenues to local currency depreciation, while banning domestic pricing or settlement in foreign currencies without Reserve Bank of Malawi authorization.
* Operating inside a RAMSAR-listed wetland basin elevates environmental scrutiny and capital expenditure requirements.
With net post-IPO cash reserves of ~A$6.2M to A$6.6M facing a monthly depletion rate of ~A$969k, Chilwa’s cash runway will terminate in April/May 2027. Bound by underwriter restrictions that prevent equity placements before April 2, 2027, the company faces an unavoidable financing convergence where failure to obtain debt facilities, underwriter waivers, or strategic farm-in partners will force extreme dilution or corporate distress.
Presentation Download & Video Access:
* Presentation Download: Click the PDF download link under 'Related Topics' to access the full institutional presentation of this report.
* Video Link: Click this link to watch the HDIN analyst briefing on YouTube.
About HDIN Research:
HDIN Research is a premier global market intelligence and strategic advisory firm specializing in institutional-grade financial analysis, supply chain audits, and macroeconomic forecasting. Our dedicated sector analysts deliver actionable, data-driven insights tailored for private equity, hedge funds, and corporate strategy teams. Visit us at [http://www.hdinresearch.com](http://www.hdinresearch.com).
2026 AI Transparency Footer:
"This intelligence report was authored by HDIN Research analysts following a rigorous audit of official corporate filings. AI was utilized for massive-scale data synthesis and structural drafting, ensuring 100% inclusion of reported data points. All strategic insights, financial modeling, and final verdicts were verified by our editorial board to ensure professional accuracy and compliance with 2026 Google Search E-E-A-T standards."
1. Chilwa Minerals Ltd. faces a critical liquidity pinch point by May 2027 as its A$6.2M to A$6.6M post-IPO cash runway depletes at A$969k per month against a Maxim Group LLC equity lock-up covenant expiring April 2, 2027.
2. Presidential decrees prohibiting unrefined mineral exports in Malawi compel a high-CapEx Mineral Separation Plant buildout near Lake Chilwa, invalidating low-capital Heavy Mineral Concentrate export models.
3. Corporate governance audits reveal non-independent board control, a 29.1% cornerstone supplier interlock with Mota-Engil Group, and 25.25M performance rights tied exclusively to non-market, non-economic operational milestones.
Figure CHLWA MINERALS LTD (FORM 20-F) ASSET PROFILE, FINANCIAL RUNWAY & STRATEGIC BENCHMARKING
Balance Sheet Contraction, Dilution Mechanics, and Capital AllocationChilwa Minerals Ltd. [ASX: CHW / NASDAQ: CHWM] operates as an exploration-stage critical minerals entity with zero commercial mining revenue. In the fiscal year ended June 30, 2026, the company generated A$85,364 in total income, comprising interest and A$11,181 in secondary third-party sample preparation fees at its Zalewa laboratory facility, down from A$125,991 in FY 2025 and A$202,811 in FY 2024.
Operating expenditures expanded 99.7% year-over-year in FY 2026 to A$6,966,967, up from A$3,489,086 in FY 2025 and A$2,017,420 in FY 2024. The cost profile was driven by:
* Non-cash share-based payments of A$2,850,673 (representing 40.9% of total operating overhead), an increase of 200.5% over FY 2025 (A$948,505) and FY 2024 (A$389,741), reflecting the accounting amortization of Class F performance rights.
* Compliance and regulatory costs rising 193.9% to A$1,568,832 (versus A$533,782 in FY 2025 and A$435,116 in FY 2024), driven by A$726,388 in non-deductible listing expenses associated with the U.S. Nasdaq dual-listing.
* Employee benefits expense of A$1,297,676 (versus A$915,366 in FY 2025 and A$755,300 in FY 2024).
* Direct exploration expenses not eligible for capitalization totaling A$151,370 (representing 2.1% of Malawian operating subsidiary spend; A$0 in FY 2024 and FY 2025).
Net operating loss before tax reached A$6,881,603 in FY 2026, expanding 104.6% from A$3,363,095 in FY 2025 and 279.2% from A$1,814,609 in FY 2024. Under IFRS 6, the company capitalized A$7,428,098 of Exploration and Evaluation (E&E) expenditures in FY 2026, bringing total capitalized E&E assets to A$26,026,776 (up from A$18,598,678 in FY 2025 and A$11,333,988 in FY 2024), with zero cumulative impairments. Under U.S. GAAP standards requiring the expensing of exploration costs, FY 2026 net loss would have exceeded A$14.3M. Unrecognized deferred tax assets accumulated to A$7,703,793 in Australian revenue tax losses (A$2.31M tax benefit at 30%) and MWK 9.86 billion in Malawian tax losses (~A$8.20M equivalent, A$2.47M tax benefit).
Table FY2024–FY2026 Financial Performance, Cash Burn, Working Capital and Capital Structure Analysis
| Financial & Capital Parameter | FY 2024 (AUD) | FY 2025 (AUD) | FY 2026 (AUD) | Post-IPO Pro Forma (Oct 2026) |
| Revenue from Mining Operations | A$0 | A$0 | A$0 | A$0 |
| Total Operating Expenses | A$2,017,420 | A$3,489,086 | A$6,966,967 | — |
| Net Operating Loss | A$1,814,609 | A$3,363,095 | A$6,881,603 | — |
| Operating Cash Outflow | A$1,753,245 | A$2,049,217 | A$3,526,883 | — |
| Investing Cash Outflow (E&E / CapEx) | A$1,708,402 | A$8,379,056 | A$8,104,680 | — |
| Total Net Cash Burn (OpEx + CapEx) | A$3,461,647 | A$10,428,273 | A$11,631,563 | — |
| Monthly Cash Burn Rate | ~A$288,471 | ~A$869,023 | ~A$969,297 | ~A$969,297 |
| Cash & Cash Equivalents | A$4,151,472 | A$687,022 | A$1,072,093 | ~A
6.6M |
| Restricted Term Deposits | A$0 | A$0 | A$30,000 | A$30,000 |
| Working Capital (Deficit) | N/A | (A$2,011,061) | (A$976,874) | Positive (Temporary) |
| Capitalized E&E Assets | A$11,333,988 | A$18,598,678 | A$26,026,776 | A$26,026,776 |
| Total Debt / Borrowings | A$43,304 | A$0 | A$0 | A$0 |
| Total Equity / Net Assets | A$13,131,278 | A$17,711,627 | A$25,983,040 | ~A$29.9M |
| Ordinary Shares Outstanding | 67,200,001 | 75,765,468 | 98,006,092 | 104,917,832 |
| Performance Rights Outstanding | 25,000,000 | 28,750,000 | 25,250,000 | 25,250,000 |
| Unlisted Options Outstanding | 3,000,000 | 2,500,000 | 877,873 | 877,873 |
At June 30, 2026, Chilwa recorded a working capital deficit of -A$976,874 (current assets of A$1,600,756 against current liabilities of A$2,577,630), narrowing from a deficit of -A$2,011,061 in FY 2025. Current liabilities included A$2.44M in trade payables, of which A$967,429 was due to operational contractor Mota-Engil Group for drilling invoices. Independent auditor BDO Audit Pty Ltd issued a Going Concern explanatory paragraph citing recurring losses and A$11,631,563 in combined operational and investing cash outflows.
Dilution accelerated across FY 2025 and FY 2026. Ordinary shares outstanding grew 45.8% from 67,200,001 in FY 2024 to 98,006,092 at June 30, 2026, driven by:
* Conversion of 10,000,000 Class A performance rights into ordinary shares on July 10, 2025, upon meeting the 3.0 Mt Total Heavy Mineral (THM) JORC Indicated Resource target (including 1,721,740 shares issued to CEO Cadell Buss).
* Placement of 3,933,334 shares at A$1.05 in August 2025, raising A$4.13M gross.
* Placements of 6,691,667 shares at A$1.20 in October 2025 and January 2026, raising A$8.03M gross (including 1,500,000 shares subscribed by Mota-Engil subsidiary Mota Gestão e Participações SGPS SA for A$1.80M).
* Exercise of 1,622,127 unlisted options.
On October 1–2, 2026, Chilwa closed its Nasdaq Capital Market IPO, issuing 625,000 American Depositary Shares (ADSs, representing 10 ordinary shares each) at US$5.60 per ADS, generating US$3.50M gross (~A$5.2M). On October 16, 2026, the underwriter partially exercised its over-allotment option for 56,834 ADSs (568,340 ordinary shares) at US$5.59 per ADS, raising US$317,702 gross (~A$475k). Net proceeds after underwriting discounts and expenses were ~US$2.6M (~A$3.9M), lifting total shares outstanding to 104,917,832.
The transaction created an equity overhang comprising:
* 25,250,000 unvested performance rights (zero exercise price): Class B (5.0M, Pre-Feasibility Study completion by June 30, 2027); Class C (5.0M, Feasibility Study completion by June 30, 2028); Class D (5.0M, formal Decision to Mine by June 30, 2028); Class E (3.25M, Mining Licence grant in Malawi by November 30, 2028); Class F (7.0M, JORC Indicated TREO Resource by November 30, 2027, split evenly between 35 Mt @ 1.0% TREO and 60 Mt @ 2.0% TREO).
* 877,873 unlisted options.
* 717,000 warrants (625,000 public and 92,000 underwriter) exercisable at US$5.60 per ADS through October 2, 2031, alongside 34,091 representative warrants exercisable at US$7.00 per ADS.
As of October 19, 2026, total available cash stood between A$6.2M and A$6.6M (incorporating ~A$2.4M existing cash, excluding A$30,000 restricted term deposits and US$0.4M trapped in Malawian operating subsidiaries, plus US$3.14M gross IPO proceeds). At the FY 2026 monthly cash burn rate of ~A$969,297 (A$293,907 operating plus A$675,390 investing), the survival runway is 6.4 to 6.8 months, depleting available reserves by late April or May 2027. Underwriter Maxim Group LLC imposed a restrictive covenant prohibiting additional equity issuances prior to April 2, 2027, without prior written consent, concentrating liquidity default exposure at the expiration of that lock-up window. Statutory tenement commitments across exploration licenses total A$912,518 (A$227,874 due within 12 months; A$684,644 due within 1 to 5 years). A transition to care and maintenance would lower cash burn to ~A$294k monthly, extending runway to 21–22 months, but would cause default under Malawian statutory exploration work programs.
Geological Footprint, Flowsheet Constraints, and Logistics Corridors
Chilwa holds an 881.0136 km² landholding across three Exploration Licences in southern Malawi surrounding Lake Chilwa, held via operating subsidiaries Chilwa Minerals Africa Limited and Phalombe Minerals Limited:
* EL0670/22R1 (418.2851 km²): Encircles the north, west, and south shores across Phalombe, Zomba, and Mulanje Districts. Granted September 27, 2022; expires July 17, 2028. Footprint reduced 50% from 865.86 km² under statutory relinquishment provisions.
* EL0671/22R1 (12.84 km²): Covers Chisi Island within Lake Chilwa. Granted September 26, 2022; expires July 17, 2028. Retained 100% of area due to falling below the 25 km² statutory surrender threshold.
* EL0835/25 (449.8885 km²): Granted July 18, 2025; expires July 17, 2030, in Mulanje, Phalombe, and Zomba Districts. Subject to 50% area relinquishments upon each of two allowable 3-year extensions.
Chilwa reports zero Mineral Resource Estimates or Mineral Reserves under SEC Regulation S-K Subpart 1300 and has completed no Preliminary Economic Assessment (PEA), Scoping Study, or Feasibility Study. Exploration drilling across the portfolio comprises over 6,700 meters of sonic drilling (>1,700 holes) and over 2,050 meters of diamond core drilling (>12 holes).
Table Exploration Target Inventory, Mineralization Characteristics and Metallurgical Assessment Across Key Deposit Areas
| Target / Deposit Area | Exploration Status & Drilling Density | Lithological Horizon | Heavy Mineral & Critical Element Grades | Valuable Heavy Mineral (VHM) Assemblage | Metallurgical & Deleterious Profile |
| Mposa Deposit (West Shore) | ~300 sonic holes (5–9m); 6 diamond holes (1,008.3m, depths 104–221m: MPODD001–006) | Sand Unit (Surface to 9m) | 8.8% THM; 89.5% VHM fraction | 76.0% Ilmenite, 9.5% Zircon, 1.4% Rutile, 2.5% Garnet | 50%–51% TiO₂ ilmenite (93% recovery via WHIMS); 55%–60% ZrO₂ zircon (upgradable to ~66%); 57% garnet (72% recovery) |
| Mposa Deposit (West Shore) | Sonic composite profiling | Silty Sand Unit | 3.8% THM; 88.0% VHM fraction | 75.0% Ilmenite, 8.9% Zircon, 2.3% Rutile, 1.6% Garnet | Magnetic separation yields low-impurity ilmenite; non-magnetic requires flotation |
| Mposa Deposit (West Shore) | Diamond core assaying | Saprolite / Clay (Sub-surface to 11m) | ~1.0% THM; 60% non-valuable slimes (<45 µm) | 43.0% Ilmenite, 6.6% Zircon, 3.8% Rutile, 4.0% Garnet | Up to 1,039 ppm TREO; high pyroxene, goethite, and feldspar contaminants |
| Mpyupyu Target (South-East) | 1,398 sonic holes (6,174m, avg depth 4.42m); Phase 1 grid 60 sonic holes (551m); 6 diamond holes (>1,050m, depths to 385m: MPYDD001–016B) | 11m free-dig saprolite over intrusive carbonatite | Discovery Hole MPYDD006: 0.31% Nb₂O₅ and 1,661 ppm TREO over 126.1m (incl. 0.38% Nb₂O₅ and 1,654 ppm TREO over 62m; 0.45% Nb₂O₅ over 10m; 0.57% Nb₂O₅ over 1.55m) | QEMSCAN confirmed monazite + unseparated HMS assemblage | Radiometric anomalies MPYTH004 and MPYTH005 indicate thorium lattice substitution; requires chemical cracking |
| Bimbi Prospect | 284 sonic holes (BIMSD005–279, depths 5–13m) | Lacustrine soft sands | Heavy mineral sands with unquantified REE pathfinders | Alluvial HMS | Slimes desliming required |
| Halala Prospect | 19 sonic holes (HALSD019–042, depths 7–20m; 64 historical holes) | Coastal sand dune | Dune sand HMS | Unseparated | High-dune dry mining |
| Namasalima Prospect | 47 sonic holes (depths 4–10m) | Alluvial plain sands | Heavy mineral sands with REE pathfinders | Alluvial HMS | Exploration stage |
| Regional Targets | 40 historical holes at Namanja; 47 aeromagnetic anomalies | Dunes, carbonatite, ionic clay | Nkotamo, Beacon, Namanja West, Chisi Island (carbonatite) | Multi-commodity | Exploration stage |
Metallurgical flowsheet design is governed by a September 2025 Phase 2 bulk testwork program on a 4.2-tonne composite (2,909 drill intervals) from Mposa. Ore is crushed to 80% passing 3mm at the Zalewa prep laboratory in Malawi, with 500g splits assayed via Heavy Liquid Separation (HLS) at LightDeepEarth in South Africa. Primary wet gravity concentration utilizes hydrocyclones for slimes removal (<45 µm) and spirals to generate a Heavy Mineral Concentrate (HMC) exceeding 88% VHM purity.
Downstream processing faces regulatory and radiological hurdles:
1. Malawian Processing Mandate: A Presidential Executive Order issued October 23, 2025 (effective October 21, 2025) strictly prohibits the export of raw, unrefined minerals, encompassing HMS and REE concentrates. Chilwa cannot export unseparated HMC to offshore toll refiners (an approach requiring A$15M to A$30M in capital), but must construct an on-site Mineral Separation Plant (MSP), elevating pre-production development capital to an estimated A$60M to A$120M+.
2. Radionuclide Separation: Monazite ((Ce,La,Nd,Th)PO₄) represents 2% to 3% of the non-magnetic heavy mineral fraction at Mposa, exhibiting 0.64% to 0.85% CeO₂ in non-magnetic tails and producing a concentrate grading >24% TREO. Monazite hosts Thorium (Th⁴⁺) and Uranium (U⁴⁺) substitutions. Under IMO and IAEA Class 7 radiological transport rules, shipments exceeding 500 ppm combined Th + U (or 10 Bq/g) face hazardous classifications and off-taker penalty rejections. Chilwa must insert a froth flotation circuit following electrostatic dry separation to isolate monazite from zircon (~66% ZrO₂), followed by hydrometallurgical cracking (concentrated H₂SO₄/NaOH digestion at 200°C–400°C) to recover rare earths and neutralize radioactive waste.
Logistics require trucking refined mineral products from the mine gate over the S131 gravel road and M3 tarred highway to the Liwonde Dry Port. Refined containers will transfer to the ~700 km Nacala Rail Corridor traversing Mozambique to the Nacala Deep Water Port for bulk ocean vessel loading, avoiding marine barging transshipments. Tenement EL0670/22R1 encircles Lake Chilwa, a designated UNESCO Biosphere Reserve and RAMSAR Wetland of International Importance, placing environmental permitting under the Malawi Environmental Protection Authority (MEPA) pursuant to the Environment Management Act, 2017. Baseline studies are conducted by ESS Africa. Large-scale mining licenses require a Resettlement Management Plan (RMP), environmental closure bank guarantees, and a Community Development Agreement (CDA) mandating an annual expenditure of ≥0.45% of gross commercial revenues.
HDIN Institutional Verdict
Chilwa Minerals exhibits fundamental governance frictions and capital allocation vulnerabilities. The board of directors lacks independent control, with three of five seats held by insiders: CEO Cadell Buss, Chairman Alexander Shaw (CEO of Luso Global Mining B.V.), and Manuel Mota (Chief Business Development Officer of Mota-Engil SGPS, S.A.). Luso Global Mining controls a 29.1% interest (30,555,432 shares as of October 16, 2026), while Mota-Engil operates as Chilwa's primary operational contractor under a Services Deed that channeled A$4,515,788 to the contractor in FY 2026 (following A$2,888,004 in FY 2025 and A$2,405,321 in FY 2024). Trade payables at fiscal year-end included A$967,429 owed to Mota-Engil, alongside an unrecovered prepayment balance of A$633,302 on a diamond drill rig purchased by Chilwa for Mota-Engil to operate under a 30% invoice credit mechanism. Mota-Engil Engenharia further leases storage facilities to Chilwa under a 10-year contract at A$7,200 annually.
Chilwa bypasses standard Nasdaq marketplace protections under Foreign Private Issuer exemptions (Rule 5615(a)(3)), operating without a standalone Compensation Committee, without a standalone Nominations Committee, without regular executive sessions for its two independent directors (José Martins and Graham Hewson), and with a non-compliant two-person Audit Committee under a one-year IPO phase-in concession. Chief Financial Officer Mark Laybourn serves on an outsourced basis via CFO Centre (WA) Pty Ltd at a daily rate of A$2,350. Internal control deficiencies identified by BDO Audit Pty Ltd—including inadequate IT general controls, absent formal accounting policies, and lacking review precision—remain unremediated.
Executive remuneration reinforces operational moral hazard. In FY 2026, total compensation to directors and officers rose 136.0% to A$3,582,797 (versus A$1,517,875 in FY 2025), comprising A$725,996 in cash, A$54,022 in superannuation, and A$2,802,779 in non-cash performance rights vesting charges. CEO Cadell Buss's base salary increased 14.3% to A$400,000 per annum, with total compensation reaching A$1,791,276 (A$1,321,004 in share-based charges). Chairman Alexander Shaw received A$882,219 (A$802,219 in rights), Manuel Mota A$641,665 (A$601,665 in rights), and José Martins A$178,371 (A$150,530 in rights).
Because all 25,250,000 outstanding performance rights (Classes B through F) rely on non-market operational triggers (PFS delivery, FS delivery, decision to mine, license issuance, resource size) without share price, market capitalization, or relative Total Shareholder Return (TSR) hurdles under IFRS 2 Note 18, management is financially incentivized to complete engineering studies regardless of underlying equity value creation.
Compounding these structural liabilities are Malawian sovereign encumbrances:
* Section 260 of the Mines and Minerals Act No. 25 of 2023 entitles the Malawian Government to a 10% free-carried, non-dilutable equity interest upon conversion to a large-scale mining license at zero cost.
* The Foreign Exchange Act (2025) requires 25% of all gross export proceeds to be mandatorily converted into Malawi Kwacha, exposing project revenues to local currency depreciation, while banning domestic pricing or settlement in foreign currencies without Reserve Bank of Malawi authorization.
* Operating inside a RAMSAR-listed wetland basin elevates environmental scrutiny and capital expenditure requirements.
With net post-IPO cash reserves of ~A$6.2M to A$6.6M facing a monthly depletion rate of ~A$969k, Chilwa’s cash runway will terminate in April/May 2027. Bound by underwriter restrictions that prevent equity placements before April 2, 2027, the company faces an unavoidable financing convergence where failure to obtain debt facilities, underwriter waivers, or strategic farm-in partners will force extreme dilution or corporate distress.
Presentation Download & Video Access:
* Presentation Download: Click the PDF download link under 'Related Topics' to access the full institutional presentation of this report.
* Video Link: Click this link to watch the HDIN analyst briefing on YouTube.
About HDIN Research:
HDIN Research is a premier global market intelligence and strategic advisory firm specializing in institutional-grade financial analysis, supply chain audits, and macroeconomic forecasting. Our dedicated sector analysts deliver actionable, data-driven insights tailored for private equity, hedge funds, and corporate strategy teams. Visit us at [http://www.hdinresearch.com](http://www.hdinresearch.com).
2026 AI Transparency Footer:
"This intelligence report was authored by HDIN Research analysts following a rigorous audit of official corporate filings. AI was utilized for massive-scale data synthesis and structural drafting, ensuring 100% inclusion of reported data points. All strategic insights, financial modeling, and final verdicts were verified by our editorial board to ensure professional accuracy and compliance with 2026 Google Search E-E-A-T standards."