GMEX Robotics Corporation: AI Pivot and Solana Treasury Near Bankstown Aerodrome Facility as 91.4% Cost of Sales Signals Severe Margin Collapse
Date : 2026-11-11
Reading : 175
HDIN Executive Takeaways
1. GMEX Robotics Corporation posted a FY2026 net loss of $17,275,818 on $5,609,615 in merchandise sales, impaired by $5,793,239 in digital asset losses and an operating cash drain of $8,544,595.
2. Core retail distribution operates from Bankstown Aerodrome, Australia, with 70% manufacturing exposure to mainland China, while its AUD $4.2 million culinary robotics backlog and Singapore AI acquisition generated zero FY2026 revenue.
3. Noteholders encumbered 100% of the $36,611,405 digital asset treasury under variable death-spiral conversion formulas, as cumulative reverse splits exceeded 1-for-9,000, triggering going-concern and delisting warnings.
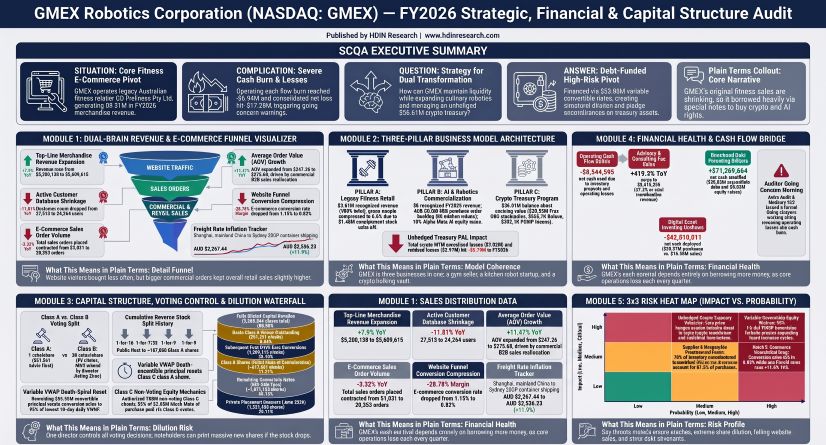
Figure GMEX Robotics Corporation-FY2026 Strategic, Financial & Capital Structure Audit
 Segmental Realities, Margin Compression and Capital Destruction
GMEX Robotics Corporation [NASDAQ: GMEX] (formerly Fitell Corporation until March 2, 2026), redomiciled from the Cayman Islands to the British Virgin Islands on January 7, 2026, closed FY2026 (ended June 30, 2026) with consolidated merchandise revenue of $5,609,615, representing a 7.87% expansion (+ $409,477) from $5,200,138 in FY2025. Despite management's strategic reorganization into AI-driven culinary robotics and digital asset treasury operations, 100.0% of recognized top-line revenue originated from the legacy fitness equipment e-commerce subsidiary, GD Wellness Pty Ltd. Zero revenue was recognized from intelligent robotics platforms, boutique gym licensing, or software applications.
Cost of goods sold escalated by 62.41% YoY from $3,157,996 (60.73% of revenue) to $5,129,025 (91.43% of revenue), contracting gross profit by 76.47% from $2,042,142 to $480,590. This margin collapse—a compression of 3,075 basis points from 39.27% to 8.57%—was driven by a $1,658,866 consignment inventory write-off allowance. Excluding this inventory impairment, normalized gross margins tracked historical performance.
Operating expenses surged 106.68% YoY to $7,612,562, representing 135.71% of total revenue, up from $3,683,264 (70.83% of revenue) in FY2025. Operating loss widened 334.58% to $7,131,972 compared to $1,641,122 in FY2025. Operating overhead expansion was concentrated in third-party professional advisory fees:
* Consulting fees surged 419.21% YoY to $3,214,453 (57.30% of revenue), up from $619,108 in FY2025, driven by capital raising fees and treasury advisory expenses. This included $1,344,663 in share-based compensation issued to third-party consultants and $800,000 in financing transaction charges.
* General and administrative expenses increased 79.08% to $2,038,392 (36.34% of revenue), compared to $1,138,266 in FY2025, reflecting $600,000 in intellectual property and patent filing expenditures for robotics systems alongside expanded corporate operations.
* Personnel expenses rose 13.02% to $1,351,648 (24.09% of revenue) versus $1,195,958 in FY2025.
* Sales and marketing costs advanced 31.11% to $546,196 (9.74% of revenue) versus $416,596 in FY2025.
* Operating lease expenses reached $434,880 (7.75% of revenue), up 43.11% from $303,869.
* Depreciation climbed 173.66% to $25,907 (0.46% of revenue), and licensing expenses were $1,086.
Table Consolidated Statements of Operations and Year-over-Year Financial Performance, FY2025–FY2026 (USD)
Non-operating activities shifted from net income of $1,291,895 in FY2025 to a net charge of $10,143,846 in FY2026, driven by financial engineering and cryptocurrency mark-to-market depreciation:
* Unhedged digital asset adjustments generated a net drag of $5,793,239, comprising $2,819,151 in unrealized fair value losses and $2,974,088 in realized liquidation losses ($16,254,989 gross proceeds versus historical cost basis).
* Debt extinguishment losses totaled $4,818,933 following the May 27, 2026 debt exchange of Series C convertible notes for Series D convertible notes.
* Net fair value gains on convertible notes evaluated under the ASC 825 Fair Value Option reached $3,681,139 due to declining underlying equity prices.
* Losses on derivative and common stock issuances totaled $1,510,307.
* Derivative warrant liability fair value gains dropped to $66,754 (down from $2,024,942 in FY2025).
* Staking rewards on Solana generated $94,633 in revenue.
* Net interest expense totaled $1,032,736 (interest expense of $1,204,645, dominated by $1,084,734 in convertible note coupon interest, offset by $171,909 in interest income).
Table DuPont Analysis of Financial Performance and Return on Equity (ROE), FY2025–FY2026
Balance sheet assets totaled $71,461,000, supported by cash of $14,919,028 (up from $2,890,822 in FY2025), $36,611,405 in digital assets, and $7,930,000 in corporate fund investments. Total current assets finished at $28,836,101 against current liabilities of $2,836,392 (comprising $2,004,224 in accounts payable and accrued expenses), yielding a current ratio of 10.17x.
Table Working Capital Position and Operating Cash Conversion Cycle Analysis, FY2025–FY2026
Cash flow analysis reveals deep structural deficits. Cash used in operating activities reached -$8,544,595 in FY2026, an 740.68% increase in operational burn from -$1,016,390 in FY2025. Non-cash charges—including $4,818,933 in debt extinguishment losses, $5,793,239 in aggregate digital asset losses, $1,658,866 in consignment write-offs, $1,510,307 in equity issuance charges, $1,344,663 in share-based consulting compensation, and $434,880 in ROU asset amortization—were offset by $3,681,139 in convertible note fair value gains and a $3,540,739 operating working capital cash drain driven by $3.43 million in prepayments and supplier deposit advances.
Investing activities consumed $50,598,439 in net cash:
* Gross purchases of digital assets consumed $58,565,000, offset by $16,254,989 in liquidation proceeds, generating a net digital treasury cash drain of $42,310,011.
* Fund investments absorbed $7,969,910.
* Physical property and equipment capital expenditures totaled $315,294 (dedicated to the Bankstown warehouse facility), alongside $3,224 in other investments.
Financing activities provided $71,269,664 in net cash inflows:
* Gross funds raised via convertible notes: $63,945,000.
* Inflows from new Class A share issuances (ATM facility and direct equity offerings): $8,042,737.
* Net financing liabilities added $329,985; related-party working capital advances added $5,547.
* Outflows included $1,038,027 in declared and paid dividends and $15,578 in share/warrant repurchases.
* Foreign currency translation adjustments generated a negative variance of $98,424, closing net cash additions at $12,028,206 and lifting period-end cash balances to $14,919,028.
Operational Footprint and Cross-Border Supply Vulnerabilities
GMEX Robotics Corporation’s operational core is located at 5 Starkie Drive, Bankstown Aerodrome, NSW 2198, Australia. Commencing May 19, 2026, the company entered into a 5-year lease for a 30,000+ square foot logistics, showroom, and corporate administrative facility maturing May 2031. Terms mandate an initial base rent of AUD $62,831 per month plus GST, escalating at a fixed 3.5% per annum, replacing its former operating warehouse at Taren Point, New South Wales.
The operational workforce in Australia comprises 18 full-time personnel across five core operational divisions: Management (4), Sales & Marketing (6), Central Fulfillment & Warehouse Logistics (5), Procurement & Supply Chain (2), and 2D/3D Industrial Design (1).
Long-lived operating assets are geographically segregated across two primary jurisdictions: Australia accounts for $6,009,112 in operating property, leases, and inventory assets, while $36,611,405 is deployed in the United States, representing BitGo custodian digital treasury assets pledged as collateral.
Merchandise procurement relies heavily on international cross-border manufacturing. In FY2026, 72.0% of total goods were sourced internationally: 70.0% manufactured in mainland China and 2.0% in Vietnam. The remaining 28.0% was sourced through domestic Australian distributors. GMEX maintains zero long-term volume supply commitments, operating on a made-to-order purchase order basis. Its procurement base exhibits severe supplier concentration, with the top 4 manufacturing partners accounting for 57.4% of total inventory purchases, and the top 5 accounting for 69.8%.
Table Major Supplier Relationships and Procurement Concentration Analysis
International sea freight logistics between East Asia and Australasia faced severe inflationary pressure. Ocean freight for a standard 20-foot general purpose (20GP) container transit corridor from Shanghai, mainland China to Sydney, Australia increased 11.85% YoY, rising from AUD $2,267.44 in mid-2025 to AUD $2,536.23 in early 2026. Maritime lead times averaged 3 to 4 weeks, compelling management to elevate Minimum Order Quantities (MOQs) and utilize third-party logistics (3PL) satellite overflow warehouses. Domestic order fulfillment from Bankstown averages 1 to 2 business days within the Sydney metropolitan area, 2 to 3 days for interstate capitals, and approximately 5 business days for regional and remote zones.
Merchandise distribution is executed via GymDirect.com.au (63.54% of sales / $3,564,349) alongside showroom, phone orders, and marketplace concessions including Bunnings Marketplace and eBay (36.46% of sales / $2,045,266). Over 81.0% of revenues were generated by four proprietary brands: Muscle Motion (power racks, benches, weights), Rapid Motion (commercial strength), FleetX (rowers, bikes, treadmills), and Harison. Third-party brand resale accounted for less than 19.0%.
Operational divergence centers on price/mix expansion versus retail volume decay: while retail consumer orders softened amid Australian interest rate pressures (pulling total transactions down 3.22% to 20,353), top-line merchandise revenue grew 7.87% due to an 11.47% rise in Average Order Value ($275.62), driven by commercial accounts comprising 33.26% ($1,865,758) of revenues.
Pillar 2 robotics commercialization efforts produced zero recognized revenue in FY2026. The pipeline includes an AUD $4.2 million purchase order signed in March 2026 with Australian food service operator FBG for 50 2Fculinary AI cooking robots (Bon Vivant 3.0 and Max models) across airport and event venues. Internal R&D remains minimal; engineering is outsourced to Shenzhen contractors, open-source model frameworks, and APIs. Smart connected fitness hardware (1FinalRound app and fitness mirrors) remains in development. Turnkey licensing (mySTEPS Training Clinic) licensed 6 centers in Eastern China to Js & Je Company Limited ($125,000 base fee plus $40,000 per location annually), but yielded $0 in recognized FY2026 revenue.
M&A execution centered on a Share Purchase Agreement signed July 28, 2026, and amended October 14, 2026, to acquire a 15% equity stake in Alpha Meta AI Pte. Ltd. (Singapore) and principal shareholder MetaGen AI Limited (British Virgin Islands) based on an unverified reference valuation of $8,400,000. Total consideration was set at $2,520,000, payable 15% in cash ($378,000) and 85% in newly created non-voting Class C Ordinary Shares ($2,142,000 value), with a 24-month option to acquire control. Concurrently, GMEX secured a perpetual, worldwide, royalty-free exclusive license to commercialize MetaGen's MediaMeta social-intelligence AI platform and robotics software. The filing includes zero audited financial records, historical revenues, or balance sheets for the target entities, and no independent third-party fairness opinion was obtained.
Pillar 3 crypto treasury operations accumulated 252,243,164 tokens with an aggregate cost basis of $39,430,556, recorded on the balance sheet at a fair market value of $36,611,405 under ASC 350 / ASU 2023-08. Assets are custodied with BitGo Trust Company, Inc. in cold-storage multi-signature wallets.
Table Digital Asset Treasury Portfolio Composition, Cost Basis, and Fair Value Assessment, FY2026
Management maintains an explicit non-hedging policy, exposing the balance sheet to digital asset downturns. Although staking Solana generated $94,633 in rewards, protocol unbonding lockup periods restrict asset mobility. 100% of digital assets are encumbered as debt collateral: BitGo Wallet 1 ($1,230,805 in SOL/PUMP) secures Series A notes, and BitGo Wallet 2 ($35,380,600 in Frax USD) secures Series D notes. Digital assets exceed 51.2% of consolidated balance sheet assets ($36.61M of $71.46M), exposing the company to statutory reclassification as an Investment Company under Section 3(a)(1)(C) of the U.S. Investment Company Act of 1940.
Institutional Verdict and Forensic Governance Audit
GMEX Robotics Corporation’s strategic pivot presents an asymmetry between management's operational claims and underlying financial realities. While public filings emphasize an institutional transition toward culinary robotics and digital asset accumulation, 100.0% of current commercial revenue remains tied to an Australian fitness distribution platform contending with margin compression and supply chain exposure across mainland China.
The company's capital management strategy relies heavily on complex structured debt. In FY2026, GMEX raised $63,945,000 in gross proceeds through variable convertible debt packages containing floating conversion price formulas benchmarked to 95% of the lowest daily Volume Weighted Average Price (VWAP) across a 10-day lookback period.
These conversion formulas generate dynamic dilution: declines in market share price increase the number of Class A shares required to satisfy conversions. Noteholders converted $22,585,000 of principal into 86,207 pre-split shares during FY2026, and an additional $6,181,074 into 1,209,172 Class A shares post-fiscal year-end. Default clauses—including a Volume Deficiency Event triggered by depressed trading on three days within any ten-day window—empower noteholders to accelerate redemptions at 125% of par value, enforce an 18% default interest rate, or liquidate encumbered BitGo custody collateral. Late delivery of conversion shares incurs a daily cash liquidated damages penalty of 2.0%.
Convertible debt was evaluated under ASC 815 and recorded at fair value under the ASC 825 Fair Value Option using a Level 3 Monte Carlo Simulation (stock volatility inputs of 82.71% to 100.68%, discount rates of 17.28% to 17.39%). Debt carrying value stood at $38,098,883 at year-end, against an aggregate principal face value of $59,743,606.
Governance structures decouple voting control from economic interest. GMEX created a tri-class share capital base comprising Class A (1 vote per share, public float), Class B (30 votes per share, super-voting), and Class C (0 votes, non-voting, convertible). On December 17, 2025, the company repurchased 89 Class A shares from SKMA Capital and Investment Ltd. and issued 89 Class B super-voting shares in exchange. SKMA is 100% owned by Executive Director Jieting Zhao. As a result, Director Zhao commands 100.0% of the Class B voting stock, securing effective voting control over corporate transactions, board appointments, and charter amendments despite holding an economic equity stake of approximately 0.02%.
The executive team and board lack in-house technical credentials, patents, or operating backgrounds in artificial intelligence, robotics engineering, or hardware manufacturing. Related-party transactions include $22,139 in unsecured, interest-free working capital debt provided by Ansa Group Limited (an entity affiliated with Director Zhao) to GD Wellness Pty Ltd.
To avoid delisting under Nasdaq Listing Rule 5550(a)(2) ($1.00 minimum bid price), GMEX completed four reverse stock splits across FY2025 and FY2026, including a 1-for-16 consolidation on September 23, 2025; a 1-for-7 (Class A) / 1-for-28 (Class B) split on May 1, 2026; a 1-for-9 split on July 2, 2026; and a 1-for-9 split on September 28, 2026. The par value was reset to $0.000001 per share on September 28, 2026, while authorized share capital was expanded to 1,407,000,000 shares.
The cumulative reverse split ratio exceeds 1-for-9,000 over 14 months, reducing the basic public float to approximately 107,000 Class A shares held by non-affiliates (~29.6% of outstanding Class A shares at year-end). Under Nasdaq Rule 5810(c)(3)(A)(iv), excessive cumulative consolidations (>1-for-250 over a rolling 2-year window) limit regulatory grace periods for future bid deficiencies. GMEX also relies on Foreign Private Issuer exemptions under Nasdaq Rule 5615(a)(3) to bypass requirements for annual shareholder meetings, proxy statements, and non-proportional voting rights prohibitions.
The active issued share count of 1,570,622 shares represents less than 30% of the fully diluted capital base (5,280,807 shares). Note conversions, warrant overhang, and Class C shares represent substantial latent dilution.
Independent auditor Astra Audit & Advisory LLC (Tampa, FL; PCAOB Firm ID #6920; FY2026 audit fees of $155,750, up 57.72% YoY) issued an unqualified audit opinion with an explanatory paragraph regarding Going Concern uncertainty. Operating net losses of $7,131,972 and operating cash outflows of $8,544,595 raise substantial doubt about the company's ability to continue as a going concern without ongoing external capital. Management evaluated disclosure controls and internal controls over financial reporting (ICFR) under the COSO (2013) framework as ineffective as of June 30, 2026, citing material weaknesses in accounting and disclosure controls for complex fair-value convertible debt instruments (ASC 825) and embedded warrant liabilities. As an Emerging Growth Company under the JOBS Act, the company remains exempt from independent auditor ICFR attestation under Section 404(b) of the Sarbanes-Oxley Act.
Tax positions across the corporate tree show a 0.0% effective tax rate in FY2026 (income tax expense of $0 on a pre-tax loss of $17,275,818, versus tax expense of $333,497 and a 95.5% ETR in FY2025). The British Virgin Islands parent remains tax-exempt. Operating entities in Australia face a 25.0% statutory corporate rate. The $4,318,955 statutory tax benefit was offset by non-deductible items (debt extinguishment loss of $1,204,733, non-deductible consulting fees of $803,613, crypto losses of $1,448,310, and inventory adjustments of $414,717), with the remaining $177,589 offset by an increased valuation allowance against gross deferred tax assets of $566,558 (comprising $514,166 in Australian operating tax loss carryforwards, $50,244 in employee benefit accruals, and $2,148 in unrealized FX losses), leaving net recognized deferred tax assets at $0.00. The company recorded zero uncertain tax positions under ASC 740-10 (FIN 48).
GMEX Robotics Corporation's multi-class voting structure, variable-rate debt architecture, and pledged digital treasury create substantial structural exposure for public common equity holders.
Presentation Download & Video Access:
* Presentation Download: Click the PDF download link under 'Related Topics' to access the full institutional presentation of this report.
* Video Link: Click this link to watch the HDIN analyst briefing on YouTube.
About HDIN Research:
HDIN Research is a premier global market intelligence and strategic advisory firm specializing in institutional-grade financial analysis, supply chain audits, and macroeconomic forecasting. Our dedicated sector analysts deliver actionable, data-driven insights tailored for private equity, hedge funds, and corporate strategy teams. Visit us at http://www.hdinresearch.com.
2026 AI Transparency Footer:
"This intelligence report was authored by HDIN Research analysts following a rigorous audit of official corporate filings. AI was utilized for massive-scale data synthesis and structural drafting, ensuring 100% inclusion of reported data points. All strategic insights, financial modeling, and final verdicts were verified by our editorial board to ensure professional accuracy and compliance with 2026 Google Search E-E-A-T standards."
1. GMEX Robotics Corporation posted a FY2026 net loss of $17,275,818 on $5,609,615 in merchandise sales, impaired by $5,793,239 in digital asset losses and an operating cash drain of $8,544,595.
2. Core retail distribution operates from Bankstown Aerodrome, Australia, with 70% manufacturing exposure to mainland China, while its AUD $4.2 million culinary robotics backlog and Singapore AI acquisition generated zero FY2026 revenue.
3. Noteholders encumbered 100% of the $36,611,405 digital asset treasury under variable death-spiral conversion formulas, as cumulative reverse splits exceeded 1-for-9,000, triggering going-concern and delisting warnings.
Figure GMEX Robotics Corporation-FY2026 Strategic, Financial & Capital Structure Audit
Segmental Realities, Margin Compression and Capital DestructionGMEX Robotics Corporation [NASDAQ: GMEX] (formerly Fitell Corporation until March 2, 2026), redomiciled from the Cayman Islands to the British Virgin Islands on January 7, 2026, closed FY2026 (ended June 30, 2026) with consolidated merchandise revenue of $5,609,615, representing a 7.87% expansion (+ $409,477) from $5,200,138 in FY2025. Despite management's strategic reorganization into AI-driven culinary robotics and digital asset treasury operations, 100.0% of recognized top-line revenue originated from the legacy fitness equipment e-commerce subsidiary, GD Wellness Pty Ltd. Zero revenue was recognized from intelligent robotics platforms, boutique gym licensing, or software applications.
Cost of goods sold escalated by 62.41% YoY from $3,157,996 (60.73% of revenue) to $5,129,025 (91.43% of revenue), contracting gross profit by 76.47% from $2,042,142 to $480,590. This margin collapse—a compression of 3,075 basis points from 39.27% to 8.57%—was driven by a $1,658,866 consignment inventory write-off allowance. Excluding this inventory impairment, normalized gross margins tracked historical performance.
Operating expenses surged 106.68% YoY to $7,612,562, representing 135.71% of total revenue, up from $3,683,264 (70.83% of revenue) in FY2025. Operating loss widened 334.58% to $7,131,972 compared to $1,641,122 in FY2025. Operating overhead expansion was concentrated in third-party professional advisory fees:
* Consulting fees surged 419.21% YoY to $3,214,453 (57.30% of revenue), up from $619,108 in FY2025, driven by capital raising fees and treasury advisory expenses. This included $1,344,663 in share-based compensation issued to third-party consultants and $800,000 in financing transaction charges.
* General and administrative expenses increased 79.08% to $2,038,392 (36.34% of revenue), compared to $1,138,266 in FY2025, reflecting $600,000 in intellectual property and patent filing expenditures for robotics systems alongside expanded corporate operations.
* Personnel expenses rose 13.02% to $1,351,648 (24.09% of revenue) versus $1,195,958 in FY2025.
* Sales and marketing costs advanced 31.11% to $546,196 (9.74% of revenue) versus $416,596 in FY2025.
* Operating lease expenses reached $434,880 (7.75% of revenue), up 43.11% from $303,869.
* Depreciation climbed 173.66% to $25,907 (0.46% of revenue), and licensing expenses were $1,086.
Table Consolidated Statements of Operations and Year-over-Year Financial Performance, FY2025–FY2026 (USD)
| Consolidated Statement of Operations Line Item | FY2026 (USD) | % of Revenue | FY2025 (USD) | % of Revenue | YoY Variance ($) | YoY Variance (%) |
| Total Merchandise Revenue | $5,609,615 | 100.00% | $5,200,138 | 100.00% | +$409,477 | +7.87% |
| Cost of Goods Sold | ($5,129,025) | -91.43% | ($3,157,996) | -60.73% | -$1,971,029 | +62.41% |
| Gross Profit | $480,590 | 8.57% | $2,042,142 | 39.27% | -$1,561,552 | -76.47% |
| Consulting Fees | $3,214,453 | 57.30% | $619,108 | 11.91% | +$2,595,345 | +419.21% |
| General & Administrative Expenses | $2,038,392 | 36.34% | $1,138,266 | 21.89% | +$900,126 | +79.08% |
| Personnel Expenses | $1,351,648 | 24.09% | $1,195,958 | 23.00% | +$155,690 | +13.02% |
| Sales & Marketing Expenses | $546,196 | 9.74% | $416,596 | 8.01% | +$129,600 | +31.11% |
| Operating Lease Expense | $434,880 | 7.75% | $303,869 | 5.84% | +$131,011 | +43.11% |
| Depreciation Expense | $25,907 | 0.46% | $9,467 | 0.18% | +$16,440 | +173.66% |
| Licensing Fees | $1,086 | 0.02% | $0 | 0.00% | +$1,086 | N/A |
| Total Operating Expenses | $7,612,562 | 135.71% | $3,683,264 | 70.83% | +$3,929,298 | +106.68% |
| Operating Loss | ($7,131,972) | -127.14% | ($1,641,122) | -31.56% | -$5,490,850 | +334.58% |
| Non-Operating Income / (Expense), Net | ($10,143,846) | -180.83% | +$1,291,895 | +24.84% | -$11,435,741 | -885.19% |
| Pre-Tax Loss | ($17,275,818) | -307.97% | ($349,227) | -6.72% | -$16,926,591 | +4846.87% |
| Income Tax Expense / (Credit) | $0 | 0.00% | $333,497 | 6.41% | -$333,497 | -100.00% |
| Consolidated Net Loss | ($17,275,818) | -307.97% | ($682,724) | -13.13% | -$16,593,094 | +2430.42% |
| Normalized Net Loss (excl. one-offs) | ($3,227,913) | -57.54% | ($1,253,887) | -24.11% | -$1,974,026 | +157.43% |
Non-operating activities shifted from net income of $1,291,895 in FY2025 to a net charge of $10,143,846 in FY2026, driven by financial engineering and cryptocurrency mark-to-market depreciation:
* Unhedged digital asset adjustments generated a net drag of $5,793,239, comprising $2,819,151 in unrealized fair value losses and $2,974,088 in realized liquidation losses ($16,254,989 gross proceeds versus historical cost basis).
* Debt extinguishment losses totaled $4,818,933 following the May 27, 2026 debt exchange of Series C convertible notes for Series D convertible notes.
* Net fair value gains on convertible notes evaluated under the ASC 825 Fair Value Option reached $3,681,139 due to declining underlying equity prices.
* Losses on derivative and common stock issuances totaled $1,510,307.
* Derivative warrant liability fair value gains dropped to $66,754 (down from $2,024,942 in FY2025).
* Staking rewards on Solana generated $94,633 in revenue.
* Net interest expense totaled $1,032,736 (interest expense of $1,204,645, dominated by $1,084,734 in convertible note coupon interest, offset by $171,909 in interest income).
Table DuPont Analysis of Financial Performance and Return on Equity (ROE), FY2025–FY2026
| DuPont Factor | FY2026 | FY2025 | Variance | Operational Driver |
| Net Profit Margin | -307.97% | -13.13% | -294.84% pts | Non-operating crypto MTM losses (-
4.82M), consulting fees ($3.21M). |
| Asset Turnover | 0.0785x | 0.4563x | -0.3778x | Asset base grew to
36.61M) and funds ($7.93M); revenue rose 7.87%. |
| Financial Leverage (Equity Multiplier) | 2.5005x | 1.2400x | +1.2605x | Structural expansion in balance sheet liabilities via $38.10M in convertible debt liabilities. |
| Return on Equity (ROE) | -60.45% | -7.43% | -53.02% pts | Compounded capital destruction driven by net loss surge outstripping debt-driven asset expansion. |
Balance sheet assets totaled $71,461,000, supported by cash of $14,919,028 (up from $2,890,822 in FY2025), $36,611,405 in digital assets, and $7,930,000 in corporate fund investments. Total current assets finished at $28,836,101 against current liabilities of $2,836,392 (comprising $2,004,224 in accounts payable and accrued expenses), yielding a current ratio of 10.17x.
Table Working Capital Position and Operating Cash Conversion Cycle Analysis, FY2025–FY2026
| Working Capital & Operating Cash Cycle Metric | FY2026 Metric | FY2025 Metric | Analytical Interpretation |
| Cash & Cash Equivalents | $14,919,028 | $2,890,822 | Expanded via $71.27M net financing proceeds. |
| Digital Assets (Carrying Fair Value) | $36,611,405 | $0 | Pledged indefinite-lived intangibles (ASC 350 / ASU 2023-08). |
| Corporate Fund Investments | $7,930,000 | $0 | Fund allocation held at fair value. |
| Inventory Balance | $1,395,618 | $3,042,629 | Down 54.13% following the $1.66M consignment write-off. |
| Inventory Turnover Ratio | 2.31x | N/A | Cost of goods sold (
2,219,124). |
| Days Inventory Outstanding (DIO) | 157.9 days | N/A | Lengthy turnover cycle for imported fitness hardware. |
| Accounts Receivable Balance | $447,936 | $242,079 | Up 85.04% due to commercial B2B account expansion. |
| Accounts Receivable Turnover | 16.26x | N/A | Merchandise Revenue (
345,008). |
| Days Sales Outstanding (DSO) | 22.5 days | N/A | Rapid cash collection via online retail credit payment gateways. |
| Accounts Payable & Accrued Liabilities | $2,004,224 | $1,326,988 | Up 51.04% reflecting extended trade terms with overseas OEMs. |
| Accounts Payable Turnover | 3.08x | N/A | Cost of goods sold (
1,665,606). |
| Days Payable Outstanding (DPO) | 118.5 days | N/A | Significant vendor financing buffer from overseas factories. |
| Cash Conversion Cycle (CCC) | 61.9 days | N/A | DIO (157.9 days) + DSO (22.5 days) - DPO (118.5 days). |
Cash flow analysis reveals deep structural deficits. Cash used in operating activities reached -$8,544,595 in FY2026, an 740.68% increase in operational burn from -$1,016,390 in FY2025. Non-cash charges—including $4,818,933 in debt extinguishment losses, $5,793,239 in aggregate digital asset losses, $1,658,866 in consignment write-offs, $1,510,307 in equity issuance charges, $1,344,663 in share-based consulting compensation, and $434,880 in ROU asset amortization—were offset by $3,681,139 in convertible note fair value gains and a $3,540,739 operating working capital cash drain driven by $3.43 million in prepayments and supplier deposit advances.
Investing activities consumed $50,598,439 in net cash:
* Gross purchases of digital assets consumed $58,565,000, offset by $16,254,989 in liquidation proceeds, generating a net digital treasury cash drain of $42,310,011.
* Fund investments absorbed $7,969,910.
* Physical property and equipment capital expenditures totaled $315,294 (dedicated to the Bankstown warehouse facility), alongside $3,224 in other investments.
Financing activities provided $71,269,664 in net cash inflows:
* Gross funds raised via convertible notes: $63,945,000.
* Inflows from new Class A share issuances (ATM facility and direct equity offerings): $8,042,737.
* Net financing liabilities added $329,985; related-party working capital advances added $5,547.
* Outflows included $1,038,027 in declared and paid dividends and $15,578 in share/warrant repurchases.
* Foreign currency translation adjustments generated a negative variance of $98,424, closing net cash additions at $12,028,206 and lifting period-end cash balances to $14,919,028.
Operational Footprint and Cross-Border Supply Vulnerabilities
GMEX Robotics Corporation’s operational core is located at 5 Starkie Drive, Bankstown Aerodrome, NSW 2198, Australia. Commencing May 19, 2026, the company entered into a 5-year lease for a 30,000+ square foot logistics, showroom, and corporate administrative facility maturing May 2031. Terms mandate an initial base rent of AUD $62,831 per month plus GST, escalating at a fixed 3.5% per annum, replacing its former operating warehouse at Taren Point, New South Wales.
The operational workforce in Australia comprises 18 full-time personnel across five core operational divisions: Management (4), Sales & Marketing (6), Central Fulfillment & Warehouse Logistics (5), Procurement & Supply Chain (2), and 2D/3D Industrial Design (1).
Long-lived operating assets are geographically segregated across two primary jurisdictions: Australia accounts for $6,009,112 in operating property, leases, and inventory assets, while $36,611,405 is deployed in the United States, representing BitGo custodian digital treasury assets pledged as collateral.
Merchandise procurement relies heavily on international cross-border manufacturing. In FY2026, 72.0% of total goods were sourced internationally: 70.0% manufactured in mainland China and 2.0% in Vietnam. The remaining 28.0% was sourced through domestic Australian distributors. GMEX maintains zero long-term volume supply commitments, operating on a made-to-order purchase order basis. Its procurement base exhibits severe supplier concentration, with the top 4 manufacturing partners accounting for 57.4% of total inventory purchases, and the top 5 accounting for 69.8%.
Table Major Supplier Relationships and Procurement Concentration Analysis
| Supplier Entity | Manufacturing Location | Primary Product Specialization | Share of Purchases (%) | Contractual Payment Terms |
| Nantong Tengtai Sporting Fitness | Mainland China | Rubber Hex Dumbbells | 23.4% | Payment against Bill of Lading (B/L) copy |
| Harison Fitness Limited | Mainland China | Cardio & Strength Equipment | 13.9% | Payment against Bill of Lading (B/L) copy |
| Nantong Duro Fitness Co., Ltd. | Mainland China | Weight Plates, Barbells | 13.1% | Net 14 days following receipt of goods |
| Johnson Health Tech Australia Pty Ltd | Australia | Commercial Cardio/Strength | 12.4% | 25th of month following invoice date |
| Qingdao Imbell Sporting Goods Co., Ltd. | Mainland China | Commercial Strength Lines | 7.0% | Payment against Bill of Lading (B/L) copy |
| Top 5 Procurement Total | Multi-Jurisdictional | Core Hardware Portfolio | 69.8% | Blended terms |
International sea freight logistics between East Asia and Australasia faced severe inflationary pressure. Ocean freight for a standard 20-foot general purpose (20GP) container transit corridor from Shanghai, mainland China to Sydney, Australia increased 11.85% YoY, rising from AUD $2,267.44 in mid-2025 to AUD $2,536.23 in early 2026. Maritime lead times averaged 3 to 4 weeks, compelling management to elevate Minimum Order Quantities (MOQs) and utilize third-party logistics (3PL) satellite overflow warehouses. Domestic order fulfillment from Bankstown averages 1 to 2 business days within the Sydney metropolitan area, 2 to 3 days for interstate capitals, and approximately 5 business days for regional and remote zones.
Merchandise distribution is executed via GymDirect.com.au (63.54% of sales / $3,564,349) alongside showroom, phone orders, and marketplace concessions including Bunnings Marketplace and eBay (36.46% of sales / $2,045,266). Over 81.0% of revenues were generated by four proprietary brands: Muscle Motion (power racks, benches, weights), Rapid Motion (commercial strength), FleetX (rowers, bikes, treadmills), and Harison. Third-party brand resale accounted for less than 19.0%.
Operational divergence centers on price/mix expansion versus retail volume decay: while retail consumer orders softened amid Australian interest rate pressures (pulling total transactions down 3.22% to 20,353), top-line merchandise revenue grew 7.87% due to an 11.47% rise in Average Order Value ($275.62), driven by commercial accounts comprising 33.26% ($1,865,758) of revenues.
Pillar 2 robotics commercialization efforts produced zero recognized revenue in FY2026. The pipeline includes an AUD $4.2 million purchase order signed in March 2026 with Australian food service operator FBG for 50 2Fculinary AI cooking robots (Bon Vivant 3.0 and Max models) across airport and event venues. Internal R&D remains minimal; engineering is outsourced to Shenzhen contractors, open-source model frameworks, and APIs. Smart connected fitness hardware (1FinalRound app and fitness mirrors) remains in development. Turnkey licensing (mySTEPS Training Clinic) licensed 6 centers in Eastern China to Js & Je Company Limited ($125,000 base fee plus $40,000 per location annually), but yielded $0 in recognized FY2026 revenue.
M&A execution centered on a Share Purchase Agreement signed July 28, 2026, and amended October 14, 2026, to acquire a 15% equity stake in Alpha Meta AI Pte. Ltd. (Singapore) and principal shareholder MetaGen AI Limited (British Virgin Islands) based on an unverified reference valuation of $8,400,000. Total consideration was set at $2,520,000, payable 15% in cash ($378,000) and 85% in newly created non-voting Class C Ordinary Shares ($2,142,000 value), with a 24-month option to acquire control. Concurrently, GMEX secured a perpetual, worldwide, royalty-free exclusive license to commercialize MetaGen's MediaMeta social-intelligence AI platform and robotics software. The filing includes zero audited financial records, historical revenues, or balance sheets for the target entities, and no independent third-party fairness opinion was obtained.
Pillar 3 crypto treasury operations accumulated 252,243,164 tokens with an aggregate cost basis of $39,430,556, recorded on the balance sheet at a fair market value of $36,611,405 under ASC 350 / ASU 2023-08. Assets are custodied with BitGo Trust Company, Inc. in cold-storage multi-signature wallets.
Table Digital Asset Treasury Portfolio Composition, Cost Basis, and Fair Value Assessment, FY2026
| Digital Asset Portfolio Class | Token Quantity Held | Total Cost Basis (USD) | Carrying Fair Value (USD) | FY2026 MTM Unrealized Loss | Active Market Unit Price |
| Frax USD Stablecoins | 35,380,585 tokens | $35,380,600 | $35,380,600 | $0 | $1.000000 |
| Solana (SOL) | 12,762 tokens | $2,462,194 | $928,733 | ($1,533,461) | $72.770000 |
| Pump (PUMP) | 216,849,817 tokens | $1,587,762 | $302,072 | ($1,285,690) | $0.001393 |
| Consolidated Digital Treasury | 252,243,164 tokens | $39,430,556 | $36,611,405 | ($2,819,151) | Blended |
Management maintains an explicit non-hedging policy, exposing the balance sheet to digital asset downturns. Although staking Solana generated $94,633 in rewards, protocol unbonding lockup periods restrict asset mobility. 100% of digital assets are encumbered as debt collateral: BitGo Wallet 1 ($1,230,805 in SOL/PUMP) secures Series A notes, and BitGo Wallet 2 ($35,380,600 in Frax USD) secures Series D notes. Digital assets exceed 51.2% of consolidated balance sheet assets ($36.61M of $71.46M), exposing the company to statutory reclassification as an Investment Company under Section 3(a)(1)(C) of the U.S. Investment Company Act of 1940.
Institutional Verdict and Forensic Governance Audit
GMEX Robotics Corporation’s strategic pivot presents an asymmetry between management's operational claims and underlying financial realities. While public filings emphasize an institutional transition toward culinary robotics and digital asset accumulation, 100.0% of current commercial revenue remains tied to an Australian fitness distribution platform contending with margin compression and supply chain exposure across mainland China.
The company's capital management strategy relies heavily on complex structured debt. In FY2026, GMEX raised $63,945,000 in gross proceeds through variable convertible debt packages containing floating conversion price formulas benchmarked to 95% of the lowest daily Volume Weighted Average Price (VWAP) across a 10-day lookback period.
These conversion formulas generate dynamic dilution: declines in market share price increase the number of Class A shares required to satisfy conversions. Noteholders converted $22,585,000 of principal into 86,207 pre-split shares during FY2026, and an additional $6,181,074 into 1,209,172 Class A shares post-fiscal year-end. Default clauses—including a Volume Deficiency Event triggered by depressed trading on three days within any ten-day window—empower noteholders to accelerate redemptions at 125% of par value, enforce an 18% default interest rate, or liquidate encumbered BitGo custody collateral. Late delivery of conversion shares incurs a daily cash liquidated damages penalty of 2.0%.
Convertible debt was evaluated under ASC 815 and recorded at fair value under the ASC 825 Fair Value Option using a Level 3 Monte Carlo Simulation (stock volatility inputs of 82.71% to 100.68%, discount rates of 17.28% to 17.39%). Debt carrying value stood at $38,098,883 at year-end, against an aggregate principal face value of $59,743,606.
Governance structures decouple voting control from economic interest. GMEX created a tri-class share capital base comprising Class A (1 vote per share, public float), Class B (30 votes per share, super-voting), and Class C (0 votes, non-voting, convertible). On December 17, 2025, the company repurchased 89 Class A shares from SKMA Capital and Investment Ltd. and issued 89 Class B super-voting shares in exchange. SKMA is 100% owned by Executive Director Jieting Zhao. As a result, Director Zhao commands 100.0% of the Class B voting stock, securing effective voting control over corporate transactions, board appointments, and charter amendments despite holding an economic equity stake of approximately 0.02%.
The executive team and board lack in-house technical credentials, patents, or operating backgrounds in artificial intelligence, robotics engineering, or hardware manufacturing. Related-party transactions include $22,139 in unsecured, interest-free working capital debt provided by Ansa Group Limited (an entity affiliated with Director Zhao) to GD Wellness Pty Ltd.
To avoid delisting under Nasdaq Listing Rule 5550(a)(2) ($1.00 minimum bid price), GMEX completed four reverse stock splits across FY2025 and FY2026, including a 1-for-16 consolidation on September 23, 2025; a 1-for-7 (Class A) / 1-for-28 (Class B) split on May 1, 2026; a 1-for-9 split on July 2, 2026; and a 1-for-9 split on September 28, 2026. The par value was reset to $0.000001 per share on September 28, 2026, while authorized share capital was expanded to 1,407,000,000 shares.
The cumulative reverse split ratio exceeds 1-for-9,000 over 14 months, reducing the basic public float to approximately 107,000 Class A shares held by non-affiliates (~29.6% of outstanding Class A shares at year-end). Under Nasdaq Rule 5810(c)(3)(A)(iv), excessive cumulative consolidations (>1-for-250 over a rolling 2-year window) limit regulatory grace periods for future bid deficiencies. GMEX also relies on Foreign Private Issuer exemptions under Nasdaq Rule 5615(a)(3) to bypass requirements for annual shareholder meetings, proxy statements, and non-proportional voting rights prohibitions.
The active issued share count of 1,570,622 shares represents less than 30% of the fully diluted capital base (5,280,807 shares). Note conversions, warrant overhang, and Class C shares represent substantial latent dilution.
Independent auditor Astra Audit & Advisory LLC (Tampa, FL; PCAOB Firm ID #6920; FY2026 audit fees of $155,750, up 57.72% YoY) issued an unqualified audit opinion with an explanatory paragraph regarding Going Concern uncertainty. Operating net losses of $7,131,972 and operating cash outflows of $8,544,595 raise substantial doubt about the company's ability to continue as a going concern without ongoing external capital. Management evaluated disclosure controls and internal controls over financial reporting (ICFR) under the COSO (2013) framework as ineffective as of June 30, 2026, citing material weaknesses in accounting and disclosure controls for complex fair-value convertible debt instruments (ASC 825) and embedded warrant liabilities. As an Emerging Growth Company under the JOBS Act, the company remains exempt from independent auditor ICFR attestation under Section 404(b) of the Sarbanes-Oxley Act.
Tax positions across the corporate tree show a 0.0% effective tax rate in FY2026 (income tax expense of $0 on a pre-tax loss of $17,275,818, versus tax expense of $333,497 and a 95.5% ETR in FY2025). The British Virgin Islands parent remains tax-exempt. Operating entities in Australia face a 25.0% statutory corporate rate. The $4,318,955 statutory tax benefit was offset by non-deductible items (debt extinguishment loss of $1,204,733, non-deductible consulting fees of $803,613, crypto losses of $1,448,310, and inventory adjustments of $414,717), with the remaining $177,589 offset by an increased valuation allowance against gross deferred tax assets of $566,558 (comprising $514,166 in Australian operating tax loss carryforwards, $50,244 in employee benefit accruals, and $2,148 in unrealized FX losses), leaving net recognized deferred tax assets at $0.00. The company recorded zero uncertain tax positions under ASC 740-10 (FIN 48).
GMEX Robotics Corporation's multi-class voting structure, variable-rate debt architecture, and pledged digital treasury create substantial structural exposure for public common equity holders.
Presentation Download & Video Access:
* Presentation Download: Click the PDF download link under 'Related Topics' to access the full institutional presentation of this report.
* Video Link: Click this link to watch the HDIN analyst briefing on YouTube.
About HDIN Research:
HDIN Research is a premier global market intelligence and strategic advisory firm specializing in institutional-grade financial analysis, supply chain audits, and macroeconomic forecasting. Our dedicated sector analysts deliver actionable, data-driven insights tailored for private equity, hedge funds, and corporate strategy teams. Visit us at http://www.hdinresearch.com.
2026 AI Transparency Footer:
"This intelligence report was authored by HDIN Research analysts following a rigorous audit of official corporate filings. AI was utilized for massive-scale data synthesis and structural drafting, ensuring 100% inclusion of reported data points. All strategic insights, financial modeling, and final verdicts were verified by our editorial board to ensure professional accuracy and compliance with 2026 Google Search E-E-A-T standards."