QUALCOMM Incorporated: Strategic Compute Realignment Around Taiwan, China Foundries Accelerates as 230-Basis-Point Margin Compression Exposes Handset Decoupling Risks
Date : 2026-11-09
Reading : 528
HDIN Executive Takeaways
1. QUALCOMM Incorporated [NASDAQ: QCOM] normalized pre-tax operational earnings contracted 25.66% to $9,414 million in FY2026, as an unadjusted GAAP net income surge to $13,628 million masked a $5,781 million non-cash tax release under IRS Notice 2026-07.
2. Geopolitical exposure remains concentrated, with fabless advanced 3nm and 4nm wafer sourcing anchored in Taiwan, China, while Work-in-Process inventories climbed 36.76% to $5,450 million amid OEM build-plan cuts.
3. An October 2026 federal jury victory against Arm Ltd. cleared proprietary Oryon CPU deployment across automotive, where revenue expanded 51.73% to $6,004 million, countering handset decoupling.
Figure QUALCOMM Incorporated: FY2025 vs FY2026 Strategic Tear-Down & Forensic Audit
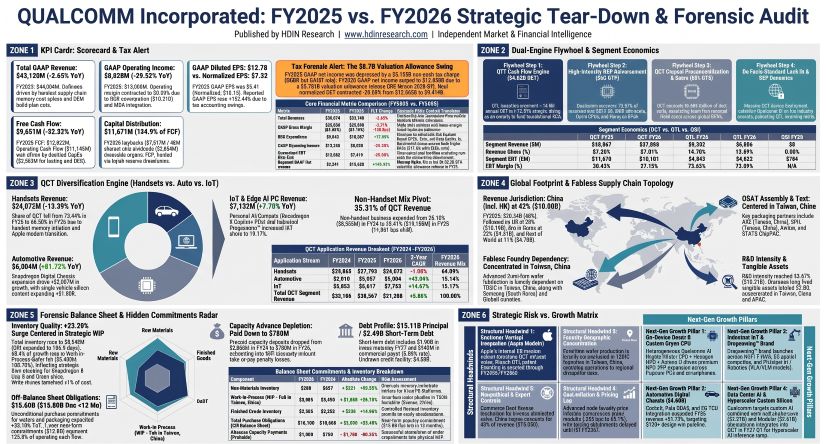 Segmental Realities, Accounting Deconstruction, and the Non-Cash Tax Paradox
QUALCOMM Incorporated witnessed an operational divergence between headline GAAP net income and underlying economic performance across FY2025 and FY2026. Consolidated revenue for FY2026 contracted 2.63% year-over-year to $43,120 million, down from $44,284 million in FY2025 (which had expanded 13.66% over FY2024 revenue of $38,962 million). Cost of revenues climbed 2.45% to $20,222 million, driving gross margin down 230 basis points to 53.10% ($22,898 million), following an 80-basis-point compression in FY2025 to 55.43% ($24,546 million). Operating income declined 29.92% year-over-year in FY2026 to $8,658 million, following a 22.68% expansion in FY2025 to $12,355 million.
The headline GAAP net income expansion of 145.95% to $13,628 million (diluted EPS of $12.70) in FY2026—following a 45.37% contraction in FY2025 to $5,541 million (diluted EPS of $5.01)—was an accounting artifact governed by ASC 740 valuation allowance adjustments.
Table Consolidated Financial Performance and Year-over-Year Growth Analysis, FY2024–FY2026
In Q4 FY2025, the enactment of the One Big Beautiful Bill Act (OBBB Act) altered corporate alternative minimum tax (CAMT) liabilities, requiring QUALCOMM Incorporated to establish a non-cash valuation allowance of $5,724 million against its domestic deferred tax assets (DTAs), raising FY2025 income tax expense to $7,122 million (56.24% ETR). In Q2 FY2026, the U.S. Department of the Treasury and the Internal Revenue Service issued Notice 2026-07, permitting domestic research expenditures capitalized under Internal Revenue Code Section 174 to offset CAMT liabilities. QUALCOMM Incorporated subsequently reversed $5,781 million of the valuation allowance, creating a net tax benefit of $4,214 million (-44.76% ETR). Normalized operational net income stood at approximately $11,265 million in FY2025 and $7,847 million in FY2026, reflecting a 30.34% operational contraction.
Table Valuation Allowance and Deferred Tax Asset Position: FY2025–FY2026 Balance Sheet Analysis ($ in millions)
Cash paid for income taxes fell 46.97% to $1,644 million in FY2026 (comprising $826 million federal, $19 million state, $799 million foreign withholding, and a final transition tax installment of $663 million), compared to $3,100 million in FY2025 ($530 million transition tax) and $3,300 million in FY2024. The Foreign-Derived Intangible Income (FDII/FDDEI) tax deduction provided a 3.91% rate benefit ($368 million) in FY2026, down from 9.69% ($1,227 million) in FY2025 and 11.43% ($1,181 million) in FY2024, as domestic R&D expensing compressed the eligible foreign deduction base. Foreign tax credits reduced taxes by 7.99% ($752 million). Singapore tax concessions generated a rate differential benefit of $195 million.
Unrecognized tax benefits (UTBs) expanded to $2,993 million in FY2026, up from $2,668 million in FY2025 and $2,450 million in FY2024. This includes an unresolved dispute with the Korean National Tax Service regarding licensing royalty withholding taxes. QUALCOMM Incorporated maintains a non-current income tax receivable of $2,700 million (recorded in other non-current assets) offset by $3,000 million in non-current liabilities for UTBs ($2,600 million tied to the Korean audit), with accrued net interest and penalties totaling $501 million against interest receivables of $372 million. Open tax audit years trace back to FY2018 in the United States and 2001 in South Korea and China.
Segmental performance highlights structural changes across Qualcomm CDMA Technologies (QCT), Qualcomm Technology Licensing (QTL), and Qualcomm Strategic Initiatives (QSI).
Table Reportable Segment Financial Performance and Profitability Analysis, FY2024–FY2026 ($ in millions)
QCT revenue contracted 3.02% to $37,208 million, while QCT EBT fell 13.44% to $10,101 million. Handsets revenue dropped 13.39% (-$3,721 million) to $24,072 million due to OEM memory cost inflation (DRAM/NAND) and initial baseband substitution by Apple Inc. Automotive revenue increased 51.73% (+$2,047 million) to $6,004 million, driven by an expansion in content per vehicle of $1,300 million and shipment volume growth of $712 million. IoT revenue rose 7.78% to $7,132 million, supported by the deployment of Snapdragon X Series AI PC processors. Non-handset revenue reached $13,136 million, representing 35.31% of QCT revenues, up 1,021 basis points over FY2024 (25.10%).
Table QCT Revenue Breakdown by End-Market Segment, FY2024–FY2026 ($ in millions)
QTL revenues held steady at $5,556 million (-0.47%) with an EBT margin of 72.39% ($4,022 million). Higher premium 5G handset mix and royalty terms contributed $238 million, which offset estimated unit shipment declines of $194 million and prior-period adjustment reductions of $43 million. QTL operational expenses remained flat between $1,530 million and $1,550 million.
QSI EBT expanded 341.11% to $794 million in FY2026, up from $180 million in FY2025 and $104 million in FY2024. FY2026 gains were driven by $258 million in equity method earnings (+$246 million), $252 million in private mark-to-market observable upward adjustments (+$208 million), and $386 million in gains from completed IPO exits (+$148 million), offset by $88 million in impairments ($113 million in FY2025).
Table Reconciliation of Reportable Segment Earnings Before Taxes (EBT) to Consolidated GAAP Earnings Before Taxes, FY2024–FY2026 ($ in millions)
Corporate overhead items not allocated to segments rose 37.05% to $4,727 million, absorbing 54.60% of consolidated GAAP operating income in FY2026, compared to 27.92% in FY2025. This variance was driven by share-based compensation (SBC), which expanded 24.04% to $3,452 million (8.01% of total revenues), up from $2,783 million in FY2025 and $2,648 million in FY2024. Pre-tax SBC allocations included $101 million in cost of revenues, $2,569 million in R&D, and $782 million in SG&A. After-tax SBC stood at $3,011 million. Restructuring charges climbed 751.28% to $332 million in FY2026 ($39 million in FY2025, $107 million in FY2024), driven by severance costs from headcount adjustments in legacy mobile operations.
Customer incentives and liabilities rose 35.73% to $2,644 million at the end of FY2026, compared to $1,948 million in FY2025 and $2,480 million in FY2024. Revenue recognized from performance obligations satisfied in previous reporting periods totaled $533 million in FY2026, down from $783 million in FY2025 (which included a $143 million licensing settlement) and $558 million in FY2024. Current unearned revenues decreased to $200 million ($358 million in FY2025, $297 million in FY2024), while total contract liabilities remained below 0.60% of consolidated revenues.
A three-factor DuPont analysis demonstrates how tax distortions affected reported returns on equity (ROE):
Reported GAAP ROE rose from 23.34% in FY2025 to 52.81% in FY2026. This was driven by the reported net profit margin rising from 12.51% to 31.60% following the $5,781 million tax release. Asset turnover declined from 0.841x to 0.777x as average total assets expanded from $52,649 million to $55,486 million, influenced by $5,043 million in acquired goodwill. The financial equity multiplier fell from 2.218x to 2.150x as average equity expanded to $25,804 million ($23,740 million in FY2025). On a normalized operational basis, underlying ROE compressed 1,704 basis points from 47.45% in FY2025 to 30.41% in FY2026.
Operating cash flow (OCF) contracted 20.46% to $11,145 million in FY2026, down from $14,012 million in FY2025 and $12,202 million in FY2024. Capital expenditures (CapEx) expanded 109.23% to $2,494 million ($1,192 million in FY2025, $1,041 million in FY2024), directed toward internal semiconductor test lines and specialized engineering facilities. Free Cash Flow (FCF) fell 32.52% to $8,651 million ($12,820 million in FY2025, $11,161 million in FY2024). Cash conversion of operating income stood at 99.92%.
Table Cash Flow Generation, Free Cash Flow, and Shareholder Capital Returns, FY2024–FY2026 ($ in millions)
Shareholder cash distributions exceeded generated FCF, reaching $11,671 million (134.91% of FCF), comprising $7,817 million in share repurchases (retiring 48 million shares) and $3,854 million in dividends ($3.62 per share). Combined with the FY2025 buyback of $8,791 million (56 million shares), QUALCOMM Incorporated retired 104 million shares over two fiscal years, reducing common shares outstanding from 1,113 million in FY2024 to 1,072 million at the end of FY2026. This capital return plan, alongside $2,323 million in cash deployed for acquisitions, reduced cash, cash equivalents, and marketable securities by $4,797 million (-38.44%) to $7,681 million.
Working capital metrics showed an expansion in the cash cycle. Days Sales Outstanding (DSO) rose from 34.0 days to 36.0 days, with accounts receivable finishing at $4,199 million ($4,315 million in FY2025). Days Inventory Outstanding (DIO) calculated on average balances rose from 119.7 days to 136.9 days, reaching 156.0 days based on ending balances.
Physical Footprint, Supply Chain Commitments, and Geopolitical Concentration
QUALCOMM Incorporated operates as a fabless semiconductor designer, relying on external wafer foundry relationships. Its advanced 3nm and 4nm nodes are concentrated with Taiwan Semiconductor Manufacturing Company (TSMC) in Taiwan, China, and Samsung Electronics in South Korea, alongside GlobalFoundries in the United States.
The geographic distribution of customer billing exposes the business to regulatory cross-currents.
Table Geographic Revenue Breakdown by Customer / Licensee Headquarters, FY2024–FY2026 ($ in millions)
Revenues derived from customers headquartered in China (including Hong Kong) accounted for 41.93% ($18,079 million) of total revenues in FY2026, down from 45.93% ($20,340 million) in FY2025. Following the U.S. Department of Commerce revocation of export licenses for Huawei Technologies Co., Ltd. in May 2024, direct product sales to Huawei ceased in Q2 FY2025. Direct customer concentration remained elevated: Customer X (Apple Inc.) accounted for 22% of consolidated revenues in FY2026 (21% in FY2025, 22% in FY2024); Customer Y (Samsung Electronics) accounted for 20% (20% in FY2025, 19% in FY2024); and Customer Z (Xiaomi) accounted for less than 10% in FY2026, falling below the single-customer disclosure threshold (down from 13% in FY2025 and 12% in FY2024).
The company's long-lived physical asset base remains concentrated in Asia.
Physical production assets outside the United States totaled $3.8 billion, located predominantly in Taiwan, China, and the broader Asia-Pacific region. OSAT packaging, bump, and testing are performed by Advanced Semiconductor Engineering (ASE) and Siliconware Precision Industries (SPIL) in Taiwan, China; Amkor Technology in the United States and Asia; and STATS ChipPAC in Singapore and China.
As an exception to its fabless architecture, QUALCOMM Incorporated owns and operates internal fabrication facilities for RFFE modules and acoustic radio-frequency filters. Front-end wafer fabrication facilities are located in Germany and Singapore, with back-end assembly, packaging, and testing facilities in China and Singapore. Logistics hubs are centralized in Singapore, while key overseas engineering R&D hubs operate in India and China.
Balance sheet inventories expanded 32.39% (+$2,114 million) in FY2026 to $8,640 million.
Work-in-Process (WIP), which tracks silicon wafers moving through front-end lithography in Taiwan, China, expanded 36.76% to $5,450 million, accounting for 69.30% of total inventory growth. Raw materials increased 95.54% to $657 million, reflecting purchases of DRAM and substrate stock from Micron Technology and Samsung Electronics to support automotive and PC compute shipments. Finished goods grew 14.88% to $2,533 million. Inventory valuation write-downs to net realizable value remained below 1% of total cost of revenues in both FY2025 and FY2026, indicating that the expansion represents active supply hedging rather than finished-goods obsolescence.
Off-balance sheet long-term foundry obligations expanded alongside balance sheet inventory.
Unconditional purchase obligations rose 23.18% to $18,600 million in FY2026, with commitments due within one year expanding 31.43% to $13,800 million. These obligations represent 123.82% of FY2026 operating cash flow ($11,145 million).
Contracts stipulate the payment of incurred manufacturing costs upon cancellation, while multi-year commitments enforce minimum purchase thresholds, carrying penalty fees or the forfeiture of deposits if capacity goes underutilized.
Outstanding advance capacity payments dropped from $3,000 million in FY2024 to $1,900 million in FY2025 and $750 million in FY2026 ($169 million current, $581 million non-current), indicating that historical cash deposits have been converted into delivered silicon inventory.
Enterprise capex and debt refinancing show active capital structure management.
Total short-term debt reached $2,492 million in FY2026, comprising $1,993 million in notes due in FY2027 and $499 million in short-term commercial paper. Long-term debt stood at $12,620 million. Bank credit facilities include a $4,000 million unsecured revolving credit facility with Bank of America maturing on August 8, 2029, which remained undrawn ($0 balance) at fiscal year-end.
Total derivative notional value rose 24.79% to $9,908 million in FY2026 ($7,940 million in FY2025). The portfolio comprises foreign exchange forwards of $4,381 million ($3,828 million in FY2025), currency options of $527 million ($562 million in FY2025), and interest rate swaps of $5,000 million ($3,550 million in FY2025). Currency exposures consist of USD-denominated instruments totaling $5,165 million (52.13%), Indian Rupee hedges of $2,254 million (22.75%), Chinese Renminbi hedges of $1,530 million (15.44%), and other currencies totaling $959 million (9.68%).
The net derivative liability fair value stood at $369 million (assets of $39 million, liabilities of $408 million). Net unrealized losses in accumulated other comprehensive income (AOCI) were $64 million in FY2026, compared to $36 million in FY2025. Item 7A sensitivity modeling projects that a 100-basis-point upward shift in interest rate yield curves would produce no material impact on earnings.
In inorganic investments, QUALCOMM Incorporated deployed $4,889 million toward acquisitions in FY2026:
* Alphawave IP Group plc was acquired in Q1 FY2026 (closed December 18, 2025) for $2,274 million ($1,800 million stock and $301 million cash), securing high-speed SerDes, optical interconnects, and chiplet custom silicon assets. This generated $2,136 million in goodwill and $251 million in developed technology.
* Modular Inc. was acquired in Q4 FY2026 (closed July 28, 2026) for $2,615 million (18 million common shares, including $325 million in transferred consideration), securing its open AI-native compiler and compute orchestration software. This generated $2,140 million in goodwill and $501 million in developed technology.
* Eight additional acquisitions across IoT and automotive totaled $1,100 million ($767 million goodwill, $313 million intangibles), following seven bolt-on acquisitions in FY2025 totaling $668 million ($526 million goodwill, $122 million intangibles).
* Consolidated balance sheet goodwill increased 44.16% to $16,374 million. Impairment testing across reportable units indicated that fair values exceeded carrying values, resulting in zero goodwill impairment charges across FY2025 and FY2026, leaving cumulative impairments unchanged at $812 million.
HDIN Institutional Verdict
The operational and legal realignments disclosed in the FY2025 and FY2026 filings reveal several strategic frictions beneath QUALCOMM Incorporated's non-handset growth narrative.
The legal victory against Arm Ltd. in the U.S. District Court for the District of Delaware resolved an existential risk to the company's proprietary CPU roadmap. On December 20, 2024, a jury determined that QUALCOMM Incorporated did not breach the Nuvia Architecture License Agreement (ALA), followed by a final judgment on September 30, 2025, confirming that Oryon CPU architectures are protected under the preexisting Qualcomm ALA.
On October 13, 2026, a federal jury found that Arm Ltd. breached the Qualcomm ALA and interfered with customer economic relationships, following Arm's withdrawal of its license cancellation notice in January 2025. This series of verdicts clears the legal path for the Oryon CPU to underpin the Snapdragon X Series PC platforms, Snapdragon Cockpit/Ride platforms, and Dragonfly data center architectures.
However, moving into non-cellular compute introduces business model dilution. The company's corporate margins depend on QTL, which generated an EBT margin of 72.39% ($4,022 million) in FY2026 to help fund corporate R&D expenditures of $10,207 million. In its core smartphone market, QUALCOMM Incorporated collects a percentage of the total wholesale device selling price (typically 3.00% to 5.00%) under standard-essential patent (SEP) licenses, regardless of whether the OEM uses its silicon.
This model does not apply to non-cellular PCs, industrial automation, and data center servers. QUALCOMM Incorporated cannot collect a wholesale device royalty on a $1,000 personal computer or a $100,000 server rack that lacks an embedded cellular baseband. As revenue migrates toward these sectors, the business relies solely on QCT chip sales margins, which stood at an EBT margin of 27.15% in FY2026. This dynamic contributed to the 1,704-basis-point compression in normalized ROE (falling to 30.41%).
Customer vertical integration creates a known headwind. While Apple Inc. extended its QTL licensing agreement through FY2030–FY2033, securing licensing cash flows, its transition toward internal basebands will reduce QCT thin-modem chip volumes. Handset segment revenues contracted 13.39% (-$3,721 million) in FY2026. While automotive expansion (+51.73% to $6,004 million) and IoT sales ($7,132 million) offset these declines, these markets require higher working capital, customized engineering support, and extended product cycles.
Internal human capital metrics reflect this operational pivot. Global headcount increased 9.61% in FY2026 to 57,000 employees (up from 52,000), while revenue per employee fell 11.17% to $756,491 ($851,615 in FY2025), and operating income per employee fell 36.07% to $151,895 ($237,596 in FY2025). The company recognized $332 million in severance restructuring charges to reduce headcount in legacy smartphone units while shifting engineering capacity toward data center integration (Modular and Alphawave).
At the same time, the board allocated $11,671 million to share repurchases and dividends—exceeding free cash flow generation by 34.91% and reducing liquid reserves to $7,681 million—ahead of $2,000 million in debt maturities in FY2027. While QUALCOMM Incorporated maintains technical moats in 5G Advanced (Release 18/19), 6G patent specifications (targeted for 2029/2030), and custom Oryon CPU silicon, sustaining historic returns will require executing on its hyperscaler data center ramp in FY2027 and passing advanced node foundry cost inflation through to end customers.
Presentation Download & Video Access:
- Presentation Download: Click the PDF download link under 'Related Topics' to access the full institutional presentation of this report.
- Video Link: Click this link to watch the HDIN analyst briefing on YouTube.
About HDIN Research:
HDIN Research is a premier global market intelligence and strategic advisory firm specializing in institutional-grade financial analysis, supply chain audits, and macroeconomic forecasting. Our dedicated sector analysts deliver actionable, data-driven insights tailored for private equity, hedge funds, and corporate strategy teams. Visit us at http://www.hdinresearch.com.
2026 AI Transparency Footer:
"This intelligence report was authored by HDIN Research analysts following a rigorous audit of official corporate filings. AI was utilized for massive-scale data synthesis and structural drafting, ensuring 100% inclusion of reported data points. All strategic insights, financial modeling, and final verdicts were verified by our editorial board to ensure professional accuracy and compliance with 2026 Google Search E-E-A-T standards."
1. QUALCOMM Incorporated [NASDAQ: QCOM] normalized pre-tax operational earnings contracted 25.66% to $9,414 million in FY2026, as an unadjusted GAAP net income surge to $13,628 million masked a $5,781 million non-cash tax release under IRS Notice 2026-07.
2. Geopolitical exposure remains concentrated, with fabless advanced 3nm and 4nm wafer sourcing anchored in Taiwan, China, while Work-in-Process inventories climbed 36.76% to $5,450 million amid OEM build-plan cuts.
3. An October 2026 federal jury victory against Arm Ltd. cleared proprietary Oryon CPU deployment across automotive, where revenue expanded 51.73% to $6,004 million, countering handset decoupling.
Figure QUALCOMM Incorporated: FY2025 vs FY2026 Strategic Tear-Down & Forensic Audit
Segmental Realities, Accounting Deconstruction, and the Non-Cash Tax ParadoxQUALCOMM Incorporated witnessed an operational divergence between headline GAAP net income and underlying economic performance across FY2025 and FY2026. Consolidated revenue for FY2026 contracted 2.63% year-over-year to $43,120 million, down from $44,284 million in FY2025 (which had expanded 13.66% over FY2024 revenue of $38,962 million). Cost of revenues climbed 2.45% to $20,222 million, driving gross margin down 230 basis points to 53.10% ($22,898 million), following an 80-basis-point compression in FY2025 to 55.43% ($24,546 million). Operating income declined 29.92% year-over-year in FY2026 to $8,658 million, following a 22.68% expansion in FY2025 to $12,355 million.
The headline GAAP net income expansion of 145.95% to $13,628 million (diluted EPS of $12.70) in FY2026—following a 45.37% contraction in FY2025 to $5,541 million (diluted EPS of $5.01)—was an accounting artifact governed by ASC 740 valuation allowance adjustments.
Table Consolidated Financial Performance and Year-over-Year Growth Analysis, FY2024–FY2026
| Consolidated Financial Metric ($ in millions, except EPS) | FY2024 | FY2025 | FY2026 | YoY Variance (FY25/FY24) | YoY Variance (FY26/FY25) |
| Consolidated Revenues | $38,962 | $44,284 | $43,120 | +13.66% | -2.63% |
| Cost of Revenues | $17,060 | $19,738 | $20,222 | +15.70% | +2.45% |
| Gross Margin ($) | $21,902 | $24,546 | $22,898 | +12.07% | -6.71% |
| Gross Margin (%) | 56.21% | 55.43% | 53.10% | -78 bps | -233 bps |
| Research & Development (R&D) | $8,893 | $9,042 | $10,207 | +1.68% | +12.88% |
| Selling, General & Administrative (SG&A) | $2,759 | $3,110 | $3,701 | +12.72% | +19.00% |
| Operating Income | $10,071 | $12,355 | $8,658 | +22.68% | -29.92% |
| Interest Expense | $(697) | $(664) | $(689) | -4.73% | +3.77% |
| Investment & Other Income, Net | $962 | $972 | $1,445 | +1.04% | +48.66% |
| Earnings Before Taxes (EBT) | $10,336 | $12,663 | $9,414 | +22.51% | -25.66% |
| Income Tax Provision / (Benefit) | $226 | $7,122 | $(4,214) | +3,051.33% | -159.17% |
| Effective Tax Rate (ETR) | 2.19% | 56.24% | -44.76% | +5,405 bps | -10,100 bps |
| GAAP Net Income | $10,142 | $5,541 | $13,628 | -45.37% | +145.95% |
| Diluted EPS ($) | $8.97 | $5.01 | $12.70 | -44.15% | +153.49% |
| Normalized Operational Net Income | ~$10,142 | ~$11,265 | ~$7,847 | +11.07% | -30.34% |
In Q4 FY2025, the enactment of the One Big Beautiful Bill Act (OBBB Act) altered corporate alternative minimum tax (CAMT) liabilities, requiring QUALCOMM Incorporated to establish a non-cash valuation allowance of $5,724 million against its domestic deferred tax assets (DTAs), raising FY2025 income tax expense to $7,122 million (56.24% ETR). In Q2 FY2026, the U.S. Department of the Treasury and the Internal Revenue Service issued Notice 2026-07, permitting domestic research expenditures capitalized under Internal Revenue Code Section 174 to offset CAMT liabilities. QUALCOMM Incorporated subsequently reversed $5,781 million of the valuation allowance, creating a net tax benefit of $4,214 million (-44.76% ETR). Normalized operational net income stood at approximately $11,265 million in FY2025 and $7,847 million in FY2026, reflecting a 30.34% operational contraction.
Table Valuation Allowance and Deferred Tax Asset Position: FY2025–FY2026 Balance Sheet Analysis ($ in millions)
| Valuation Allowance & Deferred Tax Balance Sheet Detail ($ in millions) | FY2025 Period-End | FY2026 Period-End | Absolute Change |
| Capitalized Research & Development (IRC Section 174) | $4,194 | $3,737 | $(457) |
| Unused Tax Credit Carryforwards | $2,527 | $2,912 | +$385 |
| Customer Incentive Liabilities | $790 | $620 | $(170) |
| Unused Net Operating Loss Carryforwards (NOLs) | $708 | $342 | $(366) |
| Accrued Liabilities & Reserves | $410 | $425 | +$15 |
| Other Deferred Tax Assets | $1,069 | $1,417 | +$348 |
| Gross Deferred Tax Assets | $9,698 | $9,453 | $(245) |
| Valuation Allowance | $(8,016) | $(2,448) | +$5,568 |
| Net Deferred Tax Assets | $1,682 | $7,005 | +$5,323 |
| Deferred Tax Liabilities | $(1,070) | $(1,371) | $(301) |
| Net Deferred Tax Asset Position on Consolidated Balance Sheet | $612 | $5,634 | +$5,022 |
Cash paid for income taxes fell 46.97% to $1,644 million in FY2026 (comprising $826 million federal, $19 million state, $799 million foreign withholding, and a final transition tax installment of $663 million), compared to $3,100 million in FY2025 ($530 million transition tax) and $3,300 million in FY2024. The Foreign-Derived Intangible Income (FDII/FDDEI) tax deduction provided a 3.91% rate benefit ($368 million) in FY2026, down from 9.69% ($1,227 million) in FY2025 and 11.43% ($1,181 million) in FY2024, as domestic R&D expensing compressed the eligible foreign deduction base. Foreign tax credits reduced taxes by 7.99% ($752 million). Singapore tax concessions generated a rate differential benefit of $195 million.
Unrecognized tax benefits (UTBs) expanded to $2,993 million in FY2026, up from $2,668 million in FY2025 and $2,450 million in FY2024. This includes an unresolved dispute with the Korean National Tax Service regarding licensing royalty withholding taxes. QUALCOMM Incorporated maintains a non-current income tax receivable of $2,700 million (recorded in other non-current assets) offset by $3,000 million in non-current liabilities for UTBs ($2,600 million tied to the Korean audit), with accrued net interest and penalties totaling $501 million against interest receivables of $372 million. Open tax audit years trace back to FY2018 in the United States and 2001 in South Korea and China.
Segmental performance highlights structural changes across Qualcomm CDMA Technologies (QCT), Qualcomm Technology Licensing (QTL), and Qualcomm Strategic Initiatives (QSI).
Table Reportable Segment Financial Performance and Profitability Analysis, FY2024–FY2026 ($ in millions)
| Reportable Segment Financial Metrics ($ in millions) | FY2024 | FY2025 | FY2026 | YoY Variance (FY26/FY25) |
| QCT Revenues | $33,196 | $38,367 | $37,208 | -3.02% |
| QCT Earnings Before Taxes (EBT) | $9,527 | $11,670 | $10,101 | -13.44% |
| QCT EBT Margin (%) | 28.70% | 30.42% | 27.15% | -327 bps |
| QTL Revenues | $5,572 | $5,582 | $5,556 | -0.47% |
| QTL Earnings Before Taxes (EBT) | $4,027 | $4,043 | $4,022 | -0.52% |
| QTL EBT Margin (%) | 72.27% | 72.43% | 72.39% | -4 bps |
| QSI Revenues | $18 | $0 | $0 | — |
| QSI Earnings Before Taxes (EBT) | $104 | $180 | $794 | +341.11% |
| Total Reportable Segment Revenues | $38,786 | $43,949 | $42,764 | -2.70% |
| Total Reportable Segment EBT | $13,658 | $15,893 | $14,917 | -6.14% |
QCT revenue contracted 3.02% to $37,208 million, while QCT EBT fell 13.44% to $10,101 million. Handsets revenue dropped 13.39% (-$3,721 million) to $24,072 million due to OEM memory cost inflation (DRAM/NAND) and initial baseband substitution by Apple Inc. Automotive revenue increased 51.73% (+$2,047 million) to $6,004 million, driven by an expansion in content per vehicle of $1,300 million and shipment volume growth of $712 million. IoT revenue rose 7.78% to $7,132 million, supported by the deployment of Snapdragon X Series AI PC processors. Non-handset revenue reached $13,136 million, representing 35.31% of QCT revenues, up 1,021 basis points over FY2024 (25.10%).
Table QCT Revenue Breakdown by End-Market Segment, FY2024–FY2026 ($ in millions)
| QCT Revenue by End-Market Stream ($ in millions) | FY2024 | FY2025 | FY2026 | Share of QCT (FY26) |
| Handsets | $24,863 | $27,793 | $24,072 | 64.69% |
| Automotive | $2,910 | $3,957 | $6,004 | 16.14% |
| Internet of Things (IoT) | $5,423 | $6,617 | $7,132 | 19.17% |
| Total QCT Segment Revenue | $33,196 | $38,367 | $37,208 | 100.00% |
| Non-Handset Subtotal (Automotive + IoT) | $8,333 | $10,574 | $13,136 | 35.31% |
QTL revenues held steady at $5,556 million (-0.47%) with an EBT margin of 72.39% ($4,022 million). Higher premium 5G handset mix and royalty terms contributed $238 million, which offset estimated unit shipment declines of $194 million and prior-period adjustment reductions of $43 million. QTL operational expenses remained flat between $1,530 million and $1,550 million.
QSI EBT expanded 341.11% to $794 million in FY2026, up from $180 million in FY2025 and $104 million in FY2024. FY2026 gains were driven by $258 million in equity method earnings (+$246 million), $252 million in private mark-to-market observable upward adjustments (+$208 million), and $386 million in gains from completed IPO exits (+$148 million), offset by $88 million in impairments ($113 million in FY2025).
Table Reconciliation of Reportable Segment Earnings Before Taxes (EBT) to Consolidated GAAP Earnings Before Taxes, FY2024–FY2026 ($ in millions)
| Reconciliation of Reportable Segment EBT to Consolidated GAAP EBT ($ in millions) | FY2024 | FY2025 | FY2026 |
| Total Reportable Segments EBT | $13,658 | $15,893 | $14,917 |
| Non-Reportable Segments (Data Center & QGOV Operating Losses) | $(14) | $(39) | $(607) |
| Unallocated Revenues (Settlements) | $0 | +$143 | $(120) |
| Unallocated Cost of Revenues (incl. SBC of $101M in FY26) | $(229) | $(270) | $(400) |
| Unallocated Research & Development (incl. SBC of $2,569M in FY26) | $(2,277) | $(2,357) | $(2,829) |
| Unallocated Selling, General & Administrative (incl. SBC of $782M in FY26) | $(781) | $(783) | $(1,166) |
| Unallocated Other Expenses (Restructuring & Severance Charges) | $(179) | $(39) | $(332) |
| Total Unallocated Operating Overhead Deductions | $(3,466) | $(3,449) | $(4,727) |
| Unallocated Interest Expense | $(697) | $(664) | $(689) |
| Unallocated Investment & Other Income, Net | +$855 | +$779 | +$640 |
| Consolidated GAAP Income Before Income Taxes (EBT) | $10,336 | $12,663 | $9,414 |
| Consolidated GAAP Operating Income | $10,071 | $12,355 | $8,658 |
| Unallocated Overhead as a % of Consolidated GAAP Operating Income | 34.42% | 27.92% | 54.60% |
Corporate overhead items not allocated to segments rose 37.05% to $4,727 million, absorbing 54.60% of consolidated GAAP operating income in FY2026, compared to 27.92% in FY2025. This variance was driven by share-based compensation (SBC), which expanded 24.04% to $3,452 million (8.01% of total revenues), up from $2,783 million in FY2025 and $2,648 million in FY2024. Pre-tax SBC allocations included $101 million in cost of revenues, $2,569 million in R&D, and $782 million in SG&A. After-tax SBC stood at $3,011 million. Restructuring charges climbed 751.28% to $332 million in FY2026 ($39 million in FY2025, $107 million in FY2024), driven by severance costs from headcount adjustments in legacy mobile operations.
Customer incentives and liabilities rose 35.73% to $2,644 million at the end of FY2026, compared to $1,948 million in FY2025 and $2,480 million in FY2024. Revenue recognized from performance obligations satisfied in previous reporting periods totaled $533 million in FY2026, down from $783 million in FY2025 (which included a $143 million licensing settlement) and $558 million in FY2024. Current unearned revenues decreased to $200 million ($358 million in FY2025, $297 million in FY2024), while total contract liabilities remained below 0.60% of consolidated revenues.
A three-factor DuPont analysis demonstrates how tax distortions affected reported returns on equity (ROE):
Reported GAAP ROE rose from 23.34% in FY2025 to 52.81% in FY2026. This was driven by the reported net profit margin rising from 12.51% to 31.60% following the $5,781 million tax release. Asset turnover declined from 0.841x to 0.777x as average total assets expanded from $52,649 million to $55,486 million, influenced by $5,043 million in acquired goodwill. The financial equity multiplier fell from 2.218x to 2.150x as average equity expanded to $25,804 million ($23,740 million in FY2025). On a normalized operational basis, underlying ROE compressed 1,704 basis points from 47.45% in FY2025 to 30.41% in FY2026.
Operating cash flow (OCF) contracted 20.46% to $11,145 million in FY2026, down from $14,012 million in FY2025 and $12,202 million in FY2024. Capital expenditures (CapEx) expanded 109.23% to $2,494 million ($1,192 million in FY2025, $1,041 million in FY2024), directed toward internal semiconductor test lines and specialized engineering facilities. Free Cash Flow (FCF) fell 32.52% to $8,651 million ($12,820 million in FY2025, $11,161 million in FY2024). Cash conversion of operating income stood at 99.92%.
Table Cash Flow Generation, Free Cash Flow, and Shareholder Capital Returns, FY2024–FY2026 ($ in millions)
| Cash Flow Generation & Capital Distribution ($ in millions) | FY2024 | FY2025 | FY2026 |
| Cash Flow from Operating Activities (OCF) | $12,202 | $14,012 | $11,145 |
| Less: Capital Expenditures (CapEx) | $(1,041) | $(1,192) | $(2,494) |
| Free Cash Flow (FCF) | $11,161 | $12,820 | $8,651 |
| Share Repurchase Distributions (Repurchase & Retire) | $(7,345) | $(8,791) | $(7,817) |
| Common Stock Cash Dividends Paid | $(3,639) | $(3,812) | $(3,854) |
| Total Direct Shareholder Capital Payouts | $(10,984) | $(12,603) | $(11,671) |
| Total Capital Payouts as a % of Free Cash Flow | 98.41% | 98.31% | 134.91% |
Shareholder cash distributions exceeded generated FCF, reaching $11,671 million (134.91% of FCF), comprising $7,817 million in share repurchases (retiring 48 million shares) and $3,854 million in dividends ($3.62 per share). Combined with the FY2025 buyback of $8,791 million (56 million shares), QUALCOMM Incorporated retired 104 million shares over two fiscal years, reducing common shares outstanding from 1,113 million in FY2024 to 1,072 million at the end of FY2026. This capital return plan, alongside $2,323 million in cash deployed for acquisitions, reduced cash, cash equivalents, and marketable securities by $4,797 million (-38.44%) to $7,681 million.
Working capital metrics showed an expansion in the cash cycle. Days Sales Outstanding (DSO) rose from 34.0 days to 36.0 days, with accounts receivable finishing at $4,199 million ($4,315 million in FY2025). Days Inventory Outstanding (DIO) calculated on average balances rose from 119.7 days to 136.9 days, reaching 156.0 days based on ending balances.
Physical Footprint, Supply Chain Commitments, and Geopolitical Concentration
QUALCOMM Incorporated operates as a fabless semiconductor designer, relying on external wafer foundry relationships. Its advanced 3nm and 4nm nodes are concentrated with Taiwan Semiconductor Manufacturing Company (TSMC) in Taiwan, China, and Samsung Electronics in South Korea, alongside GlobalFoundries in the United States.
The geographic distribution of customer billing exposes the business to regulatory cross-currents.
Table Geographic Revenue Breakdown by Customer / Licensee Headquarters, FY2024–FY2026 ($ in millions)
| Geographic Market by Customer / Licensee HQ ($ in millions) | FY2024 Revenue | FY2024 % | FY2025 Revenue | FY2025 % | FY2026 Revenue | FY2026 % |
| China (including Hong Kong) | $17,826 | 45.75% | $20,340 | 45.93% | $18,079 | 41.93% |
| United States | $9,686 | 24.86% | $10,515 | 23.74% | $10,792 | 25.03% |
| South Korea | $7,995 | 20.52% | $9,542 | 21.55% | $9,467 | 21.95% |
| Other Foreign Jurisdictions | $3,455 | 8.87% | $3,887 | 8.78% | $4,782 | 11.09% |
| Consolidated Total Revenues | $38,962 | 100.00% | $44,284 | 100.00% | $43,120 | 100.00% |
Revenues derived from customers headquartered in China (including Hong Kong) accounted for 41.93% ($18,079 million) of total revenues in FY2026, down from 45.93% ($20,340 million) in FY2025. Following the U.S. Department of Commerce revocation of export licenses for Huawei Technologies Co., Ltd. in May 2024, direct product sales to Huawei ceased in Q2 FY2025. Direct customer concentration remained elevated: Customer X (Apple Inc.) accounted for 22% of consolidated revenues in FY2026 (21% in FY2025, 22% in FY2024); Customer Y (Samsung Electronics) accounted for 20% (20% in FY2025, 19% in FY2024); and Customer Z (Xiaomi) accounted for less than 10% in FY2026, falling below the single-customer disclosure threshold (down from 13% in FY2025 and 12% in FY2024).
The company's long-lived physical asset base remains concentrated in Asia.
Physical production assets outside the United States totaled $3.8 billion, located predominantly in Taiwan, China, and the broader Asia-Pacific region. OSAT packaging, bump, and testing are performed by Advanced Semiconductor Engineering (ASE) and Siliconware Precision Industries (SPIL) in Taiwan, China; Amkor Technology in the United States and Asia; and STATS ChipPAC in Singapore and China.
As an exception to its fabless architecture, QUALCOMM Incorporated owns and operates internal fabrication facilities for RFFE modules and acoustic radio-frequency filters. Front-end wafer fabrication facilities are located in Germany and Singapore, with back-end assembly, packaging, and testing facilities in China and Singapore. Logistics hubs are centralized in Singapore, while key overseas engineering R&D hubs operate in India and China.
Balance sheet inventories expanded 32.39% (+$2,114 million) in FY2026 to $8,640 million.
Work-in-Process (WIP), which tracks silicon wafers moving through front-end lithography in Taiwan, China, expanded 36.76% to $5,450 million, accounting for 69.30% of total inventory growth. Raw materials increased 95.54% to $657 million, reflecting purchases of DRAM and substrate stock from Micron Technology and Samsung Electronics to support automotive and PC compute shipments. Finished goods grew 14.88% to $2,533 million. Inventory valuation write-downs to net realizable value remained below 1% of total cost of revenues in both FY2025 and FY2026, indicating that the expansion represents active supply hedging rather than finished-goods obsolescence.
Off-balance sheet long-term foundry obligations expanded alongside balance sheet inventory.
Unconditional purchase obligations rose 23.18% to $18,600 million in FY2026, with commitments due within one year expanding 31.43% to $13,800 million. These obligations represent 123.82% of FY2026 operating cash flow ($11,145 million).
Contracts stipulate the payment of incurred manufacturing costs upon cancellation, while multi-year commitments enforce minimum purchase thresholds, carrying penalty fees or the forfeiture of deposits if capacity goes underutilized.
Outstanding advance capacity payments dropped from $3,000 million in FY2024 to $1,900 million in FY2025 and $750 million in FY2026 ($169 million current, $581 million non-current), indicating that historical cash deposits have been converted into delivered silicon inventory.
Enterprise capex and debt refinancing show active capital structure management.
Total short-term debt reached $2,492 million in FY2026, comprising $1,993 million in notes due in FY2027 and $499 million in short-term commercial paper. Long-term debt stood at $12,620 million. Bank credit facilities include a $4,000 million unsecured revolving credit facility with Bank of America maturing on August 8, 2029, which remained undrawn ($0 balance) at fiscal year-end.
Total derivative notional value rose 24.79% to $9,908 million in FY2026 ($7,940 million in FY2025). The portfolio comprises foreign exchange forwards of $4,381 million ($3,828 million in FY2025), currency options of $527 million ($562 million in FY2025), and interest rate swaps of $5,000 million ($3,550 million in FY2025). Currency exposures consist of USD-denominated instruments totaling $5,165 million (52.13%), Indian Rupee hedges of $2,254 million (22.75%), Chinese Renminbi hedges of $1,530 million (15.44%), and other currencies totaling $959 million (9.68%).
The net derivative liability fair value stood at $369 million (assets of $39 million, liabilities of $408 million). Net unrealized losses in accumulated other comprehensive income (AOCI) were $64 million in FY2026, compared to $36 million in FY2025. Item 7A sensitivity modeling projects that a 100-basis-point upward shift in interest rate yield curves would produce no material impact on earnings.
In inorganic investments, QUALCOMM Incorporated deployed $4,889 million toward acquisitions in FY2026:
* Alphawave IP Group plc was acquired in Q1 FY2026 (closed December 18, 2025) for $2,274 million ($1,800 million stock and $301 million cash), securing high-speed SerDes, optical interconnects, and chiplet custom silicon assets. This generated $2,136 million in goodwill and $251 million in developed technology.
* Modular Inc. was acquired in Q4 FY2026 (closed July 28, 2026) for $2,615 million (18 million common shares, including $325 million in transferred consideration), securing its open AI-native compiler and compute orchestration software. This generated $2,140 million in goodwill and $501 million in developed technology.
* Eight additional acquisitions across IoT and automotive totaled $1,100 million ($767 million goodwill, $313 million intangibles), following seven bolt-on acquisitions in FY2025 totaling $668 million ($526 million goodwill, $122 million intangibles).
* Consolidated balance sheet goodwill increased 44.16% to $16,374 million. Impairment testing across reportable units indicated that fair values exceeded carrying values, resulting in zero goodwill impairment charges across FY2025 and FY2026, leaving cumulative impairments unchanged at $812 million.
HDIN Institutional Verdict
The operational and legal realignments disclosed in the FY2025 and FY2026 filings reveal several strategic frictions beneath QUALCOMM Incorporated's non-handset growth narrative.
The legal victory against Arm Ltd. in the U.S. District Court for the District of Delaware resolved an existential risk to the company's proprietary CPU roadmap. On December 20, 2024, a jury determined that QUALCOMM Incorporated did not breach the Nuvia Architecture License Agreement (ALA), followed by a final judgment on September 30, 2025, confirming that Oryon CPU architectures are protected under the preexisting Qualcomm ALA.
On October 13, 2026, a federal jury found that Arm Ltd. breached the Qualcomm ALA and interfered with customer economic relationships, following Arm's withdrawal of its license cancellation notice in January 2025. This series of verdicts clears the legal path for the Oryon CPU to underpin the Snapdragon X Series PC platforms, Snapdragon Cockpit/Ride platforms, and Dragonfly data center architectures.
However, moving into non-cellular compute introduces business model dilution. The company's corporate margins depend on QTL, which generated an EBT margin of 72.39% ($4,022 million) in FY2026 to help fund corporate R&D expenditures of $10,207 million. In its core smartphone market, QUALCOMM Incorporated collects a percentage of the total wholesale device selling price (typically 3.00% to 5.00%) under standard-essential patent (SEP) licenses, regardless of whether the OEM uses its silicon.
This model does not apply to non-cellular PCs, industrial automation, and data center servers. QUALCOMM Incorporated cannot collect a wholesale device royalty on a $1,000 personal computer or a $100,000 server rack that lacks an embedded cellular baseband. As revenue migrates toward these sectors, the business relies solely on QCT chip sales margins, which stood at an EBT margin of 27.15% in FY2026. This dynamic contributed to the 1,704-basis-point compression in normalized ROE (falling to 30.41%).
Customer vertical integration creates a known headwind. While Apple Inc. extended its QTL licensing agreement through FY2030–FY2033, securing licensing cash flows, its transition toward internal basebands will reduce QCT thin-modem chip volumes. Handset segment revenues contracted 13.39% (-$3,721 million) in FY2026. While automotive expansion (+51.73% to $6,004 million) and IoT sales ($7,132 million) offset these declines, these markets require higher working capital, customized engineering support, and extended product cycles.
Internal human capital metrics reflect this operational pivot. Global headcount increased 9.61% in FY2026 to 57,000 employees (up from 52,000), while revenue per employee fell 11.17% to $756,491 ($851,615 in FY2025), and operating income per employee fell 36.07% to $151,895 ($237,596 in FY2025). The company recognized $332 million in severance restructuring charges to reduce headcount in legacy smartphone units while shifting engineering capacity toward data center integration (Modular and Alphawave).
At the same time, the board allocated $11,671 million to share repurchases and dividends—exceeding free cash flow generation by 34.91% and reducing liquid reserves to $7,681 million—ahead of $2,000 million in debt maturities in FY2027. While QUALCOMM Incorporated maintains technical moats in 5G Advanced (Release 18/19), 6G patent specifications (targeted for 2029/2030), and custom Oryon CPU silicon, sustaining historic returns will require executing on its hyperscaler data center ramp in FY2027 and passing advanced node foundry cost inflation through to end customers.
Presentation Download & Video Access:
- Presentation Download: Click the PDF download link under 'Related Topics' to access the full institutional presentation of this report.
- Video Link: Click this link to watch the HDIN analyst briefing on YouTube.
About HDIN Research:
HDIN Research is a premier global market intelligence and strategic advisory firm specializing in institutional-grade financial analysis, supply chain audits, and macroeconomic forecasting. Our dedicated sector analysts deliver actionable, data-driven insights tailored for private equity, hedge funds, and corporate strategy teams. Visit us at http://www.hdinresearch.com.
2026 AI Transparency Footer:
"This intelligence report was authored by HDIN Research analysts following a rigorous audit of official corporate filings. AI was utilized for massive-scale data synthesis and structural drafting, ensuring 100% inclusion of reported data points. All strategic insights, financial modeling, and final verdicts were verified by our editorial board to ensure professional accuracy and compliance with 2026 Google Search E-E-A-T standards."