Wetour Robotics Limited: Physical AI Pivot Stalls Across Austin and Hangzhou Operations as Zero Commercial Revenue Signals Severe Transition Stress
Date : 2026-11-12
Reading : 173
HDIN Executive Takeaways
1. Wetour Robotics Limited reported FY2026 consolidated net revenues of RMB 13.34M ($1.97M), contracting 62.5% year-over-year, while promoted Orchestra OS and Vantrapower physical AI initiatives generated RMB 0 in commercial revenue.
2. Liquid cash reserves dropped 95.1% to RMB 550,569 ($81,144) against an underlying annual operational cash burn of RMB 22.65M ($3.34M), forcing an 18.1-fold share count expansion via equity facilities.
3. Strategic execution faces structural constraints from zero issued patents, the elimination of internal R&D staff, and persistent cross-border capital controls governing onshore operating assets.
Figure Wetour Robotics Limited: Core Strategic Shift Narrative Transitioning from legacy mobility aggregation toward Physical Al and Orchestra OS
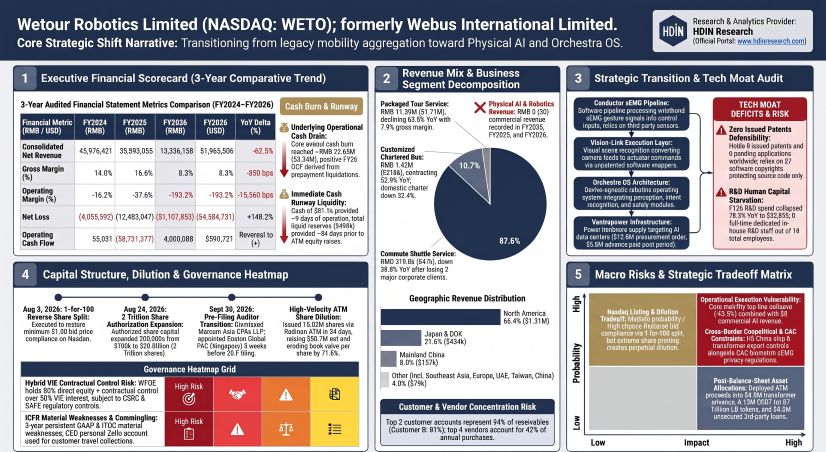
Segmental Realities, Margin Compression, and Operational Cash Burn
Wetour Robotics Limited [NASDAQ: WETO] filed its audited Form 20-F for the fiscal year ended June 30, 2026, revealing top-line contraction across legacy operations alongside zero commercial monetization in its newly adopted physical AI and robotics business lines. Consolidated net revenues dropped 62.5% year-over-year to RMB 13,336,158 ($1,965,506), compared to RMB 35,593,055 in FY2025 and RMB 45,976,421 in FY2024. The revenue decline generated negative operating leverage, compressing consolidated gross profit by 81.2% to RMB 1,108,855 ($163,425), with gross margin eroding by 830 basis points from 16.6% in FY2025 to 8.3% in FY2026.
Table Consolidated Financial Performance and Profitability Analysis, FY2024–FY2026 (RMB / USD)
Segmental revenue generation reflects total reliance on contracting legacy transportation lines:
* Packaged Tour Service: Consolidated revenue reached RMB 11,592,228 ($1,708,483), down 63.8% year-over-year, accounting for 87.0% of total revenue. Domestic services in Mainland China collapsed 92.2% to RMB 516,888 ($76,180) with a gross margin of -3.4% (down 580 bps from 2.4% in FY2025). Overseas services generated RMB 11,075,340 ($1,632,303), contracting 56.5% year-over-year, with gross margin compressing 1,190 basis points to 8.5% (down from 20.4% in FY2025).
* Customized Chartered Bus Service: Revenue totaled RMB 1,424,136 ($209,891), down 52.9% year-over-year, representing 10.7% of total revenue. Domestic bus revenue fell 32.4% to RMB 227,729 ($33,562) with a 12.2% gross margin (down 850 bps from 20.7%). Overseas chartered bus operations fell 55.5% to RMB 1,196,407 ($176,329) with an 8.5% gross margin (down 1,190 bps from 20.4%).
* Commute Shuttle Service: Revenue decreased 39.8% year-over-year to RMB 319,794 ($47,132), contributing 2.3% of total revenue. Gross margin reversed to 18.2% (up 2,860 bps from -10.4% in FY2025) following the termination of two unprofitable corporate routes.
* Physical AI Infrastructure & Orchestra OS: Recorded RMB 0 ($0) across FY2024, FY2025, and FY2026. The platform generated 0.0% commercial revenue contribution.
Table Consolidated Balance Sheet, Liquidity, and Capital Structure Analysis, FY2024–FY2026 (RMB / USD)
Operating expenses expanded 39.5% to RMB 26,884,779 ($3,962,326), driven by an administrative cost surge. General and administrative (G&A) expenses escalated 102.4% year-over-year to RMB 20,008,988 ($2,948,960), equivalent to 150.0% of total net revenues. This increase included professional service fees of RMB 14.81M (a 109.5% increase) and RMB 1.09M in share-based compensation issued to external consultants. Sales and marketing (S&M) expenses totaled RMB 6,646,082 ($979,511), representing 49.8% of total revenue. In contrast, research and development (R&D) outlays fell 78.3% to RMB 229,709 ($33,855), accounting for 1.7% of net revenues. Total R&D staff expenses fell 93.8% to RMB 52,283 ($7,706), with the remainder allocated to RMB 162,008 ($23,877) in technical service fees and RMB 15,418 ($2,272) in other operating costs.
Operational losses widened by 92.7% to RMB 25,775,924 ($3,798,901), resulting in an operating margin of -193.2%. Net loss expanded 149.2% to RMB 31,107,853 ($4,584,731), impacted by an impairment loss on long-lived assets of RMB 4,074,402 ($600,493). The impairment comprised RMB 3,798,284 on underutilized fleet vehicles and RMB 276,118 on operating lease right-of-use assets.
Table DuPont Analysis and Key Financial Return Indicators, FY2024–FY2026
Balance sheet asset quality reveals high structural exposure: 92.8% of current assets and 54.9% of total assets consist of Prepaid Expenses and Other Current Assets totaling RMB 49,371,038 ($7,276,391). Third-party receivables and prepayments represent RMB 44.06M (89.2%), prepaid service fees account for RMB 4.92M (10.0%), and deductible VAT and other receivables total RMB 0.39M (0.8%). Disclosures show several canceled vendor agreements:
* Software Development Agreement: Advanced RMB 3,200,000; contract terminated and fully refunded.
* Market Development Agreement: Advanced RMB 12,285,000; contract terminated and fully refunded.
* Electric Bus Purchase Agreement: Advanced RMB 17,909,000 ($2,500,000); contract terminated with refunds scheduled in installments using USD Coin (USDC) and Tether (USDT).
Cash flow statements show positive net operating cash flow of RMB 4,008,088 ($590,721) in FY2026, compared to negative RMB 58,731,377 in FY2025. This metric was driven by a non-recurring working capital recovery of RMB 27.26M ($4.02M) from collected prepayments and service fees. Adjusting for working capital shifts and non-cash items (depreciation and amortization of RMB 2.56M, impairment of RMB 4.07M, share-based compensation of RMB 1.09M, and crypto fair value losses of RMB 0.74M), core operations drained RMB 22,648,157 ($3,338,247) in cash.
The resulting operational burn rate of RMB 1,887,346 ($278,187) per month compares to liquid reserves as of June 30, 2026:
* Unrestricted Cash & Cash Equivalents: RMB 550,569 ($81,144), representing 0.29 months (approximately 9 days) of operational runway.
* Total Liquid Reserves: RMB 3,381,550 ($498,379), including RMB 4,029 in restricted cash, RMB 166,093 in short-term investments, and RMB 2,664,888 ($392,756) in digital assets (comprising 6.51 Bitcoins and RMB 6,771 in USDC), extending operational runway to 1.79 months (54 days).
Investing cash outflows rose 1,123.6% to RMB 12,793,832 ($1,885,578), driven by a RMB 10.98M ($1.62M) prepayment for an office purchase and renovation in Hangzhou, against capital expenditures of RMB 454,377 ($66,967). Net financing cash flows contracted 99.5% to RMB 375,651 ($55,364), as RMB 19.25M in new bank borrowing proceeds and RMB 7.09M ($1.05M) from private investment in public equity (PIPE) issuances were offset by RMB 30.0M in debt principal repayments.
Asset Infrastructure, Hybrid VIE Control Architecture, and Operational Concentration
The physical and legal architecture of Wetour Robotics Limited operates across multiple jurisdictions governed by United Nations territorial guidelines. Physical infrastructure comprises leased corporate facilities and fleet equipment:
* Global Executive Headquarters: Leased facility at 3300 N Interstate 35, Ste 700, Room 7003, Austin, Texas 78705, USA (approximately 700 sq. ft.), with lease expiration scheduled for January 27, 2027.
* Asia-Pacific Operating Center: Leased premises of 127.81 square meters located in Hangzhou, Zhejiang Province, Mainland China, with lease expiration on December 15, 2027.
* VIE Real Estate Hub: Zhejiang Youba Technology Co., Ltd. holds a 172.3 square meter commercial office and parking facility in Hangzhou, Mainland China. The property is subject to an RMB 18.08M acquisition and renovation agreement, under which RMB 10.98M was prepaid through June 30, 2026, with the remaining RMB 6.42M disbursed post-period ahead of a targeted March 31, 2027 completion date.
* Vehicle Fleet: Net property and equipment stood at RMB 25,764,787 ($3,797,260) as of June 30, 2026, with vehicles owned by the VIE accounting for RMB 25.12M.
Human capital contracted to 18 full-time personnel across five operating units: Sales & Marketing (6 employees; 33.3%), Finance & Accounting (5 employees; 27.8%), Management & Administration (4 employees; 22.2%), Customer Service (3 employees; 16.7%), and Dedicated In-House R&D (0 employees; 0.0%).
Table Geographic Revenue Breakdown by Service Location, FY2024–FY2026 (RMB / USD)
The customer base shows trade credit concentration: total accounts receivable of RMB 90,877 ($13,394) is 94% concentrated across two clients: Customer B represents 81% (RMB 73,822 / $10,886) and Customer A represents 13% (RMB 11,765 / $1,735). Procurement exposes vendor concentration: 42% of total purchases were sourced from four vendors in FY2026: Supplier E (11%; RMB 1,330,902 / $196,254), Supplier F (11%; RMB 1,303,199 / $192,168), Supplier G (10%; RMB 1,177,328 / $173,608), and Supplier H (10%; RMB 1,163,016 / $171,497). Accounts payable obligations of RMB 39,762 ($5,860) are 70% concentrated across three creditors: Supplier C (43%; RMB 17,097), Supplier A (16%; RMB 6,200), and Supplier D (11%; RMB 4,400).
On November 5, 2025, the group reorganized assets by transferring 100% equity of Hangzhou Webus Travel Agency Co., Ltd. from the VIE to wholly owned subsidiary Hangzhou Shunxing Technology Co., Ltd. for RMB 1 nominal consideration. The remaining onshore mobility operations rely on a hybrid control structure executed September 7, 2022: WFOE Zhejiang Xinjieni Technology Co., Ltd. directly holds 50% equity in Zhejiang Youba Technology Co., Ltd., with the remaining 50% equity (held by Chairman Zheng Jiahua at 45.56% and Wu Chunyun at 4.44%) controlled via contractual agreements:
* Exclusive Business Cooperation Agreement: Allocates 100% of pre-tax profit from the VIE to the WFOE via service fees.
* Exclusive Call Option and Assets Option Agreements: Grant WFOE options to acquire individual equity and assets at minimum allowable valuations.
* Share Pledge Agreement and Irrevocable Power of Attorney: Secure first-priority equity pledges alongside full corporate proxy control.
* Spousal Consents: Execute complete waivers of equity rights from shareholder spouses.
Onshore cash is subject to State Administration of Foreign Exchange (SAFE) controls and PRC Company Law statutory reserve rules, which mandate allocating 10% of annual after-tax net profit to a non-distributable general reserve until it reaches 50% of registered capital. As of June 30, 2026, restricted net assets across PRC entities totaled RMB 18,449,981 (20.3% of consolidated net assets). No dividends were remitted to the Cayman parent between FY2024 and FY2026. Mainland China subsidiaries hold bank borrowings of RMB 21,450,000 ($3,161,339) against domestic collateral, while the Cayman parent held RMB 262 ($39) in liquid cash against current liabilities of RMB 4.72M ($695k) as of June 30, 2026.
Corporate governance disclosures show non-arm's-length arrangements, persistent control deficiencies, and auditor turnover:
* Auditor Dismissal: On September 30, 2026, the Audit Committee dismissed Marcum Asia CPAs LLP and appointed Singapore-based Edston Global PAC, which completed the audit on November 5, 2026.
* Internal Controls (ICFR): Management and independent auditors reported two material weaknesses across FY2024, FY2025, and FY2026: (i) insufficient technical accounting personnel conversant in U.S. GAAP and SEC rules, and (ii) inadequate IT general controls (ITGC) covering system access security, change protocols, and cybersecurity monitoring.
* Personal Payment Accounts: Travel bookings were collected directly into an individual Zelle account held by CEO Zheng Nan, processing RMB 111,341 in FY2024, RMB 191,820 in FY2025, and RMB 96,230 in FY2026. Unremitted collections due from Zheng Nan totaled RMB 37,487 at fiscal year-end.
* Related-Party Transactions: In FY2026, the company paid RMB 708,787 ($98k) in marketing fees to Chongqing Zijing Huangcheng International Co., Ltd. Hangzhou Branch (controlled by CEO Zheng Nan's immediate family) and extended an intercompany loan of RMB 200,000 to the entity (maturing October 30, 2027), generating RMB 4,000 in interest income. Related-party balances due from this entity stood at RMB 302,805 on June 30, 2026. Circular loans involved Chairman Zheng Jiahua (RMB 3.03M) and CEO Zheng Nan (RMB 6.30M) in FY2025. In FY2026, Zheng Nan extended RMB 1.32M in advances, with RMB 70,000 due to him at year-end.
* Personal Debt Pledges: Subsidiary Youba Tech's RMB 20.0M bank facility with Hangzhou United Bank was collateralized by commercial real estate owned by CEO Zheng Nan valued at RMB 50,000,000, supported by personal guarantees from Chairman Zheng Jiahua and spouse Yang Ying.
HDIN Institutional Verdict: Capital Engineering, ATM Dilution, and Governance Risks
Wetour Robotics Limited presents an operational contradiction: corporate communications emphasize deep-tech physical AI solutions, while verified financial filings show an asset-light consumer travel agency experiencing top-line contraction and scaling up share issuances.
To maintain exchange listing compliance, the company executed a sequence of equity adjustments:
* Nasdaq Minimum Bid Deficiency: On December 30, 2025, Nasdaq notified the company of bid price non-compliance under Listing Rule 5550(a)(2) after 30 consecutive business days below $1.00. Compliance was temporarily confirmed June 23, 2026. On August 3, 2026, the board executed a 1-for-100 reverse share split, consolidating 100 shares ($0.0001 par) into one share ($0.01 par) to support the bid price.
* Historical Capital Realignments: Pre-IPO actions on October 31, 2024, repurchased 150,000 shares (43% of total equity) to set a 200,000 share base. The February 28, 2025 IPO issued 20,000 shares at $400 post-split ($4.00 pre-split), raising RMB 48.99M net ($8.0M gross) with 140,000 underwriter warrants at a $500 strike price. On March 2, 2026, a Regulation S PIPE issued 600,000 shares at $8.60 (raising RMB 35.46M / $5.16M gross), diluting existing holders by 73.2%. On August 11, 2026, a second PIPE issued 2,000,000 shares at $0.90 ($1.80M gross / RMB 12.2M), with Chairman Zheng Jiahua subscribing for 500,000 shares ($450k).
* Expansion of Share Capital: On August 24, 2026, an Extraordinary General Meeting expanded authorized share capital from $100,000 (10,000,000 shares) to $20,000,000,000, creating 2 Trillion authorized ordinary shares. Concurrently, the Second Amended and Restated Memorandum and Articles of Association reduced the shareholder written resolution threshold from unanimous consent to a simple majority, lowering minority shareholder protections under Cayman Islands law.
* At-The-Market Facilities: An initial ATM facility with Chaince Securities LLC (established May 15, 2026 for $17.0M and raised to $50.0M on July 6, 2026) issued 256,066 shares for $2,290,279 gross before termination on August 19, 2026. On August 26, 2026, Wetour executed a sales agreement with Rodman & Renshaw LLC for up to $75.0 million. Between August 27 and September 30, 2026 (a 34-day span), the company issued 13,820,198 ordinary shares, realizing $46.4 million in gross proceeds ($36.7 million net). The offering was paused on October 15, 2026.
* Dilution Impact: Total issued shares grew from 821,300 on June 30, 2026, to 14,897,999 on November 5, 2026 (an 18.1-fold expansion). Estimated book value per share dropped 71.9%, moving from $10.89 (RMB 73.88) to approximately $3.06. Beneficially owned insider equity compressed to 1.094%: Chairman Zheng Jiahua holds 81,516 shares (0.547%) and CEO Zheng Nan holds 81,480 shares (0.547%).
Capital deployments executed after June 30, 2026, show diversification away from core travel operations:
* Transformer Sourcing Agreement: On September 7, 2026, subsidiary Vantrapower LLC contracted to acquire two high-capacity power transformers for $12.0 million (~RMB 81.3M), disbursing an $8.0 million advance payment (~RMB 54.2M). The remaining $4.0 million is payable upon factory acceptance testing and shipment.
* Cryptocurrency Purchases: On August 25, 2026, the company deployed 6,127,902 USDT (comprising 5,127,902 USDT from a third-party wallet and 1,000,000 USDT returned from the canceled electric bus vendor) to acquire 87 trillion LB tokens.
* Unsecured Lending: On August 31, 2026, the company extended two 6-month loans totaling $4.0 million ($2.0 million each) to two third-party entities at a 6% annual interest rate.
* Credit Facilities: In August 2026, onshore operating subsidiary Youba Tech refinanced bank debts by drawing RMB 13.7M in credit facilities (RMB 1.2M and RMB 3.0M at 3.65% from Zhejiang Hangzhou Rural Commercial Bank, and RMB 9.5M at 3.45% from Hangzhou United Rural Commercial Bank).
Technological positioning faces significant verification gaps. Promoted platforms—comprising the Conductor surface electromyography (sEMG) gesture translation engine, Vision-Link visual recognition layer, and Orchestra OS device control platform—carry zero capitalized software asset value on the balance sheet. Wetour holds zero registered patents worldwide, relying instead on 37 software copyrights in Mainland China, 27 registered trademarks (26 in Mainland China, one with the USPTO), and four domain names (wetourglobal.com, wetour.vip, weixiaoba.vip, ubus.vip). The operating model is completely fabless, leaving wearable sEMG hardware, edge processors, and Vantrapower transformer equipment dependent on third-party ODMs and OEMs. Item 3 disclosures clarify that pilot demonstrations and early access evaluations establish no binding commercial sales commitments.
Institutional assessment concludes that Wetour Robotics Limited's financial durability remains reliant on capital markets activity rather than commercial operating returns. With legacy mobility operations generating net losses of RMB 31.11M ($4.58M) and physical AI generating zero revenue, capital deployments into hardware transformers, unsecured third-party lending, and digital tokens introduce execution risks that warrant institutional monitoring.
Presentation Download & Video Access
* Presentation Download: Click the PDF download link under 'Related Topics' to access the full institutional presentation of this report.
* Video Link: Click this link to watch the HDIN analyst briefing on YouTube.
About HDIN Research
HDIN Research is a global market intelligence and strategic advisory firm specializing in institutional-grade financial analysis, supply chain audits, and macroeconomic forecasting. Our dedicated sector analysts deliver actionable, data-driven insights tailored for private equity, hedge funds, and corporate strategy teams. Visit us at http://www.hdinresearch.com.
2026 AI Transparency Footer
This intelligence report was authored by HDIN Research analysts following an audit of official corporate filings. AI was utilized for scale data synthesis and structural drafting, ensuring inclusion of reported data points. All strategic insights, financial modeling, and final verdicts were verified by our editorial board to ensure professional accuracy and compliance with 2026 Google Search E-E-A-T standards.
1. Wetour Robotics Limited reported FY2026 consolidated net revenues of RMB 13.34M ($1.97M), contracting 62.5% year-over-year, while promoted Orchestra OS and Vantrapower physical AI initiatives generated RMB 0 in commercial revenue.
2. Liquid cash reserves dropped 95.1% to RMB 550,569 ($81,144) against an underlying annual operational cash burn of RMB 22.65M ($3.34M), forcing an 18.1-fold share count expansion via equity facilities.
3. Strategic execution faces structural constraints from zero issued patents, the elimination of internal R&D staff, and persistent cross-border capital controls governing onshore operating assets.
Figure Wetour Robotics Limited: Core Strategic Shift Narrative Transitioning from legacy mobility aggregation toward Physical Al and Orchestra OS
Segmental Realities, Margin Compression, and Operational Cash Burn
Wetour Robotics Limited [NASDAQ: WETO] filed its audited Form 20-F for the fiscal year ended June 30, 2026, revealing top-line contraction across legacy operations alongside zero commercial monetization in its newly adopted physical AI and robotics business lines. Consolidated net revenues dropped 62.5% year-over-year to RMB 13,336,158 ($1,965,506), compared to RMB 35,593,055 in FY2025 and RMB 45,976,421 in FY2024. The revenue decline generated negative operating leverage, compressing consolidated gross profit by 81.2% to RMB 1,108,855 ($163,425), with gross margin eroding by 830 basis points from 16.6% in FY2025 to 8.3% in FY2026.
Table Consolidated Financial Performance and Profitability Analysis, FY2024–FY2026 (RMB / USD)
| Consolidated Financial Performance Metric (RMB / USD) | FY2024 (RMB) | FY2025 (RMB) | FY2026 (RMB) | FY2026 (USD) | YoY Change (FY25–FY26) |
| Consolidated Revenues | 45,976,421 | 35,593,055 | 13,336,158 | $1,965,506 | -62.5% |
| Cost of Revenues | (39,546,098) | (29,692,707) | (12,227,303) | ($1,802,081) | -58.8% |
| Gross Profit | 6,430,323 | 5,900,348 | 1,108,855 | $163,425 | -81.2% |
| Gross Margin (%) | 14.0% | 16.6% | 8.3% | 8.3% | -830 bps |
| Sales & Marketing Expenses | (7,468,321) | (8,333,493) | (6,646,082) | ($979,511) | -20.2% |
| General & Administrative Expenses | (5,098,450) | (9,883,761) | (20,008,988) | ($2,948,960) | +102.4% |
| Research & Development Expenses | (1,331,037) | (1,056,335) | (229,709) | ($33,855) | -78.3% |
| Total Operating Expenses | (13,897,808) | (19,273,589) | (26,884,779) | ($3,962,326) | +39.5% |
| Operating Loss | (7,467,485) | (13,373,241) | (25,775,924) | ($3,798,901) | +92.7% |
| Impairment Loss on Long-lived Assets | — | — | (4,074,402) | ($600,493) | N/A |
| Financial Expenses, net | (1,134,713) | (1,161,392) | (1,521,305) | ($224,213) | +31.0% |
| Net Loss | (4,055,592) | (12,483,047) | (31,107,853) | ($4,584,731) | +149.2% |
Segmental revenue generation reflects total reliance on contracting legacy transportation lines:
* Packaged Tour Service: Consolidated revenue reached RMB 11,592,228 ($1,708,483), down 63.8% year-over-year, accounting for 87.0% of total revenue. Domestic services in Mainland China collapsed 92.2% to RMB 516,888 ($76,180) with a gross margin of -3.4% (down 580 bps from 2.4% in FY2025). Overseas services generated RMB 11,075,340 ($1,632,303), contracting 56.5% year-over-year, with gross margin compressing 1,190 basis points to 8.5% (down from 20.4% in FY2025).
* Customized Chartered Bus Service: Revenue totaled RMB 1,424,136 ($209,891), down 52.9% year-over-year, representing 10.7% of total revenue. Domestic bus revenue fell 32.4% to RMB 227,729 ($33,562) with a 12.2% gross margin (down 850 bps from 20.7%). Overseas chartered bus operations fell 55.5% to RMB 1,196,407 ($176,329) with an 8.5% gross margin (down 1,190 bps from 20.4%).
* Commute Shuttle Service: Revenue decreased 39.8% year-over-year to RMB 319,794 ($47,132), contributing 2.3% of total revenue. Gross margin reversed to 18.2% (up 2,860 bps from -10.4% in FY2025) following the termination of two unprofitable corporate routes.
* Physical AI Infrastructure & Orchestra OS: Recorded RMB 0 ($0) across FY2024, FY2025, and FY2026. The platform generated 0.0% commercial revenue contribution.
Table Consolidated Balance Sheet, Liquidity, and Capital Structure Analysis, FY2024–FY2026 (RMB / USD)
| Operating & Balance Sheet Metrics (RMB / USD) | FY2024 (RMB) | FY2025 (RMB) | FY2026 (RMB) | FY2026 (USD) | YoY Change (FY25–FY26) |
| Cash and Cash Equivalents | 2,780,907 | 11,351,952 | 550,569 | $81,144 | -95.1% |
| Restricted Cash | — | — | 4,029 | $594 | N/A |
| Short-term Marketable Investments | — | 860,484 | 166,093 | $24,479 | -80.7% |
| Crypto Assets & Stablecoins | — | — | 2,664,888 | $392,756 | N/A |
| Accounts Receivable, net | 588,929 | 359,247 | 90,877 | $13,394 | -74.7% |
| Prepaid Expenses & Other Current Assets | 307,294 | 44,075,847 | 49,371,038 | $7,276,391 | +12.0% |
| Total Current Assets | 2,151,180 | 56,927,375 | 53,187,786 | $7,838,911 | -6.6% |
| Property & Equipment, net | — | 31,511,097 | 25,764,787 | $3,797,260 | -18.2% |
| Total Assets | — | 93,595,952 | 89,933,178 | $13,254,512 | -3.9% |
| Short-term Bank Debt / Borrowings | 10,000,000 | 30,000,000 | 21,450,000 | $3,161,339 | -28.5% |
| Total Current Liabilities | — | 34,293,365 | 29,135,111 | $4,293,986 | -15.0% |
| Working Capital | (2,151,180) | 22,634,010 | 24,052,675 | $3,544,925 | +6.3% |
| Total Shareholders' Equity | 27,807,737 | 56,822,587 | 60,714,734 | $8,948,244 | +6.9% |
Operating expenses expanded 39.5% to RMB 26,884,779 ($3,962,326), driven by an administrative cost surge. General and administrative (G&A) expenses escalated 102.4% year-over-year to RMB 20,008,988 ($2,948,960), equivalent to 150.0% of total net revenues. This increase included professional service fees of RMB 14.81M (a 109.5% increase) and RMB 1.09M in share-based compensation issued to external consultants. Sales and marketing (S&M) expenses totaled RMB 6,646,082 ($979,511), representing 49.8% of total revenue. In contrast, research and development (R&D) outlays fell 78.3% to RMB 229,709 ($33,855), accounting for 1.7% of net revenues. Total R&D staff expenses fell 93.8% to RMB 52,283 ($7,706), with the remainder allocated to RMB 162,008 ($23,877) in technical service fees and RMB 15,418 ($2,272) in other operating costs.
Operational losses widened by 92.7% to RMB 25,775,924 ($3,798,901), resulting in an operating margin of -193.2%. Net loss expanded 149.2% to RMB 31,107,853 ($4,584,731), impacted by an impairment loss on long-lived assets of RMB 4,074,402 ($600,493). The impairment comprised RMB 3,798,284 on underutilized fleet vehicles and RMB 276,118 on operating lease right-of-use assets.
Table DuPont Analysis and Key Financial Return Indicators, FY2024–FY2026
| DuPont Analysis & Core Return Indicators | FY2024 | FY2025 | FY2026 | Multi-Year Variance |
| Net Profit Margin (%) | -8.8% | -35.1% | -233.2% | -22,440 bps |
| Asset Turnover (x) | 0.49x | 0.38x | 0.15x | -0.34x |
| Financial Leverage Multiplier (x) | 3.37x | 1.65x | 1.48x | -1.89x |
| Return on Equity (ROE %) | -13.6% | -29.5% | -52.9% | -3,930 bps |
| Return on Assets (ROA %) | -4.3% | -13.3% | -33.9% | -2,960 bps |
Balance sheet asset quality reveals high structural exposure: 92.8% of current assets and 54.9% of total assets consist of Prepaid Expenses and Other Current Assets totaling RMB 49,371,038 ($7,276,391). Third-party receivables and prepayments represent RMB 44.06M (89.2%), prepaid service fees account for RMB 4.92M (10.0%), and deductible VAT and other receivables total RMB 0.39M (0.8%). Disclosures show several canceled vendor agreements:
* Software Development Agreement: Advanced RMB 3,200,000; contract terminated and fully refunded.
* Market Development Agreement: Advanced RMB 12,285,000; contract terminated and fully refunded.
* Electric Bus Purchase Agreement: Advanced RMB 17,909,000 ($2,500,000); contract terminated with refunds scheduled in installments using USD Coin (USDC) and Tether (USDT).
Cash flow statements show positive net operating cash flow of RMB 4,008,088 ($590,721) in FY2026, compared to negative RMB 58,731,377 in FY2025. This metric was driven by a non-recurring working capital recovery of RMB 27.26M ($4.02M) from collected prepayments and service fees. Adjusting for working capital shifts and non-cash items (depreciation and amortization of RMB 2.56M, impairment of RMB 4.07M, share-based compensation of RMB 1.09M, and crypto fair value losses of RMB 0.74M), core operations drained RMB 22,648,157 ($3,338,247) in cash.
The resulting operational burn rate of RMB 1,887,346 ($278,187) per month compares to liquid reserves as of June 30, 2026:
* Unrestricted Cash & Cash Equivalents: RMB 550,569 ($81,144), representing 0.29 months (approximately 9 days) of operational runway.
* Total Liquid Reserves: RMB 3,381,550 ($498,379), including RMB 4,029 in restricted cash, RMB 166,093 in short-term investments, and RMB 2,664,888 ($392,756) in digital assets (comprising 6.51 Bitcoins and RMB 6,771 in USDC), extending operational runway to 1.79 months (54 days).
Investing cash outflows rose 1,123.6% to RMB 12,793,832 ($1,885,578), driven by a RMB 10.98M ($1.62M) prepayment for an office purchase and renovation in Hangzhou, against capital expenditures of RMB 454,377 ($66,967). Net financing cash flows contracted 99.5% to RMB 375,651 ($55,364), as RMB 19.25M in new bank borrowing proceeds and RMB 7.09M ($1.05M) from private investment in public equity (PIPE) issuances were offset by RMB 30.0M in debt principal repayments.
Asset Infrastructure, Hybrid VIE Control Architecture, and Operational Concentration
The physical and legal architecture of Wetour Robotics Limited operates across multiple jurisdictions governed by United Nations territorial guidelines. Physical infrastructure comprises leased corporate facilities and fleet equipment:
* Global Executive Headquarters: Leased facility at 3300 N Interstate 35, Ste 700, Room 7003, Austin, Texas 78705, USA (approximately 700 sq. ft.), with lease expiration scheduled for January 27, 2027.
* Asia-Pacific Operating Center: Leased premises of 127.81 square meters located in Hangzhou, Zhejiang Province, Mainland China, with lease expiration on December 15, 2027.
* VIE Real Estate Hub: Zhejiang Youba Technology Co., Ltd. holds a 172.3 square meter commercial office and parking facility in Hangzhou, Mainland China. The property is subject to an RMB 18.08M acquisition and renovation agreement, under which RMB 10.98M was prepaid through June 30, 2026, with the remaining RMB 6.42M disbursed post-period ahead of a targeted March 31, 2027 completion date.
* Vehicle Fleet: Net property and equipment stood at RMB 25,764,787 ($3,797,260) as of June 30, 2026, with vehicles owned by the VIE accounting for RMB 25.12M.
Human capital contracted to 18 full-time personnel across five operating units: Sales & Marketing (6 employees; 33.3%), Finance & Accounting (5 employees; 27.8%), Management & Administration (4 employees; 22.2%), Customer Service (3 employees; 16.7%), and Dedicated In-House R&D (0 employees; 0.0%).
Table Geographic Revenue Breakdown by Service Location, FY2024–FY2026 (RMB / USD)
| Geographic Revenue Breakdown (by Service Location) | FY2024 (RMB) | FY2025 (RMB) | FY2026 (RMB) | FY2026 (USD) | FY26 Mix (%) | YoY Growth (%) |
| North America | 25,689,032 | 19,663,963 | 8,857,412 | $1,306,128 | 66.4% | -55.0% |
| Japan and Republic of Korea | 5,298,445 | 6,556,006 | 2,875,304 | $423,991 | 21.6% | -56.1% |
| Mainland China | 12,758,034 | 7,474,699 | 1,064,411 | $156,960 | 8.0% | -85.8% |
| Other (Southeast Asia, Europe, UAE) | 2,230,910 | 1,898,387 | 539,031 | $79,486 | 4.0% | -71.6% |
| Consolidated Total | 45,976,421 | 35,593,055 | 13,336,158 | $1,965,506 | 100.0% | -62.5% |
The customer base shows trade credit concentration: total accounts receivable of RMB 90,877 ($13,394) is 94% concentrated across two clients: Customer B represents 81% (RMB 73,822 / $10,886) and Customer A represents 13% (RMB 11,765 / $1,735). Procurement exposes vendor concentration: 42% of total purchases were sourced from four vendors in FY2026: Supplier E (11%; RMB 1,330,902 / $196,254), Supplier F (11%; RMB 1,303,199 / $192,168), Supplier G (10%; RMB 1,177,328 / $173,608), and Supplier H (10%; RMB 1,163,016 / $171,497). Accounts payable obligations of RMB 39,762 ($5,860) are 70% concentrated across three creditors: Supplier C (43%; RMB 17,097), Supplier A (16%; RMB 6,200), and Supplier D (11%; RMB 4,400).
On November 5, 2025, the group reorganized assets by transferring 100% equity of Hangzhou Webus Travel Agency Co., Ltd. from the VIE to wholly owned subsidiary Hangzhou Shunxing Technology Co., Ltd. for RMB 1 nominal consideration. The remaining onshore mobility operations rely on a hybrid control structure executed September 7, 2022: WFOE Zhejiang Xinjieni Technology Co., Ltd. directly holds 50% equity in Zhejiang Youba Technology Co., Ltd., with the remaining 50% equity (held by Chairman Zheng Jiahua at 45.56% and Wu Chunyun at 4.44%) controlled via contractual agreements:
* Exclusive Business Cooperation Agreement: Allocates 100% of pre-tax profit from the VIE to the WFOE via service fees.
* Exclusive Call Option and Assets Option Agreements: Grant WFOE options to acquire individual equity and assets at minimum allowable valuations.
* Share Pledge Agreement and Irrevocable Power of Attorney: Secure first-priority equity pledges alongside full corporate proxy control.
* Spousal Consents: Execute complete waivers of equity rights from shareholder spouses.
Onshore cash is subject to State Administration of Foreign Exchange (SAFE) controls and PRC Company Law statutory reserve rules, which mandate allocating 10% of annual after-tax net profit to a non-distributable general reserve until it reaches 50% of registered capital. As of June 30, 2026, restricted net assets across PRC entities totaled RMB 18,449,981 (20.3% of consolidated net assets). No dividends were remitted to the Cayman parent between FY2024 and FY2026. Mainland China subsidiaries hold bank borrowings of RMB 21,450,000 ($3,161,339) against domestic collateral, while the Cayman parent held RMB 262 ($39) in liquid cash against current liabilities of RMB 4.72M ($695k) as of June 30, 2026.
Corporate governance disclosures show non-arm's-length arrangements, persistent control deficiencies, and auditor turnover:
* Auditor Dismissal: On September 30, 2026, the Audit Committee dismissed Marcum Asia CPAs LLP and appointed Singapore-based Edston Global PAC, which completed the audit on November 5, 2026.
* Internal Controls (ICFR): Management and independent auditors reported two material weaknesses across FY2024, FY2025, and FY2026: (i) insufficient technical accounting personnel conversant in U.S. GAAP and SEC rules, and (ii) inadequate IT general controls (ITGC) covering system access security, change protocols, and cybersecurity monitoring.
* Personal Payment Accounts: Travel bookings were collected directly into an individual Zelle account held by CEO Zheng Nan, processing RMB 111,341 in FY2024, RMB 191,820 in FY2025, and RMB 96,230 in FY2026. Unremitted collections due from Zheng Nan totaled RMB 37,487 at fiscal year-end.
* Related-Party Transactions: In FY2026, the company paid RMB 708,787 ($98k) in marketing fees to Chongqing Zijing Huangcheng International Co., Ltd. Hangzhou Branch (controlled by CEO Zheng Nan's immediate family) and extended an intercompany loan of RMB 200,000 to the entity (maturing October 30, 2027), generating RMB 4,000 in interest income. Related-party balances due from this entity stood at RMB 302,805 on June 30, 2026. Circular loans involved Chairman Zheng Jiahua (RMB 3.03M) and CEO Zheng Nan (RMB 6.30M) in FY2025. In FY2026, Zheng Nan extended RMB 1.32M in advances, with RMB 70,000 due to him at year-end.
* Personal Debt Pledges: Subsidiary Youba Tech's RMB 20.0M bank facility with Hangzhou United Bank was collateralized by commercial real estate owned by CEO Zheng Nan valued at RMB 50,000,000, supported by personal guarantees from Chairman Zheng Jiahua and spouse Yang Ying.
HDIN Institutional Verdict: Capital Engineering, ATM Dilution, and Governance Risks
Wetour Robotics Limited presents an operational contradiction: corporate communications emphasize deep-tech physical AI solutions, while verified financial filings show an asset-light consumer travel agency experiencing top-line contraction and scaling up share issuances.
To maintain exchange listing compliance, the company executed a sequence of equity adjustments:
* Nasdaq Minimum Bid Deficiency: On December 30, 2025, Nasdaq notified the company of bid price non-compliance under Listing Rule 5550(a)(2) after 30 consecutive business days below $1.00. Compliance was temporarily confirmed June 23, 2026. On August 3, 2026, the board executed a 1-for-100 reverse share split, consolidating 100 shares ($0.0001 par) into one share ($0.01 par) to support the bid price.
* Historical Capital Realignments: Pre-IPO actions on October 31, 2024, repurchased 150,000 shares (43% of total equity) to set a 200,000 share base. The February 28, 2025 IPO issued 20,000 shares at $400 post-split ($4.00 pre-split), raising RMB 48.99M net ($8.0M gross) with 140,000 underwriter warrants at a $500 strike price. On March 2, 2026, a Regulation S PIPE issued 600,000 shares at $8.60 (raising RMB 35.46M / $5.16M gross), diluting existing holders by 73.2%. On August 11, 2026, a second PIPE issued 2,000,000 shares at $0.90 ($1.80M gross / RMB 12.2M), with Chairman Zheng Jiahua subscribing for 500,000 shares ($450k).
* Expansion of Share Capital: On August 24, 2026, an Extraordinary General Meeting expanded authorized share capital from $100,000 (10,000,000 shares) to $20,000,000,000, creating 2 Trillion authorized ordinary shares. Concurrently, the Second Amended and Restated Memorandum and Articles of Association reduced the shareholder written resolution threshold from unanimous consent to a simple majority, lowering minority shareholder protections under Cayman Islands law.
* At-The-Market Facilities: An initial ATM facility with Chaince Securities LLC (established May 15, 2026 for $17.0M and raised to $50.0M on July 6, 2026) issued 256,066 shares for $2,290,279 gross before termination on August 19, 2026. On August 26, 2026, Wetour executed a sales agreement with Rodman & Renshaw LLC for up to $75.0 million. Between August 27 and September 30, 2026 (a 34-day span), the company issued 13,820,198 ordinary shares, realizing $46.4 million in gross proceeds ($36.7 million net). The offering was paused on October 15, 2026.
* Dilution Impact: Total issued shares grew from 821,300 on June 30, 2026, to 14,897,999 on November 5, 2026 (an 18.1-fold expansion). Estimated book value per share dropped 71.9%, moving from $10.89 (RMB 73.88) to approximately $3.06. Beneficially owned insider equity compressed to 1.094%: Chairman Zheng Jiahua holds 81,516 shares (0.547%) and CEO Zheng Nan holds 81,480 shares (0.547%).
Capital deployments executed after June 30, 2026, show diversification away from core travel operations:
* Transformer Sourcing Agreement: On September 7, 2026, subsidiary Vantrapower LLC contracted to acquire two high-capacity power transformers for $12.0 million (~RMB 81.3M), disbursing an $8.0 million advance payment (~RMB 54.2M). The remaining $4.0 million is payable upon factory acceptance testing and shipment.
* Cryptocurrency Purchases: On August 25, 2026, the company deployed 6,127,902 USDT (comprising 5,127,902 USDT from a third-party wallet and 1,000,000 USDT returned from the canceled electric bus vendor) to acquire 87 trillion LB tokens.
* Unsecured Lending: On August 31, 2026, the company extended two 6-month loans totaling $4.0 million ($2.0 million each) to two third-party entities at a 6% annual interest rate.
* Credit Facilities: In August 2026, onshore operating subsidiary Youba Tech refinanced bank debts by drawing RMB 13.7M in credit facilities (RMB 1.2M and RMB 3.0M at 3.65% from Zhejiang Hangzhou Rural Commercial Bank, and RMB 9.5M at 3.45% from Hangzhou United Rural Commercial Bank).
Technological positioning faces significant verification gaps. Promoted platforms—comprising the Conductor surface electromyography (sEMG) gesture translation engine, Vision-Link visual recognition layer, and Orchestra OS device control platform—carry zero capitalized software asset value on the balance sheet. Wetour holds zero registered patents worldwide, relying instead on 37 software copyrights in Mainland China, 27 registered trademarks (26 in Mainland China, one with the USPTO), and four domain names (wetourglobal.com, wetour.vip, weixiaoba.vip, ubus.vip). The operating model is completely fabless, leaving wearable sEMG hardware, edge processors, and Vantrapower transformer equipment dependent on third-party ODMs and OEMs. Item 3 disclosures clarify that pilot demonstrations and early access evaluations establish no binding commercial sales commitments.
Institutional assessment concludes that Wetour Robotics Limited's financial durability remains reliant on capital markets activity rather than commercial operating returns. With legacy mobility operations generating net losses of RMB 31.11M ($4.58M) and physical AI generating zero revenue, capital deployments into hardware transformers, unsecured third-party lending, and digital tokens introduce execution risks that warrant institutional monitoring.
Presentation Download & Video Access
* Presentation Download: Click the PDF download link under 'Related Topics' to access the full institutional presentation of this report.
* Video Link: Click this link to watch the HDIN analyst briefing on YouTube.
About HDIN Research
HDIN Research is a global market intelligence and strategic advisory firm specializing in institutional-grade financial analysis, supply chain audits, and macroeconomic forecasting. Our dedicated sector analysts deliver actionable, data-driven insights tailored for private equity, hedge funds, and corporate strategy teams. Visit us at http://www.hdinresearch.com.
2026 AI Transparency Footer
This intelligence report was authored by HDIN Research analysts following an audit of official corporate filings. AI was utilized for scale data synthesis and structural drafting, ensuring inclusion of reported data points. All strategic insights, financial modeling, and final verdicts were verified by our editorial board to ensure professional accuracy and compliance with 2026 Google Search E-E-A-T standards.