Visa Inc.: Scaling Value-Added Services and Retrospective Legal Ring-Fencing as Client Incentives Hit 28.52% of Gross Revenue
1. Visa Inc. generated $45,903 million in FY2026 GAAP Net Revenue (+14.8% YoY) and $22,057 million in Free Cash Flow, counterbalancing an expansion in Client Incentives to $18,317 million (28.52% of Gross Revenue; 11.94 bps of Payments Volume).
2. Operational infrastructure spanning regional hubs in Singapore and London absorbed $293 million in OECD Pillar Two top-up provisions, neutralized through U.S. foreign tax credits, while backing $168.6 billion in peak daily settlement exposure.
3. Retrospective responsibility plans insulated Class A common earnings from $3,642 million in net merchant litigation disbursements, though unresolved opt-out exposure of $15.9 billion and U.S. Department of Justice debit monopolization proceedings present sustained structural scrutiny.
Figure Visa Inc FY2026 Financial & Strategic Architecture Executive Forensic Blueprint
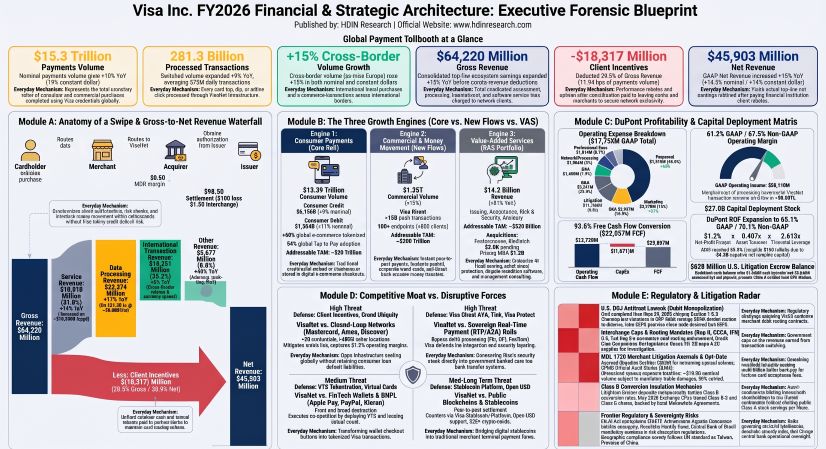
Segmental Realities, Revenue Architecture, and Incentive Intensity
Visa Inc. [NYSE: V] expanded its operational throughput across physical and digital payment rails during the fiscal year ended September 30, 2026, processing $15,338 billion in nominal payments volume (+10.3% YoY nominal; +9.0% constant-dollar) and 281,331 million processed transactions (+9.2% YoY). Across its broader ecosystem, total nominal volume—incorporating $2,582 billion in cash access transactions (+3.7% nominal; +1.0% constant)—reached $17,920 billion (+9.3% nominal; +8.0% constant), representing 355 billion total branded system transactions (+5.7% YoY) across more than 5 billion issued credentials and over 400 million merchant acceptance locations.
Gross revenue expanded 15.2% YoY to $64,220 million, offset by $18,317 million in client incentives recognized as contra-revenue deductions (+16.3% YoY), yielding consolidated GAAP Net Revenue of $45,903 million (+14.8% YoY nominal; +14% constant-dollar). Incentive intensity—the proportion of gross revenue surrendered to issuing banks, acquirers, and co-brand partners—rose 27 basis points (bps) to 28.52% (up from 28.25% in FY2025 and 27.70% in FY2024), equivalent to 39.9% when evaluated as a direct contra-revenue deduction against gross streams, or 11.94 bps of total payments volume (up from 11.33 bps in FY2025 and 10.60 bps in FY2024).
Table VISA INC. GROSS-TO-NET REVENUE WATERFALL & UNIT METRICS (FY24–FY26)
|
Financial Line Item ($ in millions) |
FY2024 |
FY2025 |
FY2026 |
YoY Growth (FY2025) |
YoY Growth (FY2026) |
|---|---|---|---|---|---|
|
Service Revenue |
$16,114 |
$17,539 |
$19,918 |
+8.8% |
+13.6% |
|
Data Processing Revenue |
$17,714 |
$19,993 |
$23,374 |
+12.9% |
+16.9% |
|
International Transaction Revenue |
$12,665 |
$14,166 |
$15,251 |
+11.9% |
+7.7% |
|
Other Revenue |
$3,197 |
$4,053 |
$5,677 |
+26.8% |
+40.1% |
|
Gross Revenue |
$49,690 |
$55,751 |
$64,220 |
+12.2% |
+15.2% |
|
Client Incentives (Contra-Revenue) |
$(13,764) |
$(15,751) |
$(18,317) |
+14.4% |
+16.3% |
|
Net Revenue |
$35,926 |
$40,000 |
$45,903 |
+11.3% |
+14.8% |
Table Operational Performance and Revenue Yield Metrics
|
Operational & Yield Metrics |
FY2024 |
FY2025 |
FY2026 |
YoY Change (FY2025) |
YoY Change (FY2026) |
|---|---|---|---|---|---|
|
Incentive Drag (% of Gross Revenue) |
27.70% |
28.25% |
28.52% |
+55 bps |
+27 bps |
|
Incentive Drag (bps of Payment Volume) |
10.60 bps |
11.33 bps |
11.94 bps |
+0.73 bps |
+0.61 bps |
|
Net Network Take Rate (bps of Payment Volume) |
27.65 bps |
28.77 bps |
29.93 bps |
+1.12 bps |
+1.16 bps |
|
Processed Transactions (Millions) |
233,758 |
257,545 |
281,331 |
+10.2% |
+9.2% |
|
Average Payment Ticket Size ($) |
$55.57 |
$53.97 |
$54.52 |
-2.9% |
+1.0% |
|
Gross Yield per 1,000 Processed Transactions ($) |
$212.57 |
$216.47 |
$228.27 |
+1.8% |
+5.5% |
|
Incentive Drag per 1,000 Processed Transactions ($) |
$58.88 |
$61.16 |
$65.11 |
+3.9% |
+6.5% |
|
Net Yield per 1,000 Processed Transactions ($) |
$153.69 |
$155.31 |
$163.16 |
+1.1% |
+5.1% |
|
Data Processing Yield per 1,000 Transactions ($) |
$75.78 |
$77.63 |
$83.08 |
+2.4% |
+7.0% |
The composition of operational growth diverged across functional product lines:
* Data Processing Revenue ($23,374 million, 36.4% of Gross Revenue) advanced 16.9% YoY on 281,331 million processed transactions, realizing an average fee yield of $0.0831 per switched transaction ($83.08 per 1,000 transactions), driven by transaction-based Value-Added Services (VAS) adoption and favorable routing mixes.
* International Transaction Revenue ($15,251 million, 23.7% of Gross Revenue) expanded 7.7% YoY. While nominal cross-border volume excluding intra-Europe transactions expanded 15% (identical on nominal and constant-dollar bases), top-line cross-border yield moderated due to a spend mix shift toward lower-margin card-not-present (CNP) e-commerce relative to normalized physical travel, compounded by lower foreign exchange volatility across major currency pairs. Foreign exchange rate movements contributed approximately 1 percentage point to total net revenue growth.
* Other Revenue ($5,677 million, 8.8% of Gross Revenue) rose 40.1% YoY, propelled by a 30% increase in Visa Consulting & Analytics (VCA) client advisory projects, marketing activations for premier global sporting sponsorships, and Tink open banking licensing.
Table CLIENT INCENTIVE BALANCE SHEET RECONCILIATION (FY25–FY26)
Balance Sheet & Cash Flow Position
| Financial Line Item ($ Millions) | FY2025 | FY2026 | YoY ($) | YoY (%) |
| Balance Sheet Position | ||||
| Current Client Incentive Assets (Prepaid) | $2,158 | $2,492 | +$334 | +15.5% |
| Non-Current Client Incentive Assets | $5,157 | $6,098 | +$941 | +18.2% |
| Total Client Incentive Assets (Prepaid) | $7,315 | $8,590 | +$1,275 | +17.4% |
| Current Client Incentive Liabilities | $10,369 | $12,150 | +$1,781 | +17.2% |
| Long-Term Client Incentive Liabilities | ~$200 | ~$200 | $0 | 0.0% |
| Total Client Incentive Liabilities (Accrued) | ~$10,569 | ~$12,350 | +$1,781 | +16.9% |
| Customer Cash Collateral (Asset/Liability) | $3,625 | $4,349 | +$724 | +20.0% |
| Statement of Cash Flows Absorption | ||||
| Contra-Revenue Income Statement Deduction | $15,751 | $18,317 | +$2,566 | +16.3% |
| Operating Cash Paid for Client Incentives | $15,314 | $17,705 | +$2,391 | +15.6% |
| Net Balance Sheet Working Capital Addition | +$437 | +$612 | +$175 | N/A |
Incentive contracts are structured via two accounting mechanisms: fixed upfront considerations capitalized and amortized straight-line over contract terms, and performance-based variable rebates accrued as liabilities using probability-weighted forecasts of payments volume, card issuance milestones, and processing thresholds. Quarterly re-evaluations trigger cumulative catch-up adjustments recognized in Net Revenue; however, because incremental incentive accruals require underlying expansion in billable payment volumes, the contra-revenue deduction acts as an operational variable cost without inducing gross margin collapse.
In a standardized $100.00 C2B consumer credit purchase across Visa’s four-party architecture:
* The cardholder is billed $100.00 by the issuing institution.
* The issuer remits $98.50 to the acquiring institution through VisaNet, retaining a $1.50 default Interchange Reimbursement Fee (IRF) (assuming a 1.50% statutory/network default rate).
* The acquirer deducts an acquiring margin of $0.50 and charges the merchant a 2.00% Merchant Discount Rate (MDR) ($2.00 total), remitting $98.00 net proceeds to the seller.
* Visa retains $0.00 of the IRF and $0.00 of the MDR, billing both the issuer and acquirer separate network access, data processing, and volume assessment fees.
Table GAAP OPERATING EXPENSE BREAKDOWN & OPERATING LEVERAGE (FY24–FY26)
Operating Expense Breakdown & Margin Trajectory
| Financial Metric / Expense Component ($ Millions) | FY2024 | FY2025 | FY2026 | % of Total / Margin |
| Operating Expense Components | ||||
| Personnel Expenses | $6,264 | $6,961 | $7,934 | 44.6% |
| Marketing Expenses | $1,560 | $1,684 | $2,315 | 13.0% |
| General & Administrative Expenses | $1,598 | $1,926 | $2,297 | 12.9% |
| Litigation Provision | $462 | $2,562 | $1,764 | 9.9% |
| Depreciation & Amortization | $1,034 | $1,220 | $1,403 | 7.9% |
| Network & Processing Expenses | $778 | $894 | $1,066 | 6.0% |
| Professional Fees | $635 | $759 | $1,014 | 5.7% |
| Total GAAP Operating Expenses | $12,331 | $16,006 | $17,793 | 100.0% |
| Operating Income & Margin Trajectory | ||||
| GAAP Operating Income | $23,595 | $23,994 | $28,110 | 61.24% |
| Non-GAAP Operating Income | $24,317 | $27,094 | $30,984 | 67.50% |
| GAAP EBITDA | $24,629 | $25,214 | $29,513 | 64.29% |
| Adjusted EBITDA | $25,351 | $28,314 | $32,387 | 70.56% |
| GAAP Net Income | $19,743 | $20,058 | $23,504 | 51.20% |
| Non-GAAP Net Income | $20,389 | $22,542 | $25,314 | 55.15% |
| Marginal Processing Economics | ||||
| Incremental Transactions Processed (M) | N/A | 23,787 | 23,786 | N/A |
| Incremental Network & Processing Cost ($M) | N/A | +$116 | +$172 | N/A |
| Marginal Network Cost per Transaction | N/A | $0.00488 | $0.00723 | 0.72 cents |
| Incremental Non-GAAP Opex ($M) | N/A | +$2,777 | +$2,013 | N/A |
| Incremental Non-GAAP Opex per Transaction | N/A | $0.1167 | $0.0846 | 8.46 cents |
Non-GAAP adjustments in FY2026 aggregated to $2,874 million pre-tax, comprising $1,724 million in covered litigation provisions, $563 million in organizational efficiency severance charges within personnel expenses, $229 million in acquired intangible amortization, $76 million in acquisition-related transaction costs, and $282 million in charitable donations to the Visa Foundation, partially offset by net equity investment gains.
Personnel expense expansion (+14.0% YoY) reflected wage adjustments, M&A integration headcount from Prisma Medios de Pago and Newpay, and restructuring severance, supporting a global workforce of 34,800 employees. Marketing outlays rose 37.5% YoY to $2,315 million, driven by sponsorship commitments for the FIFA World Cup 2026 and the Milano Cortina 2026 Olympic Winter Games. Operational leverage remained pronounced: the incremental cost of switching an additional transaction through VisaNet was $0.00723 (0.72 cents), anchoring core network Non-GAAP Operating Margin at 67.50%.
Table DUPONT ROE & INVESTED CAPITAL ROIC BREAKDOWN (FY24–FY26)
DuPont Analysis & Capital Productivity
| Financial Metric / Component | FY2024 | FY2025 | FY2026 | Performance / YoY |
| DuPont Analysis Components | ||||
| Net Profit Margin (GAAP) | 54.95% | 50.15% | 51.20% | +105 bps |
| Asset Turnover | 0.397x | 0.401x | 0.487x | +0.086x |
| Financial Leverage Ratio | 2.312x | 2.628x | 2.613x | -0.015x |
| Consolidated GAAP DuPont ROE | 50.45% | 52.91% | 65.09% | +1,218 bps |
| Consolidated Non-GAAP DuPont ROE | 52.10% | 59.46% | 70.10% | +1,064 bps |
| Balance Sheet Capital Base ($ Millions) | ||||
| Ending Total Assets | $90,500 | $99,627 | $94,360 | -5.3% |
| Ending Stockholders' Equity | $39,137 | $37,909 | $36,111 | -4.7% |
| Short-Term & Current Debt | N/A | $5,569 | $2,716 | -51.2% |
| Long-Term Senior Notes | N/A | $19,602 | $19,355 | -1.3% |
| Total Debt Outstanding | N/A | $25,171 | $22,071 | -12.3% |
| Total Capitalized Funds | N/A | $63,080 | $58,182 | -7.8% |
| Less: Cash, Cash Equivalents & Securities | N/A | $(19,996) | $(14,177) | -29.1% |
| Net Invested Capital (with Intangibles) | N/A | $43,084 | $44,005 | +2.1% |
| Less: Goodwill Recognized | N/A | $(19,879) | $(20,801) | +4.6% |
| Less: Net Intangible Assets | N/A | $(27,646) | $(27,370) | -1.0% |
| Net Tangible Invested Capital Base | N/A | $(4,441) | $(4,166) | N/A |
| Capital Productivity Yields | ||||
| GAAP NOPAT ($ Millions) | N/A | $19,891 | $23,528 | +18.3% |
| Non-GAAP NOPAT ($ Millions) | N/A | $22,298 | $25,438 | +14.1% |
| GAAP ROIC (Invested Capital with Intangibles) | N/A | 46.17% | 53.47% | +730 bps |
| Non-GAAP ROIC (with Intangibles) | N/A | 51.75% | 57.81% | +606 bps |
| ROIC on Net Tangible Invested Capital | N/A | Infinite | Infinite | Negative IC |
Excluding $48,171 million in cumulative goodwill and acquired intangible assets (dominated by $26,819 million in indefinite-lived customer relationships and the Visa trade name), Visa’s Net Tangible Invested Capital was negative $(4,166) million. This asset-light architecture generated $22,057 million in Free Cash Flow (FCF) in FY2026, achieving a GAAP FCF conversion ratio of 93.84% (87.13% on Non-GAAP Net Income).
Capital return to equity holders totaled $25,563 million (115.9% of FCF). Visa repurchased 61 million Class A common shares at an average price of $335.49 ($20,451 million total), leaving $24.4 billion in authorized repurchase capacity as of September 30, 2026. Common stock dividends absorbed $5,112 million ($0.67 per share per quarter), followed by a 16% dividend per share increase to $0.78 approved in October 2026.
Table VALUE-ADDED SERVICES (VAS) & NEW FLOWS PLATFORM MATRIX
Value-Added Services (VAS) & Market TAM Breakdown
| Pillar Division | Addressable TAM | FY2026 Revenue / Volume | YoY (%) | Key Product Assets |
| Issuing Solutions | $125 Billion | N/A | N/A | Visa DPS, Pismo, Prisma |
| Acceptance Solutions | $95 Billion | N/A | N/A | Cybersource, Verifi, LTM |
| Risk & Security Solutions | $150 Billion | N/A | N/A | Visa Protect, Featurespace |
| Advisory & Other | $150 Billion | N/A | N/A | VCA Consulting, Tink A2A |
| Total VAS Portfolio | $520 Billion | $14,200M | +30.3% | 250+ Software Modules |
| Commercial & CMS TAM | $200 Trillion | $1,949B Volume | +12.0% | Visa Direct (15B+ Tx) |
| Consumer Payments TAM | $20 Trillion | $13,389B Volume | +10.1% | 84% Global Tap to Pay |
The expansion of Value-Added Services to $14,200 million (+30.3% YoY, up from $10,900 million in FY2025 and $8,800 million in FY2024) across 250 modular configurations diversified monetization beyond standard clearing fees. Concurrently, Commercial & Money Movement Solutions (CMS) generated $1,949 billion in commercial volume (+12.0% nominal; +11.0% constant-dollar), with Visa Direct logging over 15 billion transactions across 800 financial institutions, 100 domestic switches, and 18 billion endpoints.
Table GEOGRAPHIC REVENUE, VOLUME & ASSET FOOTPRINT (FY24–FY26)
Regional Segment Metrics & Volume Breakdown
| Segment Metric / Asset Category | FY2024 | FY2025 | FY2026 | % Share |
| Net Revenue Breakdown ($ Millions) | ||||
| United States Net Revenue | $14,780 | $15,633 | $17,423 | 38.0% |
| International Net Revenue | $21,146 | $24,367 | $28,480 | 62.0% |
| Consolidated Net Revenue | $35,926 | $40,000 | $45,903 | 100.0% |
| Regional Payments Volume (12 Mo. Ended June 30) | ||||
| United States Volume | $6,420B | $6,787B | $7,338B | 47.8% |
| – Consumer Credit | $2,398B | $2,508B | $2,697B | 17.6% |
| – Consumer Debit | $2,999B | $3,198B | $3,458B | 22.5% |
| – Commercial | $1,023B | $1,081B | $1,184B | 7.7% |
| International Volume | $6,571B | $7,114B | $8,000B | 52.2% |
| – Consumer Credit | $2,916B | $3,097B | $3,408B | 22.2% |
| – Consumer Debit | $3,023B | $3,358B | $3,826B | 24.9% |
| – Commercial | $632B | $659B | $765B | 5.0% |
| Long-Lived Operating Assets ($ Millions) | ||||
| United States PP&E and ROU Assets | $1,732* | $1,826 | $1,884 | 71.6% |
| International Operating Hub Assets | $528* | $598 | $746 | 28.4% |
| Total Long-Lived Operating Assets | $2,260* | $2,424 | $2,630 | 100.0% |
International markets accounted for 62.0% of Net Revenue ($28,480 million, +16.9% YoY) and 52.2% of payments volume ($8,000 billion, +12.5% nominal; +10.0% constant-dollar). No single international jurisdiction represented 10% or more of net revenue. One large financial institution client generated 11% of consolidated Net Revenue across FY2024, FY2025, and FY2026. In compliance with United Nations geographic naming conventions, operations and counterparty exposures in Taiwan are classified as Taiwan, Province of China.
Workforce productivity metrics evidenced significant operational density: 34,800 global employees (65% located outside the U.S. across 90 jurisdictions, exhibiting ~7% voluntary attrition and an 87% internal engagement score) generated $1,319,052 in GAAP Net Revenue per employee and $807,759 in GAAP Operating Income per employee. Approximately 950 dedicated cybersecurity professionals represent 2.7% of total personnel.
Global Infrastructure, Cyber Resilience, and Balance Sheet Risk Buffers
VisaNet serves as the core physical and virtual transaction substrate, processing 281 billion transactions directly in FY2026 out of 355 billion system-wide transactions, with an average throughput of 973 million transactions daily across 160 transaction currencies. Physical infrastructure centers around multi-path enterprise data centers equipped with independent electrical grids and industrial cooling arrays, coupled with three synchronized, 24/7/365 Cyber Fusion Centers located in the United States, the United Kingdom, and Singapore.
Cyber governance follows a three-lines-of-defense model directed by the Chief Information Security Officer (CISO, possessing 30+ years of domain experience, with Visa since 2015) and the President of Technology. The Audit and Risk Committee (ARC) of the Board receives formal operational briefings bi-annually, with annual reviews before the full 11-member Board of Directors led by independent Board Chair John F. Lundgren. Zero material cybersecurity breaches were identified across FY2024, FY2025, or FY2026.
Visa guarantees daily settlement execution between issuing and acquiring members, creating liquidity exposure during the 1-to-2 business-day clearance interval. Peak daily settlement exposure hit $168.6 billion in FY2026 ($100.4 billion daily average). Counterparty default risks are mitigated by holding $9,700 million in total collateral ($4,349 million in restricted balance sheet cash deposits paired to an equal customer collateral liability, plus $5,351 million in off-balance-sheet bank letters of credit, pledged debt paper, and trust rights), supplemented by $9,900 million in dedicated liquidity reserves. New regulations from the Central Bank of Brazil mandating card schemes absorb merchant acquirer insolvencies prompted Visa to submit revised scheme rules, expanding localized collateral requirements.
Market risks are managed across a $16,313 million derivative portfolio ($14,716 million designated in qualifying hedging relationships and $1,597 million non-designated). Cash flow hedges (FX forwards with maturities ≤12 months) released $170 million from AOCI into earnings, holding an unrealized net gain of $36 million and an ending AOCI balance of $(135) million. Net investment hedges—comprising €6,350 million ($6.85 billion carrying value) in Euro Senior Notes and cross-currency swaps—generated a $287 million pre-tax gain in OCI, offsetting Euro balance sheet translation swings associated with Visa Europe. Under Item 7A stress testing, a 10% functional currency devaluation triggers an estimated $486 million fair value derivative loss, while a 10% move in the EUR/USD pair generates a $2.2 billion translation swing in AOCI.
The consolidated GAAP effective tax rate (ETR) contracted to 16.3% ($4,589 million provision), influenced by a $314 million discrete deferred tax benefit from amended U.S. foreign earnings rules and $540 million in clean energy, legal settlement, and R&D credits ($1,900 million in clean energy tax credit cash purchases). Concessional incentives at the Singapore Asia-Pacific operational hub (Visa Worldwide Pte. Ltd., active through September 30, 2028) saved $498 million, boosting diluted EPS by $0.26.
OECD Pillar Two global minimum tax implementation yielded a $293 million local top-up provision (+1.0% to ETR), focused on Singapore operations. U.S. foreign tax credits generated against foreign top-up charges neutralized cash flow erosion. U.S. side-by-side administrative safe harbor elections limited secondary Undertaxed Profits Rule (UTPR) applications. Gross unrecognized tax benefits stood at $1,774 million (~$1,600 million impacting ETR if recognized), with $183 million in accrued interest. U.S. federal income tax returns for FY2019 through FY2022 remain under IRS examination, alongside pending software deduction litigation in the U.S. Court of Federal Claims covering FY2008 through FY2015.
Goodwill expanded by $922 million to $20,801 million, reflecting the acquisition of Prisma Medios de Pago and Newpay in Argentina for $1,509 million in cash ($184 million assigned to technology amortized over 3 years, $405 million to customer relationships amortized over 6 years, $85 million in other net assets, $(199) million in deferred tax liabilities, and $1,034 million in non-tax-deductible goodwill), net of $(112) million in foreign currency translation. Featurespace (acquired in FY2025 for $946 million, adding $794 million to goodwill) was integrated into the Visa Protect fraud platform, while a definitive cash agreement to acquire behavioral intelligence firm BioCatch for $2,400 million remains subject to regulatory approval.
Gross capitalized technology assets expanded to $7,462 million ($4.2 billion in accumulated amortization). Software development follows stage-based capitalization rules under ASC 350-40 (preliminary project costs expensed, coding/testing capitalized, post-implementation expensed; transitioning to FASB ASU 2025-06 on October 1, 2028). Over 350 software product updates were shipped in FY2026, accelerated internally via the Visa Agentic Toolchain and secured via the Visa Vulnerability Agentic Harness. Annual impairment evaluations performed on February 1, 2026, confirmed zero impairment across goodwill or indefinite-lived intangibles.
HDIN Institutional Verdict
Table Litigation & Escrow Balances and Capital Protection Mechanics
| Category / Conversion Component | FY2025 | FY2026 | Net Change | Balance Sheet / Structural Status |
| Litigation Escrow & Liability Balances | ||||
| U.S. Litigation Escrow (Restricted Cash) | $2,990M | $628M | -$2,362M | Restricted Balance |
| Total Accrued Litigation Liabilities | $3,033M | $990M | -$2,043M | Current Liability |
| – U.S. Covered Accrual (MDL 1720) | $2,698M | $623M | -$2,075M | Cash Outflows: $3,677M |
| – VE Territory Covered Accrual | $9M | $91M | +$82M | Cash Outflows: $12M |
| – Uncovered Legal Matters Accrual | $326M | $27M | -$299M | Settlements Resolved |
| Unresolved Interchange at Issue (Opt-Outs) | ~$17.4B | ~$15.9B | -$1.5B | Treble Damages Risk |
| Total Gross Series B/C Protection Value | $1,453M* | $1,330M | -$123M | Loss Recovered: $123M |
| Right to Recover for Covered Losses (Contra) | N/A | $(119M) | N/A | Unrecovered Loss Right |
| Net Recovery Capital for VE Covered Loss | N/A | $1,211M | N/A | Class A Protection Pool |
Table As-Converted Capital Mechanics (September 30, 2026 Stock Price: $359.33)
| Share Class | Share Count | Conversion Rate & Dynamic | As-Converted Class A Shares | Gross Implied Value | Notes / Dilution Factor |
| Series A Preferred Stock | 5,000 | 100.0000 | 1M | $395M | Baseline fixed rate |
| Series B Preferred Stock | 2M | 0.5830 (vs. 0.6690 FY25) | 1M | $520M | Rate adjusted for covered losses |
| Series C Preferred Stock | 3M | 0.7140 (vs. 0.7640 FY25) | 2M | $810M | Rate adjusted for covered losses |
| Class B-1 Common Stock | — | 1.5400 | — | — | 1.0x dilution factor |
| Class B-2 Common Stock | — | 1.4924 | — | — | 2.0x dilution factor |
| Class B-3 Common Stock | — | 1.4773 | — | — | 4.0x dilution factor |
Visa’s 61.24% GAAP Operating Margin and $22.1 billion Free Cash Flow generation reinforce an asset-light core processing monopoly; yet, institutional capital must look past headline top-line expansion to track the structural shift toward regulatory-mandated unbundling, sovereign payment alternatives, and contra-revenue inflation.
First, client incentives ($18,317 million, 28.52% of gross revenue) represent an entrenched operational toll rather than discretionary marketing. While management presents incentives as volume drivers, the increase in incentive yield drag to 11.94 bps of payment volume confirms that large issuing banks (such as JPMorgan Chase, Citigroup, and Bank of America) are capturing a larger share of transaction economics. With the Federal Reserve’s Regulation II lowering debit interchange caps and requiring dual-network routing for e-commerce, issuing banks hold increased leverage to demand richer performance rebates to maintain Visa routing priority. The proposed Credit Card Competition Act (CCCA), if enacted, would extend mandatory dual-routing to credit networks, threatening the pricing power of Visa's highest-margin payment stream.
Second, the Critical Audit Matter (CAM) highlighted by independent auditor KPMG LLP (San Francisco, CA, Firm ID: 185)—the assessment of the litigation accrual for merchants opting out of the Interchange Multidistrict Litigation (MDL 1720) Damages Class settlement—demonstrates material tail-risk. Although merchants representing 96% of eligible opt-out volume have reached terms, approximately $15.9 billion in nominal interchange fees remains disputed by major merchant opt-outs. Under federal antitrust law, damages are subject to mandatory trebling. While the balance sheet reflects a litigation reserve of $623 million for unresolved claims, an adverse trial outcome would exceed existing reserves.
Third, Visa’s legal insulation structures—the U.S. and Europe Retrospective Responsibility Plans—successfully prevent legacy antitrust claims from impairing GAAP Net Income, but rely on share conversion dilution:
* In the U.S., funding $1,280 million into the Litigation Escrow Account during FY2026 reduced Class B-1, B-2, and B-3 conversion rates into Class A shares, eliminating 4 million as-converted Class A shares and protecting reported Class A EPS. The May 2026 Exchange Offer retired 3 million Class B-1 and 120 million Class B-2 shares in exchange for 61 million Class B-3 shares (which absorb 4x the dilution factor of Class B-1) and 23 million Class C shares, secured by binding bank Makewhole Agreements.
* In Europe, recovering $123 million in interchange losses lowered Series B (0.6690 to 0.5830) and Series C (0.7640 to 0.7140) conversion rates, leaving $1,211 million in net equity protection.
Fourth, structural headwinds are emerging via regulatory enforcement and public real-time payment (RTP) rails. The civil antitrust lawsuit filed by the U.S. Department of Justice on September 24, 2024 (SDNY), alleging Section 1 and Section 2 Sherman Act monopolization in debit networks, survived a motion to dismiss on June 23, 2025, with parallel merchant class actions clearing initial dismissal motions in October 2025. Concurrently, state-backed RTP schemes (Pix in Brazil, UPI in India, FedNow in the U.S.) are eroding domestic debit transaction volume.
Visa’s co-opetition strategy—integrating Visa Direct across 100+ domestic schemes, embedding Visa Protect over account-to-account flows, tokenizing >60% of e-commerce transactions through the Visa Token Service, and piloting the Visa Stablecoin Platform across 225+ card programs alongside the open-source Trusted Agent Protocol for autonomous AI commerce—demonstrates adaptability. However, as the European Commission pursues preliminary investigations into acquirer fees and sovereign networks enforce local data processing mandates, Visa’s terminal multiple will increasingly depend on its ability to expand high-margin Value-Added Services ($14.2 billion; +30.3%) faster than regulatory forces compress core interchange economics.
Presentation Download & Video Access:
- Presentation Download: Click the PDF download link under 'Related Topics' to access the full institutional presentation of this report.
- Video Link: Click this link to watch the HDIN analyst briefing on YouTube.
About HDIN Research:
HDIN Research is a premier global market intelligence and strategic advisory firm specializing in institutional-grade financial analysis, supply chain audits, and macroeconomic forecasting. Our dedicated sector analysts deliver actionable, data-driven insights tailored for private equity, hedge funds, and corporate strategy teams. Visit us at http://www.hdinresearch.com.
2026 AI Transparency Footer:
"This intelligence report was authored by HDIN Research analysts following a rigorous audit of official corporate filings. AI was utilized for massive-scale data synthesis and structural drafting, ensuring 100% inclusion of reported data points. All strategic insights, financial modeling, and final verdicts were verified by our editorial board to ensure professional accuracy and compliance with 2026 Google Search E-E-A-T standards."