ESDS Software Solution Limited: Global Sovereign AI Pivot Near Airoli and Nashik as 157% Managed Services Expansion Fuels 49.60% EBITDA Margin
Date : 2026-11-13
Reading : 118
HDIN Executive Takeaways
1. ESDS Software Solution Limited [BSE: 544898 / NSE: ESDS] pivoted into sovereign AI infrastructure during FY2025-26, driving consolidated revenue up 30.68% YoY to ₹4,722.10 million and Profit After Tax (PAT) up 117.26% YoY to ₹1,208.23 million, with EBITDA margins reaching 49.60%.
2. International execution via special purpose vehicle (SPV) SPOCHUB Solutions Private Limited secured a landmark ~$1,250 million Total Contract Value (TCV) Australian cluster contract (~8,208 NVIDIA B300 GPUs), generating ₹11,766.35 million in upfront customer cash advances.
3. Balance sheet deleveraging lowered total borrowings by 31.60% YoY to ₹429.17 million, dropping the Debt-to-Equity ratio to 0.08x, while ₹5,760.00 million in net IPO proceeds is fully committed to domestic hardware deployments across four Tier III data center campuses.
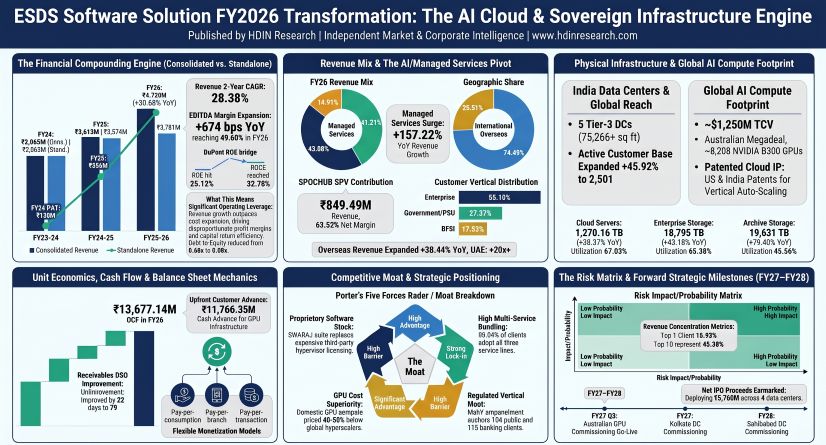
Figure ESDS Software Solution FY2026 Transformation: The Al Cloud & Sovereign Infrastructure Engine
 Segmental Realities, Earnings Quality, and the Subsidiary Profit Scissors Gap
Consolidated top-line growth of 30.68% YoY (2-year CAGR of 28.38%) masks a structural variance between parent operations and specialized operating vehicles. Standalone parent revenue advanced 5.79% YoY to ₹3,781.17 million with PAT rising 2.29% to ₹621.49 million. The consolidated growth delta is concentrated in subsidiary operations: SPOCHUB Solutions Private Limited recognized ₹849.49 million in revenue and ₹539.64 million in PAT (63.52% net profit margin), while UAE-based ESDS Cloud FZ-LLC contributed ₹120.17 million in revenue and ₹54.62 million in PAT (45.45% net profit margin). Combined, these two entities contributed 49.18% of total group net profit.
Table Revenue Breakdown by Business Segment and Revenue Recognition Method (FY2024-25 to FY2025-26)
The mix shift toward Managed Services (+157.22% YoY) drove a 1,404 bps expansion in consolidated EBITDA margin over two years to 49.60% (Standalone EBITDA margin contracted 160 bps in FY26 to 41.45%). Operating leverage was supported by headcount optimization: total permanent employees fell 41.95% YoY to 995, lifting billed revenue per employee by 37.28% YoY from ₹3.46 million to ₹4.75 million. Operating costs grew 6.57% against a 30.68% revenue increase. Employee benefit expenses fell from 26.05% of revenue in FY25 to 22.11% in FY26 (-394 bps).
Finance costs decreased 53.31% YoY to ₹117.90 million as total debt dropped 31.60% YoY to ₹429.17 million. Consequently, consolidated Profit Before Tax (PBT) expanded 102.70% YoY to ₹1,674.23 million, pushing Return on Equity (ROE) to 25.12% and Return on Capital Employed (ROCE) to 32.78%. DuPont analysis confirms net margin expansion (+1,020 bps to 25.59%) drove the return profile. Standalone ROE contracted from 17.15% to 12.77% as parent net worth grew 14.75% to ₹5,200.00 million ahead of asset deployment.
Operating cash flow (OCF) expanded to ₹13,677.14 million (FCF of ₹12,418.20 million after direct CapEx of ₹1,258.94 million). This operating cash flow reflects a non-refundable, unearned customer advance of ₹11,766.35 million recorded under Other Current Liabilities for the Australian GPU cluster contract, rather than normal customer billings (actual billed collections totaled ₹4,083.61 million). The advance lowered the Current Ratio from 2.13x to 1.16x, but carries zero interest or fixed debt repayment terms. Cash balances closed at ₹12,533.85 million.
DuPont ROE Decomposition (Consolidated FY25 vs. FY26):
FY25: 17.27% = Net Margin 15.39% × Asset Turnover 0.618x × Leverage 1.817x
FY26: 25.12% = Net Margin 25.59% × Asset Turnover 0.363x × Leverage 3.997x
(Note: FY26 Asset Turnover and Financial Leverage reflect the ₹11.77B advance liability and cash buffer)
Customer retention metrics shifted as active clients expanded 45.92% YoY from 1,714 to 2,501 (+787 net client additions). Clients utilizing all three business lines reached 89.04% (up from 62.32% in FY24), and clients with contract tenures exceeding 5 years accounted for 47.75% of group revenue (65.60% from clients >3 years). Blended ARPU contracted 10.43% YoY to ₹1.89 million due to SME onboarding and the revenue normalization of a legacy Russian enterprise BFSI account (which dropped from 20.15% of revenue in FY25 to 2.80% in FY26). The net revenue retention (NRR) rate closed at 94.92%; excluding the Russian account, existing domestic client spend grew 31.12% YoY.
Trade receivables totaled ₹1,655.19 million (gross billed receivables of ₹1,036.91 million plus ₹633.93 million unbilled revenue). Billed receivables older than 180 days reached ₹430.93 million (26.04% of total exposure), and receivables older than 1 year stood at ₹242.52 million (14.65% of total exposure), tied to state administrative review cycles. Total Expected Credit Loss (ECL) provisions stood at ₹345.85 million (including ₹15.65 million in credit-impaired accounts), representing a 142.61% provision coverage ratio against receivables older than 1 year. Days Sales Outstanding (DSO) improved by 22 days to 79 days.
Infrastructure Layout, Proprietary Software IP, and Geographic Footprint
ESDS operates 5 carrier-neutral Tier III data centers (TIA-942 rated) covering 75,266+ sq ft with a 99.995% uptime track record and zero total service outages reported since April 1, 2023.
ESDS Physical Footprint & Development Pipeline:
[Airoli (Navi Mumbai)] ── Flagship Campus (Owned) ── Expansion Target
[Nashik] ── Registered HQ (Owned) ── 154 kWp Solar / PUE 1.63
[Bengaluru] ── STPI Partnership ── Operational Tier III
[Mohali] ── STPI Partnership ── Operational Tier III
[Noida] ── STPI Partnership ── Commercialized FY26
[Kolkata] ── STPI Partnership ── Commissioning FY27
[Sahibabad] ── CEL Partnership ── Commissioning FY28
Table Data Center Infrastructure Capacity, Utilization and Operating Cost Metrics (FY2024-25 to FY2025-26)
Capital allocation is directed by the September 4, 2026 IPO, which raised ₹7,200.00 million gross (16,783,216 fresh equity shares at ₹429 each, subscribed 143x, listing premium 76.5%). Paid-up equity expanded to 117,210,969 shares. Net IPO proceeds of ₹5,760.00 million are earmarked for hardware expansion across Airoli, Bengaluru, Mohali, and Nashik data centers during FY27 and FY28, with ₹174.44 million in existing executory CapEx contracts.
The group substitutes external software licenses (VMware, Nutanix, Datadog, CyberArk) with indigenous intellectual property. ESDS holds three patents across the United States and India for vertical auto-scaling cloud compute (SWARAJ Cloud / eNlight), paired with the SWARAJ software suite:
* SWARAJ Bodhi & Garuda: Unified AI operations, GPU cluster orchestration, and OpenTelemetry observability.
* SWARAJ Security Suite (Jatayoo, Nandi, Hansa, Sethu): Database activity monitoring, PAM, agentic SIEM, and DevSecOps. A state government deployment demonstrated ₹270 million in savings over 5 years by replacing third-party VPN software with SWARAJ Web VPN.
* SPOCHUB & Low Code Magic: Enterprise marketplace and low-code orchestration environment.
R&D payroll for its 87-engineer team is expensed directly into P&L within the ₹1,044.20 million employee cost line. Capitalized intangible software additions totaled ₹121.71 million in FY26, bringing net intangible assets to ₹130.35 million (2.39% of net equity) with zero Intangible Assets Under Development. PPE depreciation runs straight-line over 3 to 6 years for IT hardware and 10 to 15 years for power/cooling infrastructure (effective rate of 10.34%).
Vertical customer exposure centers on regulated Indian institutions:
Consolidated FY26 Revenue by Sector:
Enterprise Workloads: 55.10% (2,282 active clients; ERP & SAP HANA hosting)
Government & PSU: 27.37% (104 clients; PM-KISAN, Smart Metering, Land Records)
BFSI Ecosystem: 17.53% (115 banking institutions across 1,045 bank branches)
Geographically, India accounted for 74.49% of FY26 revenue (₹3,517.69 million, up 28.22% YoY). International revenue surged 38.44% YoY to ₹1,204.41 million (25.51% of total revenue), driven by the UAE (₹873.59 million, 18.50% share) and the UK (₹195.50 million, 4.14% share).
On March 31, 2026, SPOCHUB executed a 5-to-7 year contract in Australia for ~8,208 NVIDIA B300 GPUs with 17.83 PB of AI storage (~$1,250 million TCV). The commercial deployment utilizes a partner-operated hardware model where the local Australian entity assumes infrastructure procurement and facility power obligations, while ESDS provides the cloud software stack, customer provisioning, and managed operations. Revenue recognition under Ind AS 115 begins linearly post go-live in Q3 FY27, adding an estimated ~₹1.68 Billion to ₹2.35 Billion to annual top-line run rates.
HDIN Institutional Verdict
ESDS’s operational transformation reflects an expanding high-margin business profile, but investors must monitor project delivery and statutory reporting controls:
1. Advance Amortization & Milestone Delivery: Operating cash flow is elevated by the ₹11,766.35 million Australian customer advance. With commercial go-live targeted for Q3 FY27, revenue recognition depends on the timely installation of ~8,208 NVIDIA B300 GPUs by its local partner. The partner-operated structure protects ESDS from upstream CapEx depreciation, but requires monitoring for power and supply-chain execution milestones.
2. Transfer Pricing and Parent-Subsidiary Economics: Consolidated net earnings are heavily weighted toward SPOCHUB (₹539.64 million PAT on ₹849.49 million revenue) and the UAE subsidiary (₹54.62 million PAT). Standalone parent profitability remained flat (+2.29% PAT YoY), bearing the depreciation (₹634.58 million) and power overheads of 5 data centers. Intercompany cash repatriation operated effectively in FY26, with the UAE unit repaying ₹362.87 million in net debt and interest. Similar arm's-length allocations must be maintained as SPOCHUB scales.
3. Statutory Audit Exceptions and Receivables Realization: Independent statutory auditors (M S K C & Associates LLP, a member firm of BDO) issued unqualified opinions on standalone and consolidated accounts, but identified operational control items:
* Rule 11(g) Database Logs: Billing systems lacked verifiable database-level edit logging throughout the year.
* CARO 3(ii)(b) Bank Variances: Receivables reported to working capital lenders varied from book accounts at Q4 end (-₹95.69 million delta) due to period-end adjustment timings.
* Receivables & SLA Expenses: Receivables older than 180 days (₹430.93 million) represent 26.04% of total customer exposure, though offset by ₹345.85 million in ECL provisions. P&L line items also absorbed an unpublicized ₹57.18 million charge under Other Expenses for service agreement non-performance penalties.
Legal contingencies remain contained: disputed GST Input Tax Credit demands stand at ₹23.01 million across four appeals, while a Bombay High Court petition filed by a former employee claiming ₹184.80 million in oral ESOP entitlements carries zero accounting provisions based on legal defense assessments. Formal ratification of pre-IPO ESOP 2021 and 2024 schemes (capped at 5.50 million shares / 4.69% dilution) is slated for the 21st AGM on November 30, 2026.
Presentation Download & Video Access:
- Presentation Download: Click the PDF download link under 'Related Topics' to access the full institutional presentation of this report.
- Video Link: Click this link to watch the HDIN analyst briefing on YouTube.
About HDIN Research:
HDIN Research is a premier global market intelligence and strategic advisory firm specializing in institutional-grade financial analysis, supply chain audits, and macroeconomic forecasting. Our dedicated sector analysts deliver actionable, data-driven insights tailored for private equity, hedge funds, and corporate strategy teams. Visit us at http://www.hdinresearch.com.
*2026 AI Transparency Footer:*
"This intelligence report was authored by HDIN Research analysts following a rigorous audit of official corporate filings. AI was utilized for massive-scale data synthesis and structural drafting, ensuring 100% inclusion of reported data points. All strategic insights, financial modeling, and final verdicts were verified by our editorial board to ensure professional accuracy and compliance with 2026 Google Search E-E-A-T standards."
1. ESDS Software Solution Limited [BSE: 544898 / NSE: ESDS] pivoted into sovereign AI infrastructure during FY2025-26, driving consolidated revenue up 30.68% YoY to ₹4,722.10 million and Profit After Tax (PAT) up 117.26% YoY to ₹1,208.23 million, with EBITDA margins reaching 49.60%.
2. International execution via special purpose vehicle (SPV) SPOCHUB Solutions Private Limited secured a landmark ~$1,250 million Total Contract Value (TCV) Australian cluster contract (~8,208 NVIDIA B300 GPUs), generating ₹11,766.35 million in upfront customer cash advances.
3. Balance sheet deleveraging lowered total borrowings by 31.60% YoY to ₹429.17 million, dropping the Debt-to-Equity ratio to 0.08x, while ₹5,760.00 million in net IPO proceeds is fully committed to domestic hardware deployments across four Tier III data center campuses.
Figure ESDS Software Solution FY2026 Transformation: The Al Cloud & Sovereign Infrastructure Engine
Segmental Realities, Earnings Quality, and the Subsidiary Profit Scissors GapConsolidated top-line growth of 30.68% YoY (2-year CAGR of 28.38%) masks a structural variance between parent operations and specialized operating vehicles. Standalone parent revenue advanced 5.79% YoY to ₹3,781.17 million with PAT rising 2.29% to ₹621.49 million. The consolidated growth delta is concentrated in subsidiary operations: SPOCHUB Solutions Private Limited recognized ₹849.49 million in revenue and ₹539.64 million in PAT (63.52% net profit margin), while UAE-based ESDS Cloud FZ-LLC contributed ₹120.17 million in revenue and ₹54.62 million in PAT (45.45% net profit margin). Combined, these two entities contributed 49.18% of total group net profit.
Table Revenue Breakdown by Business Segment and Revenue Recognition Method (FY2024-25 to FY2025-26)
| Segment / Business Line (Ind AS 108) | FY2024-25 Revenue (₹ Mn) | FY2025-26 Revenue (₹ Mn) | YoY Growth (%) | FY26 Revenue Mix (%) | Accounting Timing (Ind AS 115) |
| Infrastructure-as-a-Service (IaaS) | 2,036.41 | 2,071.97 | +1.75% | 43.88% | Over Time |
| ↳ Cloud Computing & Virtual Machines | 1,663.16 | 1,678.90 | +0.95% | 35.55% | Over Time |
| ↳ Colocation & DC Services | 373.25 | 393.07 | +5.31% | 8.33% | Over Time |
| Managed Services | 756.50 | 1,945.91 | +157.22% | 41.21% | Over Time |
| Software-as-a-Service (SaaS) | 820.44 | 704.22 | -14.17% | 14.91% | Over Time |
| Consolidated Revenue from Operations | 3,613.35 | 4,722.10 | +30.68% | 100.00% | 74.48% Over Time / 25.52% Point in Time |
The mix shift toward Managed Services (+157.22% YoY) drove a 1,404 bps expansion in consolidated EBITDA margin over two years to 49.60% (Standalone EBITDA margin contracted 160 bps in FY26 to 41.45%). Operating leverage was supported by headcount optimization: total permanent employees fell 41.95% YoY to 995, lifting billed revenue per employee by 37.28% YoY from ₹3.46 million to ₹4.75 million. Operating costs grew 6.57% against a 30.68% revenue increase. Employee benefit expenses fell from 26.05% of revenue in FY25 to 22.11% in FY26 (-394 bps).
Finance costs decreased 53.31% YoY to ₹117.90 million as total debt dropped 31.60% YoY to ₹429.17 million. Consequently, consolidated Profit Before Tax (PBT) expanded 102.70% YoY to ₹1,674.23 million, pushing Return on Equity (ROE) to 25.12% and Return on Capital Employed (ROCE) to 32.78%. DuPont analysis confirms net margin expansion (+1,020 bps to 25.59%) drove the return profile. Standalone ROE contracted from 17.15% to 12.77% as parent net worth grew 14.75% to ₹5,200.00 million ahead of asset deployment.
Operating cash flow (OCF) expanded to ₹13,677.14 million (FCF of ₹12,418.20 million after direct CapEx of ₹1,258.94 million). This operating cash flow reflects a non-refundable, unearned customer advance of ₹11,766.35 million recorded under Other Current Liabilities for the Australian GPU cluster contract, rather than normal customer billings (actual billed collections totaled ₹4,083.61 million). The advance lowered the Current Ratio from 2.13x to 1.16x, but carries zero interest or fixed debt repayment terms. Cash balances closed at ₹12,533.85 million.
DuPont ROE Decomposition (Consolidated FY25 vs. FY26):
FY25: 17.27% = Net Margin 15.39% × Asset Turnover 0.618x × Leverage 1.817x
FY26: 25.12% = Net Margin 25.59% × Asset Turnover 0.363x × Leverage 3.997x
(Note: FY26 Asset Turnover and Financial Leverage reflect the ₹11.77B advance liability and cash buffer)
Customer retention metrics shifted as active clients expanded 45.92% YoY from 1,714 to 2,501 (+787 net client additions). Clients utilizing all three business lines reached 89.04% (up from 62.32% in FY24), and clients with contract tenures exceeding 5 years accounted for 47.75% of group revenue (65.60% from clients >3 years). Blended ARPU contracted 10.43% YoY to ₹1.89 million due to SME onboarding and the revenue normalization of a legacy Russian enterprise BFSI account (which dropped from 20.15% of revenue in FY25 to 2.80% in FY26). The net revenue retention (NRR) rate closed at 94.92%; excluding the Russian account, existing domestic client spend grew 31.12% YoY.
Trade receivables totaled ₹1,655.19 million (gross billed receivables of ₹1,036.91 million plus ₹633.93 million unbilled revenue). Billed receivables older than 180 days reached ₹430.93 million (26.04% of total exposure), and receivables older than 1 year stood at ₹242.52 million (14.65% of total exposure), tied to state administrative review cycles. Total Expected Credit Loss (ECL) provisions stood at ₹345.85 million (including ₹15.65 million in credit-impaired accounts), representing a 142.61% provision coverage ratio against receivables older than 1 year. Days Sales Outstanding (DSO) improved by 22 days to 79 days.
Infrastructure Layout, Proprietary Software IP, and Geographic Footprint
ESDS operates 5 carrier-neutral Tier III data centers (TIA-942 rated) covering 75,266+ sq ft with a 99.995% uptime track record and zero total service outages reported since April 1, 2023.
ESDS Physical Footprint & Development Pipeline:
[Airoli (Navi Mumbai)] ── Flagship Campus (Owned) ── Expansion Target
[Nashik] ── Registered HQ (Owned) ── 154 kWp Solar / PUE 1.63
[Bengaluru] ── STPI Partnership ── Operational Tier III
[Mohali] ── STPI Partnership ── Operational Tier III
[Noida] ── STPI Partnership ── Commercialized FY26
[Kolkata] ── STPI Partnership ── Commissioning FY27
[Sahibabad] ── CEL Partnership ── Commissioning FY28
Table Data Center Infrastructure Capacity, Utilization and Operating Cost Metrics (FY2024-25 to FY2025-26)
| Operating Metric / Facility Component | FY2024-25 Actual | FY2025-26 Actual | Operational Utilization | Strategic Parameter / Capacity Function |
| Cloud Computing Servers | 917.95 TB | 1,270.16 TB (+38.37%) | 67.03% | 32.97% headroom retained for workload bursts |
| Enterprise Storage (SAN/NAS) | 13,126.87 TB | 18,795.00 TB (+43.18%) | 65.38% | Dedicated high-IOPS enterprise application arrays |
| Archive Cold Storage | 10,942.71 TB | 19,631.23 TB (+79.40%) | 45.56% | Low-cost compliance data retention |
| Average Facility PUE | 1.58 | 1.55 | Target: < 1.50 | Nashik recorded 1.63; airflow efficiency up ~35% |
| Direct Power & Fuel Costs | ₹197.43 Mn | ₹211.71 Mn (+7.23%) | 4.48% of Rev | Nashik 154 kWp solar generated 213.2 MWh |
| Telecom & Interconnect Costs | ₹90.43 Mn | ₹126.01 Mn (+39.35%) | 2.67% of Rev | High-speed fiber interlinks across 5 DC nodes |
Capital allocation is directed by the September 4, 2026 IPO, which raised ₹7,200.00 million gross (16,783,216 fresh equity shares at ₹429 each, subscribed 143x, listing premium 76.5%). Paid-up equity expanded to 117,210,969 shares. Net IPO proceeds of ₹5,760.00 million are earmarked for hardware expansion across Airoli, Bengaluru, Mohali, and Nashik data centers during FY27 and FY28, with ₹174.44 million in existing executory CapEx contracts.
The group substitutes external software licenses (VMware, Nutanix, Datadog, CyberArk) with indigenous intellectual property. ESDS holds three patents across the United States and India for vertical auto-scaling cloud compute (SWARAJ Cloud / eNlight), paired with the SWARAJ software suite:
* SWARAJ Bodhi & Garuda: Unified AI operations, GPU cluster orchestration, and OpenTelemetry observability.
* SWARAJ Security Suite (Jatayoo, Nandi, Hansa, Sethu): Database activity monitoring, PAM, agentic SIEM, and DevSecOps. A state government deployment demonstrated ₹270 million in savings over 5 years by replacing third-party VPN software with SWARAJ Web VPN.
* SPOCHUB & Low Code Magic: Enterprise marketplace and low-code orchestration environment.
R&D payroll for its 87-engineer team is expensed directly into P&L within the ₹1,044.20 million employee cost line. Capitalized intangible software additions totaled ₹121.71 million in FY26, bringing net intangible assets to ₹130.35 million (2.39% of net equity) with zero Intangible Assets Under Development. PPE depreciation runs straight-line over 3 to 6 years for IT hardware and 10 to 15 years for power/cooling infrastructure (effective rate of 10.34%).
Vertical customer exposure centers on regulated Indian institutions:
Consolidated FY26 Revenue by Sector:
Enterprise Workloads: 55.10% (2,282 active clients; ERP & SAP HANA hosting)
Government & PSU: 27.37% (104 clients; PM-KISAN, Smart Metering, Land Records)
BFSI Ecosystem: 17.53% (115 banking institutions across 1,045 bank branches)
Geographically, India accounted for 74.49% of FY26 revenue (₹3,517.69 million, up 28.22% YoY). International revenue surged 38.44% YoY to ₹1,204.41 million (25.51% of total revenue), driven by the UAE (₹873.59 million, 18.50% share) and the UK (₹195.50 million, 4.14% share).
On March 31, 2026, SPOCHUB executed a 5-to-7 year contract in Australia for ~8,208 NVIDIA B300 GPUs with 17.83 PB of AI storage (~$1,250 million TCV). The commercial deployment utilizes a partner-operated hardware model where the local Australian entity assumes infrastructure procurement and facility power obligations, while ESDS provides the cloud software stack, customer provisioning, and managed operations. Revenue recognition under Ind AS 115 begins linearly post go-live in Q3 FY27, adding an estimated ~₹1.68 Billion to ₹2.35 Billion to annual top-line run rates.
HDIN Institutional Verdict
ESDS’s operational transformation reflects an expanding high-margin business profile, but investors must monitor project delivery and statutory reporting controls:
1. Advance Amortization & Milestone Delivery: Operating cash flow is elevated by the ₹11,766.35 million Australian customer advance. With commercial go-live targeted for Q3 FY27, revenue recognition depends on the timely installation of ~8,208 NVIDIA B300 GPUs by its local partner. The partner-operated structure protects ESDS from upstream CapEx depreciation, but requires monitoring for power and supply-chain execution milestones.
2. Transfer Pricing and Parent-Subsidiary Economics: Consolidated net earnings are heavily weighted toward SPOCHUB (₹539.64 million PAT on ₹849.49 million revenue) and the UAE subsidiary (₹54.62 million PAT). Standalone parent profitability remained flat (+2.29% PAT YoY), bearing the depreciation (₹634.58 million) and power overheads of 5 data centers. Intercompany cash repatriation operated effectively in FY26, with the UAE unit repaying ₹362.87 million in net debt and interest. Similar arm's-length allocations must be maintained as SPOCHUB scales.
3. Statutory Audit Exceptions and Receivables Realization: Independent statutory auditors (M S K C & Associates LLP, a member firm of BDO) issued unqualified opinions on standalone and consolidated accounts, but identified operational control items:
* Rule 11(g) Database Logs: Billing systems lacked verifiable database-level edit logging throughout the year.
* CARO 3(ii)(b) Bank Variances: Receivables reported to working capital lenders varied from book accounts at Q4 end (-₹95.69 million delta) due to period-end adjustment timings.
* Receivables & SLA Expenses: Receivables older than 180 days (₹430.93 million) represent 26.04% of total customer exposure, though offset by ₹345.85 million in ECL provisions. P&L line items also absorbed an unpublicized ₹57.18 million charge under Other Expenses for service agreement non-performance penalties.
Legal contingencies remain contained: disputed GST Input Tax Credit demands stand at ₹23.01 million across four appeals, while a Bombay High Court petition filed by a former employee claiming ₹184.80 million in oral ESOP entitlements carries zero accounting provisions based on legal defense assessments. Formal ratification of pre-IPO ESOP 2021 and 2024 schemes (capped at 5.50 million shares / 4.69% dilution) is slated for the 21st AGM on November 30, 2026.
Presentation Download & Video Access:
- Presentation Download: Click the PDF download link under 'Related Topics' to access the full institutional presentation of this report.
- Video Link: Click this link to watch the HDIN analyst briefing on YouTube.
About HDIN Research:
HDIN Research is a premier global market intelligence and strategic advisory firm specializing in institutional-grade financial analysis, supply chain audits, and macroeconomic forecasting. Our dedicated sector analysts deliver actionable, data-driven insights tailored for private equity, hedge funds, and corporate strategy teams. Visit us at http://www.hdinresearch.com.
*2026 AI Transparency Footer:*
"This intelligence report was authored by HDIN Research analysts following a rigorous audit of official corporate filings. AI was utilized for massive-scale data synthesis and structural drafting, ensuring 100% inclusion of reported data points. All strategic insights, financial modeling, and final verdicts were verified by our editorial board to ensure professional accuracy and compliance with 2026 Google Search E-E-A-T standards."