Apple Inc.: Capital Realignment and Component Commitments Near $89.7B as Margin Architecture Reaches 48.79% Amid Strategic Executive Succession
HDIN Executive Takeaways
1. Consolidated revenue expanded 15.06% year-over-year to $478.834 billion in FY2026, driven by a 189 basis point gross margin expansion to 48.79%, supported by 76.19% Services margins and U.S. Customs tariff refund credits.
2. Off-balance sheet manufacturing purchase obligations surged 59.61% to $89.700 billion, concentrating upstream production commitments across assembly clusters in Mainland China, India, and wafer fabrication nodes in Taiwan, China.
3. John Ternus assumed the Chief Executive Officer role as net cash expanded to $56.824 billion, backing $136.056 billion in free cash flow while absorbing $4.338 billion in gross unrealized debt portfolio losses.
Figure APPLE INC (FY2025-FY2026 FORM 10-K) ECOSYSTEM: ECONOMICS, SILICON-TO-SERVICES FLYWHEEL & STRATEGIC RISK ARCHITECTURE
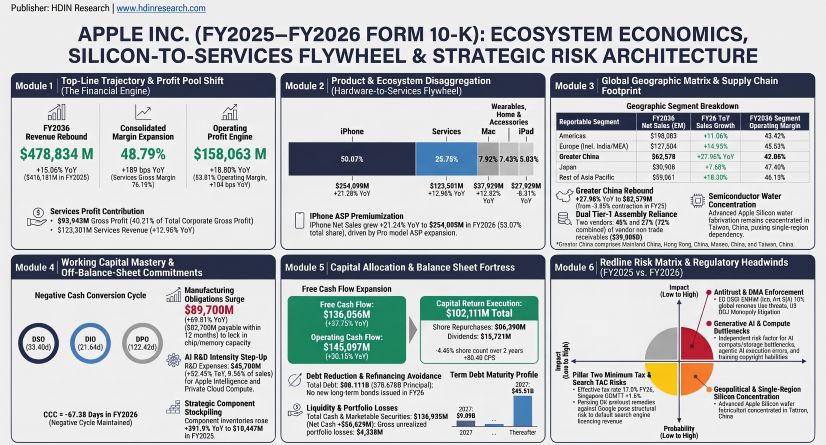 Segmental Realities, Margin Architecture, and Revenue Mix Dynamics
Apple Inc. [NASDAQ: AAPL] reported consolidated net sales of $478.834 billion in FY2026, reflecting an acceleration of 864 basis points compared to the 6.42% top-line growth posted in FY2025. Net income advanced 18.00% year-over-year to $132.175 billion, supported by an operating margin expansion of 104 basis points to 33.01%.
The company's blended gross margin reached 48.79% in FY2026, up from 46.90% in FY2025 and 46.21% in FY2024. Products gross margin rebounded by 251 basis points to 39.28%, recovering from 36.77% in FY2025, driven by an enriched product mix skewed toward iPhone Pro models and cash refunds from U.S. Customs and Border Protection (CBP) following the Supreme Court's February 2026 invalidation of International Emergency Economic Powers Act (IEEPA) tariffs. These credits were accounted for as a direct reduction to Products cost of sales. Services gross margin continued its upward trajectory, widening 78 basis points to 76.19%, generating $93.943 billion in gross profit, or 40.21% of the corporate total.
Table: Consolidated Financial Performance and Margin Architecture (FY2024–FY2026)
| Financial Metric (in $ millions, except per share data) | FY2024 | FY2025 | FY2026 | FY2024–FY2025 YoY (%) / bps | FY2025–FY2026 YoY (%) / bps |
| Products Net Sales | $294,866 | $307,003 | $355,533 | +4.12% | +15.81% |
| Services Net Sales | $96,169 | $109,158 | $123,301 | +13.51% | +12.96% |
| Total Net Sales | $391,035 | $416,161 | $478,834 | +6.42% | +15.06% |
| Products Cost of Sales | $185,233 | $194,116 | $215,874 | +4.79% | +11.21% |
| Services Cost of Sales | $25,119 | $26,844 | $29,358 | +6.87% | +9.37% |
| Total Cost of Sales | $210,352 | $220,960 | $245,232 | +5.04% | +10.98% |
| Consolidated Gross Margin ($) | $180,683 | $195,201 | $233,602 | +8.04% | +19.67% |
| Consolidated Gross Margin (%) | 46.21% | 46.90% | 48.79% | +69 bps | +189 bps |
| Products Gross Margin (%) | 37.18% | 36.77% | 39.28% | -41 bps | +251 bps |
| Services Gross Margin (%) | 73.88% | 75.41% | 76.19% | +153 bps | +78 bps |
| Research & Development (R&D) | $31,370 | $34,550 | $45,765 | +10.14% | +32.46% |
| R&D Intensity (% of Net Sales) | 8.02% | 8.30% | 9.56% | +28 bps | +126 bps |
| Selling, General & Administrative (SG&A) | $26,097 | $27,601 | $29,774 | +5.76% | +7.87% |
| SG&A Intensity (% of Net Sales) | 6.67% | 6.63% | 6.22% | -4 bps | -41 bps |
| Operating Income (EBIT) | $123,216 | $133,050 | $158,063 | +7.98% | +18.80% |
| Operating Margin (%) | 31.51% | 31.97% | 33.01% | +46 bps | +104 bps |
| Income Taxes Provision | $29,749 | $20,719 | $27,062 | -30.35% | +30.61% |
| Effective Tax Rate (%) | 24.09% | 15.61% | 16.99% | -848 bps | +138 bps |
| Net Income | $93,736 | $112,010 | $132,175 | +19.49% | +18.00% |
| Diluted Earnings Per Share ($) | $6.08 | $7.46 | $8.98 | +22.70% | +20.38% |
Hardware revenue expansion was underpinned by the iPhone product category, which increased 21.24% year-over-year in FY2026 to $254.098 billion, representing 53.07% of consolidated net sales. This performance followed a 4.18% gain in FY2025. In disclosures under Item 7 (MD&A), management attributed this acceleration to favorable mix toward premium models, including the iPhone Pro and Pro Max tiers, which increased average selling prices (ASPs). Mac line net sales advanced 12.52% to $37.929 billion, driven by refreshed MacBook Air and MacBook Pro laptops powered by M-series Apple Silicon. iPad net sales contracted 0.34% to $27.929 billion, stabilizing after the 4.98% launch-driven expansion in FY2025. Wearables, Home and Accessories net sales contracted 0.31% to $35.577 billion, following a 3.56% contraction in FY2025.
Table: Product Category and Services Revenue Trajectory (FY2024–FY2026)
| Product / Service Category (in $ millions) | FY2024 | FY2025 | FY2026 | FY2025 YoY (%) | FY2026 YoY (%) | FY2026 Revenue Share (%) |
| iPhone | $201,183 | $209,586 | $254,098 | +4.18% | +21.24% | 53.07% |
| Mac | $29,984 | $33,708 | $37,929 | +12.42% | +12.52% | 7.92% |
| iPad | $26,694 | $28,023 | $27,929 | +4.98% | -0.34% | 5.83% |
| Wearables, Home and Accessories | $37,005 | $35,686 | $35,577 | -3.56% | -0.31% | 7.43% |
| Services | $96,169 | $109,158 | $123,301 | +13.51% | +12.96% | 25.75% |
| Total Net Sales | $391,035 | $416,161 | $478,834 | +6.42% | +15.06% | 100.00% |
Services net sales reached $123.301 billion in FY2026, delivering 12.96% year-over-year growth. The ratio of Services-to-Products revenue stood at 34.68% in FY2026, down slightly from 35.56% in FY2025 due to hardware volume expansion, but up 207 basis points relative to 32.61% in FY2024. Across the FY2024–FY2026 cycle, Services generated $22.893 billion (43.26%) of the company’s $52.919 billion total incremental gross profit. Between FY2024 and FY2025, Services accounted for 77.59% ($11.264 billion) of incremental gross profit. Management identified advertising (comprising search licensing arrangements and App Store search ads) and cloud services as the primary growth drivers, followed by App Store commissions, digital content subscriptions, and payment services.
Geographically, all five reportable segments expanded in FY2026. Greater China (encompassing Mainland China, Hong Kong, China, Macao, China, and Taiwan, China) recorded a net sales rebound of 27.96% to $82.378 billion, reversing the 3.85% contraction logged in FY2025 ($64.377 billion). Regional operating income rose 31.24% to $35.326 billion, expanding segment margin by 107 basis points to 42.88%, aided by foreign exchange appreciation in the Renminbi versus the U.S. Dollar. Europe expanded 14.93% to $127.604 billion, with segment margin rising 254 basis points to 45.53%, driven by iPhone penetration and India market sales. Americas net sales grew 11.06% to $198.083 billion, while Rest of Asia Pacific delivered an 18.30% gain to $39.861 billion, capturing a 284 basis point margin improvement to 46.13%. Japan net sales grew 7.68% to $30.908 billion, though segment operating margin compressed 122 basis points to 47.40%.
Table: Geographic Segment Net Sales and Operating Margin Disaggregation (FY2025–FY2026)
| Reportable Segment (in $ millions) | FY2025 Net Sales | FY2026 Net Sales | YoY (%) | FY2025 Operating Income | FY2026 Operating Income | FY2025 Operating Margin (%) | FY2026 Operating Margin (%) | YoY Margin Variance (bps) |
| Americas | $178,353 | $198,083 | +11.06% | $72,480 | $86,008 | 40.64% | 43.42% | +278 bps |
| Europe (incl. India, Middle East, Africa) | $111,032 | $127,604 | +14.93% | $47,739 | $58,098 | 42.99% | 45.53% | +254 bps |
| Greater China | $64,377 | $82,378 | +27.96% | $26,917 | $35,326 | 41.81% | 42.88% | +107 bps |
| Japan | $28,703 | $30,908 | +7.68% | $13,955 | $14,650 | 48.62% | 47.40% | -122 bps |
| Rest of Asia Pacific | $33,696 | $39,861 | +18.30% | $14,586 | $18,386 | 43.29% | 46.13% | +284 bps |
| Corporate Unallocated Expenses | — | — | — | -$42,627 | -$54,405 | — | — | — |
| Consolidated Total | $416,161 | $478,834 | +15.06% | $133,050 | $158,063 | 31.97% | 33.01% | +104 bps |
Under ASC 606 revenue accounting schedules, total deferred revenue rose 8.03% to $14.800 billion at FY2026 year-end, following a 7.03% increase to $13.700 billion in FY2025 and $12.800 billion in FY2024. Current deferred revenue rose to $9.636 billion (from $9.055 billion in FY2025 and $8.249 billion in FY2024), while non-current deferred revenue increased 11.17% to $5.164 billion (from $4.645 billion in FY2025 and $4.551 billion in FY2024). In FY2026, the company recognized $8.717 billion of revenue that was included in the deferred revenue balance at the beginning of the fiscal year, representing 7.07% of total annual Services revenue, compared to $8.229 billion in FY2025 and $7.728 billion in FY2024.
The projected realization timeline remained consistent: 65% of total deferred revenue is scheduled for recognition within one year ($9.620 billion), 22% within one to two years, 11% within two to three years, and 2% thereafter. Note 2 disclosures confirmed that standalone selling price (SSP) allocation methodologies were unchanged, though "Siri AI" was integrated alongside iCloud, Siri, and Maps into product-related bundled service obligations.
Channel marketing accruals signaled strong product sell-through. Note 7 disclosures showed accrued distribution and marketing liabilities contracted 21.58% to $6.994 billion at FY2026 year-end, down from $8.919 billion in FY2025. This decrease coincided with a 15.81% increase in hardware sales, demonstrating minimal reliance on carrier subsidies or price protection concessions. Concurrently, income taxes payable fell 59.38% to $5.287 billion from $13.016 billion in FY2025, reflecting tax litigation distributions, while other current liabilities increased 21.13% to $53.843 billion from $44.452 billion.
Balance Sheet Velocity, Working Capital Optimization, and Liquidity Structure
Apple maintained a negative cash conversion cycle (CCC) of -67.38 days in FY2026, following -71.07 days in FY2025 and -75.83 days in FY2024. Days payable outstanding (DPO) expanded 7.02 days to 122.42 days, allowing the company to fund working capital through trade credit. Days sales outstanding (DSO) improved by 1.49 days to 33.40 days, compared to 34.89 days in FY2025 and 31.19 days in FY2024, as accounts receivable reached $43.817 billion.
Total inventories rose 154.30% to $14.541 billion in FY2026 from $5.718 billion in FY2025. This increase was driven by component stockpiling, with component inventories climbing 391.85% to $10.447 billion from $2.124 billion, while finished goods increased 13.91% to $4.094 billion from $3.594 billion. This shift caused DIO to increase by 12.19 days to 21.64 days. Management executed this inventory build to hedge against upstream pricing escalation in advanced memory modules and leading-edge semiconductor wafers.
Apple held total cash, cash equivalents, and marketable securities of $136.935 billion at FY2026 year-end, compared to $132.420 billion in FY2025 and $156.650 billion in FY2024. The portfolio had an adjusted amortized cost of $140.970 billion, resulting in a net unrealized loss position of $4.035 billion. Gross unrealized losses expanded 43.31% to $4.338 billion in FY2026 from $3.027 billion in FY2025, driven by yield curve shifts affecting long-duration fixed-rate corporate debt and mortgage-backed/asset-backed securities (MBS/ABS). Gross unrealized gains declined to $303 million from $736 million.
Table: Cash, Marketable Securities, and Liquidity Risk Portfolio (FY2025–FY2026)
| Asset Class & Security Category (in $ millions) | FY2025 Cost | FY2025 Fair Value | FY2025 Net Gain / (Loss) | FY2026 Cost | FY2026 Fair Value | FY2026 Net Gain / (Loss) | Portfolio Share FY2026 (%) |
| Cash & Cash Equivalents | $35,934 | $35,934 | $0 | $36,305 | $36,305 | $0 | 26.51% |
| Current Marketable Securities | $17,909 | $18,763 | +$854 | $19,266 | $20,417 | +$1,151 | 14.91% |
| Non-Current Marketable Securities | $80,868 | $77,723 | -$3,145 | $85,399 | $80,213 | -$5,186 | 58.58% |
| Total Portfolio | $134,711 | $132,420 | -$2,291 | $140,970 | $136,935 | -$4,035 | 100.00% |
| — Gross Unrealized Gains | — | — | +$736 | — | — | +$303 | — |
| — Gross Unrealized Losses | — | — | -$3,027 | — | — | -$4,338 | — |
| Security Type Breakdown: | |||||||
| — U.S. Treasury Securities | $16,074 | $15,848 | -$226 | $19,413 | $18,907 | -$506 | 13.81% |
| — Corporate Debt Securities | $47,210 | $46,560 | -$650 | $48,229 | $46,935 | -$1,294 | 34.28% |
| — Mortgage- & Asset-Backed (MBS/ABS) | $24,130 | $23,004 | -$1,126 | $24,678 | $22,789 | -$1,889 | 16.64% |
| — Agency, Non-U.S. Govt & Other | $19,030 | $18,741 | -$289 | $16,041 | $15,613 | -$428 | 11.40% |
| — Cash & Equivalents (Base Component) | $35,934 | $35,934 | $0 | $36,305 | $36,305 | $0 | 26.51% |
Of non-MBS marketable debt securities, 82% mature within one to five years, 15% within five to ten years, and 3% beyond ten years. Conversely, 63% of the MBS/ABS portfolio carries durations exceeding ten years, down from 73% at FY2025 year-end. Under Item 7A market sensitivity models, an immediate 100 basis point parallel rate increase would generate an estimated $2.608 billion fair value decline across the portfolio, compared to $2.416 billion in FY2025, while expanding annual debt interest expense by $95 million, down from $129 million in FY2025.
Total debt principal was actively reduced to avoid refinancing legacy low-coupon debt at higher rates. Total outstanding debt (term debt plus commercial paper) fell to $80.111 billion in FY2026, down from $98.657 billion in FY2025 and $106.629 billion in FY2024. Commercial paper balances were trimmed to $1.997 billion (weighted rate of 3.80%) from $7.979 billion (weighted rate of 4.19%) in FY2025 and $9.967 billion in FY2024.
The company issued no new long-term bonds in FY2026, deploying operating cash flow to repay $12.396 billion in maturing debt principal. Term debt principal totaled $78.678 billion across effective rates ranging from 0.56% to 5.13%, down from $91.281 billion in FY2025. Net cash reached +$56.824 billion, compared to +$33.763 billion in FY2025 and +$50.021 billion in FY2024.
Foreign exchange risk management expanded derivative exposure. Aggregate notional derivatives rose 18.70% to $203.839 billion at FY2026 year-end from $171.726 billion in FY2025. Derivatives designated as accounting cash flow hedges surged 46.50% to $91.774 billion from $62.647 billion, hedging forecasted non-dollar revenues and component procurement. Non-designated accounting contracts reached $112.065 billion, up 2.74% from $109.079 billion. Under a Monte Carlo Value-at-Risk (VaR) model (95% confidence interval, one-day holding period), maximum expected fair value loss declined to $560 million from $590 million in FY2025.
Free cash flow grew 37.75% to $136.056 billion in FY2026, driven by a 30.15% increase in operating cash flow to $145.097 billion ($111.482 billion in FY2025 and $118.254 billion in FY2024), while capital expenditures declined 28.89% to $9.041 billion ($12.715 billion in FY2025 and $9.447 billion in FY2024). Capital distributions reached $102.111 billion, comprising $86.390 billion in share repurchases ($90.711 billion in FY2025 and $94.949 billion in FY2024) and $15.721 billion in cash dividends ($15.421 billion in FY2025 and $15.234 billion in FY2024).
Weighted-average diluted shares declined 1.89% in FY2026 to 14,720,306 thousand, following a 2.62% reduction in FY2025 to 15,004,697 thousand and 15,408,095 thousand in FY2024, a two-year reduction of 687,789 thousand shares (4.46%). Ending shares outstanding totaled 14,532,259 thousand. Holding share counts constant at FY2024 levels, FY2026 diluted EPS would have been $8.58; the share count reduction contributed $0.40 per share, or 4.66% of reported EPS ($8.98).
DuPont analysis indicated an average Return on Equity (ROE) of 142.26% in FY2026, compared to 171.42% in FY2025 and 157.41% in FY2024. Ending equity ROE was 117.92%, down from 151.91% in FY2025 and 164.59% in FY2024. This change was driven by equity multiplier compression from 6.15x in FY2024 to 5.50x in FY2025 and 4.35x in FY2026, as retained earnings growth outpaced buyback reductions, while net profit margin expanded from 23.97% in FY2024 to 26.92% in FY2025 and 27.60% in FY2026, and asset turnover improved from 1.071x to 1.158x and 1.184x.
Supply Chain Footprint, Off-Balance Sheet Obligations, and Component Control
Apple operates an outsourced manufacturing structure, relying on partners across Mainland China, India, Vietnam, and Taiwan, China, along with component suppliers in Japan, South Korea, and the United States. Mainland China anchors primary final assembly and high-precision tooling for iPhone, Mac, and iPad devices, with long-lived assets totaling $3.617 billion in FY2025.
India serves as an expanding manufacturing base focused on iPhone assembly, Vietnam handles AirPods and Apple Watch production along with iPad subassemblies, and Taiwan, China hosts wafer fabrication facilities for custom Apple Silicon processors on advanced nodes, alongside advanced optical component production.
Table: Global Production Footprint and Facility Network
| Geographic Region | Core Product Lines / Operational Responsibilities | Balance Sheet Exposure & Structural Risk |
| China | Complex assembly for iPhone, Mac, iPad; precision tooling | Long-lived assets of $3.617B (FY2025); centralized integration. |
| Taiwan, China | Wafer fabrication for Apple Silicon (A/M series); optics | Single-source advanced fabrication; geopolitical risk. |
| India | iPhone final assembly and local domestic distribution | Strategic expansion hub; infrastructure constraints. |
| Vietnam | AirPods, Apple Watch assembly; iPad subassemblies | Core audio/wearables hub; engineering transfer execution. |
| United States / Japan / South Korea | Custom memory modules, display panels, testing equipment | Upstream component dependencies and pricing exposure. |
To maintain oversight of component quality, Apple purchases critical customized parts (including custom silicon, OLED displays, and memory modules) from Tier-1 suppliers and resells them to contract manufacturers. This mechanism generated $39.896 billion in vendor non-trade receivables at FY2026 year-end, up 20.24% from $33.180 billion in FY2025 and $32.833 billion in FY2024. Concentration remained high, with the two largest contract manufacturing partners accounting for 45% and 27% (72% combined) of total vendor non-trade receivables at FY2026 year-end, compared to 46% and 23% (69% combined) in FY2025.
Note 14 segment disclosures confirmed that direct sales channels (Apple Store retail locations, online stores, and enterprise direct teams) generated approximately 40% of net sales in both FY2025 and FY2026, while indirect channels (cellular network carriers, retailers, and wholesalers) accounted for 60%. No single non-governmental customer represented 10% or more of net sales in either fiscal year; only the United States and China individually accounted for more than 10% of revenue.
On the receivables side, Note 4 disclosed that a single customer represented 13% of trade accounts receivable at FY2026 year-end, up from 12% in FY2025. Cellular network carriers collectively accounted for 33% of trade receivables in FY2026, compared to 34% in FY2025.
Forward-looking commitments expanded across off-balance sheet and contractual obligations. Manufacturing purchase obligations disclosed in Item 7 rose 59.61% to $89.700 billion at FY2026 year-end, up from $56.200 billion in FY2025. Of this total, $82.700 billion (92.20%) is payable within 12 months (compared to $55.400 billion in FY2025), with $7.000 billion due beyond 12 months, up 775.00% from $800 million. These obligations reflect advance capacity reservations for leading-edge foundry wafers, memory inventory, and assembly capacity.
Under Note 13 disclosures, unconditional purchase obligations rose 86.68% to $24.844 billion from $13.308 billion in FY2025. Within these obligations, $6.712 billion is due in FY2027 (compared to $4.752 billion due in FY2026 as of FY2025 year-end), $11.933 billion is due across FY2028–FY2029 (up 109.76% from $5.689 billion), $5.672 billion is due across FY2030–FY2031 (up 170.87% from $2.094 billion), and $527 million is due thereafter, down 31.82% from $773 million.
In Item 7, broader other purchase obligations reached $27.300 billion, up 84.46% from $14.800 billion in FY2025. Of this balance, $9.900 billion is payable within 12 months (up 41.43% from $7.000 billion), while non-current commitments due beyond 12 months rose 123.08% to $17.400 billion from $7.800 billion, securing third-party cloud compute infrastructure, data center bandwidth, and streaming content licenses.
Note 6 disclosed that licensed intangible assets grew to $29.582 billion gross (up 84.18% from $16.061 billion in FY2025) and $20.943 billion net (up 128.16% from $9.179 billion in FY2025), reflecting intellectual property acquisitions, patent cross-licenses, and long-term content amortization assets.
On the asset side, other current assets expanded 29.45% to $18.881 billion in FY2026 from $14.585 billion. Other non-current assets grew 7.55% to $78.116 billion from $72.634 billion. This line item included $57.737 billion in core long-term supply chain prepayments and supplier tooling financing (up 11.34% from $51.857 billion in FY2025), alongside $20.379 billion in deferred tax assets (down 1.92% from $20.777 billion).
Gross Property, Plant and Equipment (PP&E) expanded 3.25% to $129.935 billion from $125.848 billion. Machinery, equipment, and internal-use software totaled $84.379 billion, up 1.15% from $83.420 billion, with a portion placed at manufacturing partner facilities. Land and buildings grew 7.60% to $29.413 billion from $27.337 billion, reflecting data center and corporate facility development, while leasehold improvements rose 6.97% to $16.143 billion from $15.091 billion.
Accumulated depreciation rose 2.42% to -$77.851 billion from -$76.014 billion, bringing Net PP&E to $52.084 billion, up 4.51% from $49.834 billion. Annual depreciation expense increased 8.75% to $8.700 billion from $8.000 billion.
Total right-of-use (ROU) lease assets stood at $12.815 billion in FY2026, comprising $11.636 billion in operating leases and $1.179 billion in finance leases. Total lease liabilities rose 4.72% to $14.368 billion from $13.720 billion, split between $12.912 billion in operating leases ($1.554 billion current, $11.358 billion non-current) and $1.456 billion in finance leases. The weighted-average remaining lease term was 9.7 years, with the weighted-average discount rate rising 20 basis points to 3.60%. Uncommenced lease commitments reached $644 million, up 23.14% from $523 million in FY2025.
Regulatory Enforcement, Pillar Two Tax Pressures, and Governance Realignment
Apple is navigating several global antitrust and legal matters. In the United States, the Department of Justice (DOJ) and multiple state attorneys general initiated antitrust litigation in March 2024 (District of New Jersey), alleging monopolization across performance smartphones. The matter remains in discovery, accompanied by consolidated private class actions.
In Europe, the European Commission issued a €500 million fine and a cease-and-desist order on April 23, 2025, alleging anti-steering infringements under Digital Markets Act (DMA) Article 5(4), a decision Apple has appealed. Concurrently, the Commission issued preliminary findings under DMA Article 6(4) regarding new developer fee schedules and alternative app marketplaces. Under statutory provisions, non-compliance penalties may reach up to 10% of global annual turnover, or $47.883 billion based on FY2026 net sales.
In Epic Games, Inc. v. Apple Inc., following a December 2025 Ninth Circuit ruling permitting Apple to levy modified commissions on external link-out transactions, the U.S. Supreme Court granted certiorari on June 30, 2026, to review standards governing civil contempt proceedings. In the Google search antitrust action, a September 2025 remedies hearing in the District of Columbia examined potential restrictions on default search placement payments, which could impact Apple's high-margin licensing revenues.
In Notes 12 and 13 (Contingencies), management maintained that no reasonable possibility of material loss greater than recorded accruals existed. Consequently, no major contingency reserves were recorded on the balance sheet. However, disclosures under Item 3 and Item 1A cautioned that an adverse ruling in any single matter could materially adversely affect operating results or cash flows in a given reporting period.
Corporate tax accounting incorporated FASB ASU 2023-09 disclosures in FY2026, detailing geographic tax provisions. Pre-tax income rose to $159.237 billion in FY2026 ($63.732 billion domestic / 40.03%, $95.505 billion foreign / 59.97%), up from $132.729 billion in FY2025 ($50.722 billion domestic, $82.007 billion foreign) and $123.485 billion in FY2024 ($46.169 billion domestic, $77.316 billion foreign). The effective tax rate was 16.99% in FY2026, compared to 15.61% in FY2025 and 24.09% in FY2024.
The implementation of OECD Pillar Two rules directly increased tax liabilities. Singapore statutory incentives reduced tax expense by $5.492 billion (-3.45%), but the introduction of the Singapore Qualified Domestic Minimum Top-up Tax (QDMTT) added $2.510 billion (+1.58%) to the tax provision to meet the 15% minimum rate. Net cash paid for income taxes in FY2026 totaled $19.011 billion to the U.S. federal government, $4.956 billion to Ireland, and $3.253 billion to Singapore.
Regarding the European Commission State Aid decision, which resulted in a €13 billion assessment, Note 4 confirmed that the $15.800 billion escrow asset held at FY2024 year-end ($2.600 billion restricted cash and $13.200 billion restricted marketable securities) was transferred to the Irish government during FY2025. This transfer fully resolved the claim and reduced the balance sheet restricted asset balance to zero.
Gross unrecognized tax benefits (UTBs) totaled $22.487 billion at FY2026 year-end, down from $23.242 billion in FY2025 and $22.038 billion in FY2024. In FY2026, UTB additions for current-year positions were $4.068 billion, offset by prior-year position decreases of $2.827 billion, settlements of $264 million, and statute expirations of $2.999 billion. If recognized, $10.600 billion of the UTB balance would reduce the effective tax rate.
Executive succession moved forward during the period. The FY2026 Form 10-K (filed November 3, 2026) was signed by John Ternus as Chief Executive Officer and Director. Timothy D. Cook transitioned to Executive Chair of the Board, while Arthur D. Levinson moved from Chair of the Board to Lead Independent Director. Kevan Parekh served as Senior Vice President, Chief Financial Officer across both fiscal years. Ben Borders signed as Principal Accounting Officer in FY2026, having succeeded Chris Kondo on January 1, 2026.
Item 9B disclosures in FY2026 noted that Deirdre O'Brien (Senior Vice President, Retail + People) adopted a Rule 10b5-1 trading arrangement on August 24, 2026, covering potential share sales through December 2027. Ernst & Young LLP issued unqualified audit opinions on the consolidated financial statements and internal control over financial reporting (ICFR) for both fiscal years.
Workforce productivity showed modest headcount expansion paired with higher output. Full-time equivalent employees increased by 1,000 (0.60%) to 167,000 in FY2026 from 166,000 in FY2025. Driven by top-line gains, revenue per employee rose 14.37% to $2,867,269 from $2,506,994 in FY2025, while net income per employee grew 17.30% to $791,467 from $674,759.
Share-based compensation (SBC) rose 7.20% to $13.789 billion in FY2026, moderating from a 10.05% increase to $12.863 billion in FY2025 ($11.688 billion in FY2024). SBC represented 2.88% of net sales and 9.50% of operating cash flow. To mitigate dilution, Apple directed $6.900 billion in FY2026 and $6.100 billion in FY2025 to cash tax withholdings for equity award settlements.
Item 1A risk disclosures expanded to cover generative artificial intelligence and agentic architectures. Revisions in FY2026 added sections addressing cloud compute capacity, memory availability, data center water and power constraints, non-deterministic risks associated with agentic systems executing autonomous workflows, and copyright litigation surrounding training data. These operational risks were linked to the company's $45.765 billion R&D budget (up 32.46% in FY2026 from $34.550 billion in FY2025), which was directed toward internal Apple Silicon, private cloud data center infrastructure, and system engineering.
HDIN Institutional Verdict
Apple Inc.’s FY2026 disclosures demonstrate operating execution, characterized by gross margin expansion to 48.79%, $136.056 billion in free cash flow, and a negative cash conversion cycle of -67.38 days. The executive transition from Timothy D. Cook to John Ternus as Chief Executive Officer was completed alongside stable internal accounting controls.
However, the company faces structural friction across two fronts:
First, forward-looking commitments have expanded rapidly. Off-balance sheet manufacturing purchase obligations reached $89.700 billion (with $82.700 billion due within 12 months), unconditional purchase obligations totaled $24.844 billion, other purchase obligations grew to $27.300 billion, and component inventories expanded 391.85% to $10.447 billion. This commitment of more than $140 billion in capital assets, inventory buffers, and purchase agreements secures component capacity for Apple Intelligence and custom silicon, but introduces cancellation penalty exposure if high-end replacement cycles slow. Additionally, vendor non-trade receivables of $39.896 billion remain concentrated, with 72% tied to two contract assemblers.
Second, regulatory scrutiny of ecosystem revenue models is intensifying. European DMA enforcement has resulted in initial fines and potential penalties up to 10% of global revenue, alongside requirements to open core interfaces. Concurrently, DOJ antitrust litigation, the Epic Games Supreme Court review, and regulatory pressure on Google search licensing payments pose risks to Services monetization. In addition, Pillar Two minimum taxes, such as Singapore's QDMTT ($2.510 billion impact), are beginning to compress overseas tax incentives.
While negative working capital dynamics, high Services margins, and a $56.824 billion net cash balance provide operational stability, the growth model is increasingly reliant on sustained premium pricing and capital deployment to manage regulatory, supply chain, and computational pressures.
Presentation Download & Video Access:
- Presentation Download: Click the PDF download link under 'Related Topics' to access the full institutional presentation of this report.
- Video Link: Click this link to watch the HDIN analyst briefing on YouTube.
About HDIN Research:
HDIN Research is a premier global market intelligence and strategic advisory firm specializing in institutional-grade financial analysis, supply chain audits, and macroeconomic forecasting. Our dedicated sector analysts deliver actionable, data-driven insights tailored for private equity, hedge funds, and corporate strategy teams. Visit us at http://www.hdinresearch.com.
2026 AI Transparency Footer:
"This intelligence report was authored by HDIN Research analysts following a rigorous audit of official corporate filings. AI was utilized for massive-scale data synthesis and structural drafting, ensuring 100% inclusion of reported data points. All strategic insights, financial modeling, and final verdicts were verified by our editorial board to ensure professional accuracy and compliance with 2026 Google Search E-E-A-T standards."