Agility Robotics S-1 Analysis: Margin & De-SPAC | HDIN
Date : 2026-11-17
Reading : 172
BEIJING — HDIN Market Intelligence Brief | Audited by HDIN Equity Research Desk | Source Filing: Form S-1 Registration Statement (FY2024, FY2025 & H1 2026)
HDIN Executive Takeaways
1. Pre-Commercial Margin Deficit: Agility Robotics, Inc. [NYSE: CCXI / Form S-1 Filing] recorded FY25 revenue of $1.78M (+474.8% YoY) before contracting 72.2% YoY to $0.17M in H1 2026, generating a -2,135.1% gross margin (-$3.72M) and a -$362.68M operating loss distorted by $252.5M in mark-to-market stock compensation.
2. De-SPAC Liquidity Extension: Closing its November 4, 2026 merger with Churchill Capital Corp XI injected $447.22M in pro forma cash, curing a 1.1-month going-concern deficit and funding 10.1 quarters of runway ($44.37M/quarter FCF burn) for Digit 5 scaling at the 10,000-unit/year Salem RoboFab facility.
3. Institutional Verdict: A 34.0% dilutive overhang (82.23M shares, including 26.58M Amazon warrants at $0.93), zero-day lock-ups on 20.10M PIPE shares, and $125M in impending Robot-as-a-Service (RaaS) balance sheet capitalization point toward a secondary financing window in H1 2028.
Figure Agility Robotics Inc Form S-1 Deep-Dive
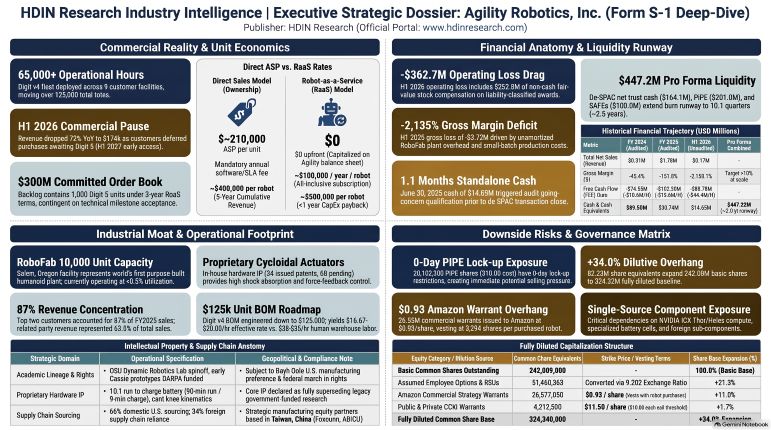 Agility Robotics FY25 and H1 2026 Segmental Performance and Margin Dynamics
Agility Robotics, Inc. [NYSE: CCXI] (formerly Churchill Capital Corp XI prior to its November 4, 2026 domestication and reverse recapitalization with Legacy Agility) operates as a single reportable segment under FASB ASC Topic 280, with the Chief Executive Officer acting as the Chief Operating Decision Maker (CODM). Top-line net revenue expanded 474.8% YoY from $310k ($0.31M) in FY24 to $1,782k ($1.78M) in FY25, but contracted 72.2% YoY in H1 2026 to $174k ($0.17M) compared to $625k ($0.63M) in H1 2025. Bottom-line net loss widened 95.7% YoY from -$70.55M in FY24 to -$138.09M in FY25, and expanded 403.9% YoY in H1 2026 to -$361.89M (versus -$71.81M in H1 2025).
The H1 2026 top-line contraction occurred because H1 2025 included $0.5M of one-time legacy Digit v4 robot sales that did not recur as customers deferred deliveries ahead of the Digit 5 platform launch (unveiled September 15, 2026, with customer early access scheduled for H1 2027). Revenue remains highly concentrated among strategic equity partners: related-party revenue accounted for 63.5% ($1,132k / $1.13M) of FY25 net sales and 69.5% ($121k) of H1 2026 net sales. In FY24, two customers accounted for 52.1% of total revenue ($161,750) and represented over 10% of year-end accounts receivable (A/R). In FY25, two customers generated 87.0% of total revenue ($1,550,360), while four customers each exceeded 10% of year-end A/R balances.
Table: Consolidated Statements of Operations and Year-over-Year Performance, FY2024–FY2025 and H1 2025–H1 2026 (USD Thousands)
Forensic P&L Audit: Negative Gross Margins, Liability-Classified SBC, and R&D Expensing
Cost of Goods Sold (COGS) rose 866.0% YoY (+$4.01M) in FY25 to $4.47M, driven by $2.1M in direct labor and unabsorbed factory overhead at the Salem RoboFab facility, $1.6M in direct product costs from unit sales, and $0.4M in RaaS deployment expenses. In H1 2026, COGS reached $3.89M against $174k in revenue, compressing gross margin by 193,810 bps YoY to -2,135.1% (-$3.72M gross loss).
Operating expenses in H1 2026 ($358.97M) were severely distorted by $252.5M in non-cash stock-based compensation (SBC) expense ($130.8M recognized in R&D and $121.4M in SG&A). Under US GAAP (ASC 718), options issued under Legacy Agility's 2015 Incentive Plan contained contractual company repurchase rights on exercised shares, forcing their classification as an "Award Liability" ($38.22M total liability at year-end FY25, comprising $4.01M current and $34.21M non-current liabilities). As pre-merger equity valuation rose toward the $2.50B SPAC transaction benchmark, Black-Scholes mark-to-market remeasurement triggered the $252.5M non-cash charge. Stripping out this mark-to-market distortion, core cash-based operating expenses in H1 2026 were approximately $106.5M ($359.0M less $252.5M), compared to ~$69.5M in H1 2025. Upon closing the public merger, repurchase provisions lapsed, reclassifying the award liability permanently into Additional Paid-In Capital (APIC).
An audit of Note 2 (Summary of Significant Accounting Policies) confirms strict expense recognition with zero earnings manipulation via R&D capitalization:
* Software Development (ASC 350-40 / ASC 730): 100% of software engineering costs for the Agility Arc cloud platform and onboard Embodied AI are expensed immediately as incurred ($0 capitalized internal-use software).
* Prototype Materials & Inventory Obsolescence (ASC 730-10 / ASC 330-10): Material purchases solely for R&D with no alternative future use were expensed directly to R&D ($2,309,345 in FY24; $2,326,549 in FY25). Excess and obsolete inventory write-downs for phased-out legacy Digit components were also charged directly to R&D ($137,191 in FY24; $2,162,684 in FY25).
* Goodwill & Intangibles (ASC 805 / ASC 350): $0 reported across all historical and pro forma periods, as the CCXI merger was accounted for as a reverse recapitalization.
Table: Cash Flow, Inventory, and Property, Plant & Equipment (PP&E) Analysis, FY2024–FY2025 and H1 2025–H1 2026 (USD)
Commercial Monetization Architecture, Unit Economics, and Labor TCO Arbitrage
Agility monetizes its hardware-software stack across four revenue streams under ASC 606: Robot-as-a-Service (RaaS), Direct Equipment Sales, the Customer Acceleration Program (CAP), and Maintenance/Support Services. Through value-engineering and localizing 66% of its supply chain in the US, Agility reduced the unit Bill of Materials (BOM) for Digit v4 to ~$125,000 and applies identical Design-for-Manufacturing (DFM) targets to Digit 5 to target >70% product gross margins at scale.
RoboFab Infrastructure Footprint, Capex Allocation, and Regional Supply Chain Moats
Agility operates a vertically integrated design and manufacturing footprint anchored in the United States, which holds 100% of capitalized PP&E. Primary production occurs at RoboFab (4698 Truax Drive SE, Salem, Oregon), the world's first purpose-built humanoid manufacturing plant with a nameplate capacity of 10,000 units per year. However, current utilization sits below 0.1% (<1.0% in FY24–FY25; <0.5% in H1 2026), with only 5 functional Digit 5 prototype units built as of September 2026. To support software and neural policy training, Agility opened its Physical AI Hub in Fremont, California in July 2026 (housing hardware-in-the-loop [HIL] testing rigs), complementing engineering offices in Pittsburgh, Pennsylvania and San Jose, California.
As of May 2026, the commercial fleet of legacy Digit v4 units is deployed across 9 customer facilities, logging >65,000 cumulative commercial operating hours and moving >125,000 totes in live industrial environments. Key deployments include GXO Logistics (>100,000 totes moved as of November 2025 at ~98% on-task accuracy) and Schaeffler AG (~25,000 totes moved across multiple plants at ~98% operational accuracy). Schaeffler acts simultaneously as a strategic investor, customer, and tier-1 vendor (Agility paid Schaeffler $398,831 in FY24 and $416,679 in FY25—totaling $815,510—for industrial components).
Full-Stack Architecture, Single-Source Supply Chain Bottlenecks, and Peer Benchmarking
Digit 5 upgrades Digit v4 (5.5 ft tall, ~140 lb weight, 35 lb payload, 4-hour runtime, 2:1 run-to-charge ratio) to a 5'11" (1.81 m), 284 lb (129 kg) frame with a 50 lb (22.7 kg) payload (+40%) and 7.2 ft (2.2 m) vertical reach (+30%). It integrates proprietary cycloidal actuators, modular end-effectors, and an exclusive humanoid-sector fast-charge battery delivering 90 minutes of runtime on a 9-minute charge (10:1 run-to-charge ratio, enabling >20 hours uptime/day). Onboard Physical AI runs on NVIDIA IGX Thor and Halos Core (as NVIDIA's inaugural humanoid partner for Halos for Robotics), orchestrated via the cloud-based Agility Arc fleet OS (WMS/MES integration, OTA updates, teleoperation). In September 2026, Agility signed an MOU with FORT Robotics, Inc. to integrate an offboard safety bridge.
Table: Critical Robot Subsystems, Technology Ownership, Sourcing Dependencies, and Supply Chain Vulnerability Assessment
Founded in 2015 as a spinoff from Oregon State University's (OSU) Dynamic Robotics Laboratory by Dr. Jonathan Hurst (following 2016's Cassie and 2017's Digit v1), Agility's early research received Defense Advanced Research Projects Agency (DARPA) funding. Under the federal Bayh-Dole Act (35 U.S.C. § 200 et seq.), early inventions carry U.S. domestic manufacturing preferences and federal "march-in" rights (allowing government-mandated third-party licensing), plus ongoing university in-license diligence and royalty obligations (expensed as incurred, with $0 capitalized patent assets). As of June 30, 2026, Agility holds 34 issued patents (32 U.S., 2 foreign), 68 pending patent applications (61 U.S. non-provisional, 2 foreign, 5 PCT), 31 registered trademarks (13 U.S., 18 foreign), and 8 U.S. pending trademarks.
Table: Competitive Benchmarking of Leading Humanoid Robotics Platforms: Technical Capabilities, Commercial Applications, and Manufacturing Readiness
Beyond humanoid peers (which also include 1X Technologies, Sanctuary AI, Hexagon, and NEURA Robotics), Agility faces intense substitution threat from conventional automation: Autonomous Mobile Robots (AMRs/AGVs like Geek+, Fetch, and Locus costing $20k–$40k per unit with 8–12 hour runtimes), Fixed Automated Storage and Retrieval Systems (ASRS and conveyors offering 99.999% five-nines uptime), and stationary articulated pick-and-place workcells (Fanuc, ABB, KUKA operating at >600 picks/hour).
HDIN Institutional Verdict: Narrative vs. Operational Reality
Management's strategic narrative centers on a $2.50B pre-money equity valuation, a >$300M committed backlog (1,000 Digit 5 units), and >70% target gross margins. However, a forensic cross-examination of the Form S-1 footnotes exposes four structural disconnects between promotional guidance and operational reality:
Valuation, Dilution Overhang, and Secondary Market Unlock Mechanics
On February 2024, Michael Klein's Churchill Sponsor XI LLC formed CCXI in the Cayman Islands, completing its IPO on March 7, 2025 (41,400,000 units at $10.00/unit, placing $414.0M in trust). Following the July 30, 2026 Merger Agreement and October 31, 2026 shareholder vote—where public shareholders redeemed 25,451,804 shares ($261.8M, a 61.5% redemption rate)—the transaction closed on November 4, 2026. Legacy Agility preferred stock ($400.78M carrying value at June 30, 2026; $395.77M at December 31, 2025, after converting $13.88M of convertible notes into Series C-2 on November 14, 2024) and $100.0M of July 2026 SAFEs converted into common stock at an Exchange Ratio of 9.202 ($400.76M APIC reclassification). CCXI also settled $2.25M in July/August 2026 Sponsor working capital promissory notes via 225,000 shares and 22,500 warrants. Post-closing, Agility holds $0 funded debt and $17.44M in operating lease liabilities ($0.59M current, $16.85M non-current), alongside $447.22M ($447,223k) in pro forma cash (after ~$38.3M in transaction costs, $31.0M paid in cash).
Table: Pro Forma Capitalization, Shareholder Ownership, and Potential Equity Dilution Overhang Analysis
The secondary market faces severe structural selling pressure. First, 20,102,500 PIPE shares (cost basis $10.00 vs. $11.51 recent market price) carry zero lock-up restrictions and represent 126% of the existing 15.95M public float. Second, the $12.00 early lock-up release threshold sits just 4.2% above the $11.51 reference price; sustaining $12.00 for 15 trading days immediately unlocks ~205.6M insider and Sponsor shares (~85% of total basic equity).
Asset Depreciation Mismatch, RaaS Cash Trap, and H1 2028 Refinancing Window
1. Accounting vs. Commercial Lifespan Divergence: Management's commercial unit economics model assumes a 5-year robot useful life ($500,000 cumulative RaaS LTV). However, in Note 2 of the audited financial statements, GAAP requires depreciating deployed robots and spare robot limbs on a straight-line basis over just 3 years (reflecting actuator wear and mechanical stress), with zero standalone Product Warranty Reserves recorded on the balance sheet (warranty liabilities are bundled inside Accrued Expenses of $7.26M at FY25 and $10.05M at H1 2026, and no quantitative MTBF/MTTR metrics are disclosed).
2. Contingent Backlog & Warrant Subsidy: The >$300M backlog (1,000 Digit 5 units over 3 years) is contingent upon passing strict technical milestones and customer acceptance tests. Furthermore, customer acquisition is heavily subsidized by equity: Amazon's warrant for 26,577,050 shares at $0.93/share transfers over $280M in equity value (at $11.51/share) to secure a 1,000-unit deployment commitment.
3. CapEx & RaaS Balance Sheet Drag: While management states RoboFab's modular cellular architecture requires modest CapEx, scaling to 1,000–2,000 units/year requires an estimated $15M–$25M in direct EOL calibration and burn-in test equipment. More critically, because Agility retains asset ownership under RaaS, manufacturing 1,000 units at the $125,000 target BOM requires capitalizing $125.0M directly from inventory into PP&E. With quarterly burn projected to rise from $44.37M to $50M–$55M in H1 2027 plus $60M–$80M in 2027–2028 manufacturing/RaaS outlay, pro forma cash ($447.2M) is projected to fall to ~$270M by Q4 2027 and breach the $100M–$150M liquidity safety threshold in H1 2028 (Q1–Q2 2028), forcing a dilutive Follow-on Offering or convertible debt issuance well ahead of Q4 2028/Q1 2029 cash exhaustion.
Corporate Governance, Related-Party Contracts, and Enterprise Risk Matrix
Agility utilizes a single-class common stock structure (one vote per share) protected by anti-takeover provisions: a 6-member Classified Board staggered into three 3-year classes (Class I to 2027 AGM: Peggy Johnson, Pierre Gentin; Class II to 2028 AGM: Damion Shelton, Derek Aberle; Class III to 2029 AGM: Merline Saintil, Mark Vale), prohibitions on shareholder action by written consent or calling special meetings, and supermajority charter amendment requirements. Non-employee directors receive an initial $450,000 RSU grant.
Key Financial Questions From the FY25 and H1 2026 Form S-1 Filing
What drove Agility Robotics's revenue and margin performance in FY25 and H1 2026?
In FY25, net revenue rose 474.8% YoY to $1.78M (with 63.5% from related parties and 87.0% concentrated in two customers) before dropping 72.2% YoY to $0.17M in H1 2026 as customers paused Digit v4 purchases ahead of the Digit 5 launch. Gross margin deteriorated by 193,810 bps YoY to -2,135.1% (-$3.72M) in H1 2026 due to unabsorbed Salem RoboFab overhead, while operating loss reached -$362.68M following a $252.5M non-cash mark-to-market charge on liability-classified stock options.
How is Agility Robotics allocating capital and expanding its regional infrastructure?
Following its November 4, 2026 merger with Churchill Capital Corp XI, Agility holds $447.22M in pro forma cash ($164.1M trust cash after 61.5% redemptions, $201.0M PIPE, and $100.0M SAFEs less $31.0M cash transaction fees), funding ~10.1 quarters of runway at its $44.37M quarterly FCF burn rate. Capital is allocated toward scaling Digit 5 serial production in H1 2027 at its 10,000-unit/year Salem, Oregon RoboFab plant and training neural policies at its Fremont, California Physical AI Hub, though capitalizing 1,000 RaaS units at a $125,000 BOM will consume $125.0M in balance sheet cash and trigger an H1 2028 refinancing window.
How does the De-SPAC capital structure impact shareholder dilution and secondary market float?
Post-closing basic common stock stands at 242,367,776 shares (with $0 funded debt after converting $400.78M of preferred equity at a 9.202 exchange ratio), but faces an immediate 34.0% dilutive overhang of 82,233,442 shares (51.46M options, 4.21M warrants at $11.50, and 26.56M unvested Amazon warrants at $0.93) plus a 15.0% (36.31M share) 2026 incentive pool. Near-term secondary float is pressured by 20,102,500 PIPE shares (subscribed at $10.00) carrying a 0-day lock-up, alongside an early lock-up release trigger on ~205.6M insider shares if the stock trades at or above $12.00 for 15 out of 30 trading days.
Presentation Download & Analyst Briefing Access:
- Institutional Presentation: Download the full "Agility_Robotics_S-1_Forensic_Analysis" PDF under the 'Related Topics' section.
- Analyst Video Briefing: Watch the "Agility Robotics Form S-1 Strategic Due Diligence" on the HDIN Research YouTube Channel.
About HDIN Research:
HDIN Research is a premier global market intelligence and strategic advisory firm specializing in institutional-grade financial analysis, supply chain audits, and macroeconomic forecasting. Our dedicated sector analysts deliver actionable, data-driven insights tailored for private equity, hedge funds, and corporate strategy teams. Visit us at https://www.hdinresearch.com.
Editorial & Methodology Disclosure:
"This market intelligence brief was researched, modeled, and audited by the HDIN Research Equity Desk based on official primary corporate filings (Agility Robotics, Inc. Form S-1 Registration Statement covering FY2024, FY2025, and H1 2026). Proprietary quantitative extraction tools were utilized to ensure 100% fidelity to reported financial line items and footnotes. All forensic interpretations, segmental benchmarks, and institutional verdicts were independently written and verified by HDIN senior sector analysts in accordance with institutional research standards."
HDIN Executive Takeaways
1. Pre-Commercial Margin Deficit: Agility Robotics, Inc. [NYSE: CCXI / Form S-1 Filing] recorded FY25 revenue of $1.78M (+474.8% YoY) before contracting 72.2% YoY to $0.17M in H1 2026, generating a -2,135.1% gross margin (-$3.72M) and a -$362.68M operating loss distorted by $252.5M in mark-to-market stock compensation.
2. De-SPAC Liquidity Extension: Closing its November 4, 2026 merger with Churchill Capital Corp XI injected $447.22M in pro forma cash, curing a 1.1-month going-concern deficit and funding 10.1 quarters of runway ($44.37M/quarter FCF burn) for Digit 5 scaling at the 10,000-unit/year Salem RoboFab facility.
3. Institutional Verdict: A 34.0% dilutive overhang (82.23M shares, including 26.58M Amazon warrants at $0.93), zero-day lock-ups on 20.10M PIPE shares, and $125M in impending Robot-as-a-Service (RaaS) balance sheet capitalization point toward a secondary financing window in H1 2028.
Figure Agility Robotics Inc Form S-1 Deep-Dive
Agility Robotics FY25 and H1 2026 Segmental Performance and Margin DynamicsAgility Robotics, Inc. [NYSE: CCXI] (formerly Churchill Capital Corp XI prior to its November 4, 2026 domestication and reverse recapitalization with Legacy Agility) operates as a single reportable segment under FASB ASC Topic 280, with the Chief Executive Officer acting as the Chief Operating Decision Maker (CODM). Top-line net revenue expanded 474.8% YoY from $310k ($0.31M) in FY24 to $1,782k ($1.78M) in FY25, but contracted 72.2% YoY in H1 2026 to $174k ($0.17M) compared to $625k ($0.63M) in H1 2025. Bottom-line net loss widened 95.7% YoY from -$70.55M in FY24 to -$138.09M in FY25, and expanded 403.9% YoY in H1 2026 to -$361.89M (versus -$71.81M in H1 2025).
The H1 2026 top-line contraction occurred because H1 2025 included $0.5M of one-time legacy Digit v4 robot sales that did not recur as customers deferred deliveries ahead of the Digit 5 platform launch (unveiled September 15, 2026, with customer early access scheduled for H1 2027). Revenue remains highly concentrated among strategic equity partners: related-party revenue accounted for 63.5% ($1,132k / $1.13M) of FY25 net sales and 69.5% ($121k) of H1 2026 net sales. In FY24, two customers accounted for 52.1% of total revenue ($161,750) and represented over 10% of year-end accounts receivable (A/R). In FY25, two customers generated 87.0% of total revenue ($1,550,360), while four customers each exceeded 10% of year-end A/R balances.
Table: Consolidated Statements of Operations and Year-over-Year Performance, FY2024–FY2025 and H1 2025–H1 2026 (USD Thousands)
| Consolidated Statement of Operations (USD Thousands) | FY 2024 (Audited) | FY 2025 (Audited) | FY YoY Change (%) | H1 2025 (Unaudited) | H1 2026 (Unaudited) | H1 YoY Change (%) |
| Net Sales — Trade | $276 | $650 | +135.5% | $568 | $53 | -90.7% |
| Net Sales — Related Parties | $34 | $1,132 | +3,229.4% | $57 | $121 | +112.3% |
| Total Net Sales (Revenue) | $310 | $1,782 | +474.8% | $625 | $174 | -72.2% |
| Cost of Goods Sold (COGS) | $463 | $4,473 | +866.0% | $1,856 | $3,889 | +109.5% |
| Gross Profit (Loss) | $(153) | $(2,691) | +1,658.8% | $(1,231) | $(3,715) | +201.8% |
| Gross Margin (%) | -49.4% | -151.0% | -10,160 bps (-1,016 bps reported) | -197.0% | -2,135.1% | -193,810 bps |
| Research & Development (R&D) | $53,368 | $91,644 | +71.7% | $44,966 | $200,753 | +346.5% |
| Selling, General & Admin (SG&A) | $16,200 | $45,841 | +183.0% | $26,421 | $158,212 | +498.8% |
| Total Operating Expenses | $69,568 | $137,485 | +97.6% | $71,387 | $358,965 | +402.8% |
| Loss from Operations (EBIT) | $(69,721) | $(140,176) | +101.1% | $(72,618) | $(362,680) | +399.4% |
| Operating Margin (%) | -22,490.6% | -7,866.2% | N/A | -11,618.9% | -208,436.8% | N/A |
| Interest Income | $2,034 | $1,954 | -3.9% | $563 | $975 | +73.2% |
| Interest Expense | $(525) | $0 | -100.0% | $0 | $0 | 0.0% |
| Fair Value Adj. on Convertible Notes | $(2,401) | $0 | -100.0% | $0 | $0 | 0.0% |
| Other Income / (Expense), Net | $61 | $136 | +123.0% | $242 | $(188) | -177.7% |
| Net Loss | $(70,552) | $(138,086) | +95.7% | $(71,813) | $(361,893) | +403.9% |
Forensic P&L Audit: Negative Gross Margins, Liability-Classified SBC, and R&D Expensing
Cost of Goods Sold (COGS) rose 866.0% YoY (+$4.01M) in FY25 to $4.47M, driven by $2.1M in direct labor and unabsorbed factory overhead at the Salem RoboFab facility, $1.6M in direct product costs from unit sales, and $0.4M in RaaS deployment expenses. In H1 2026, COGS reached $3.89M against $174k in revenue, compressing gross margin by 193,810 bps YoY to -2,135.1% (-$3.72M gross loss).
Operating expenses in H1 2026 ($358.97M) were severely distorted by $252.5M in non-cash stock-based compensation (SBC) expense ($130.8M recognized in R&D and $121.4M in SG&A). Under US GAAP (ASC 718), options issued under Legacy Agility's 2015 Incentive Plan contained contractual company repurchase rights on exercised shares, forcing their classification as an "Award Liability" ($38.22M total liability at year-end FY25, comprising $4.01M current and $34.21M non-current liabilities). As pre-merger equity valuation rose toward the $2.50B SPAC transaction benchmark, Black-Scholes mark-to-market remeasurement triggered the $252.5M non-cash charge. Stripping out this mark-to-market distortion, core cash-based operating expenses in H1 2026 were approximately $106.5M ($359.0M less $252.5M), compared to ~$69.5M in H1 2025. Upon closing the public merger, repurchase provisions lapsed, reclassifying the award liability permanently into Additional Paid-In Capital (APIC).
An audit of Note 2 (Summary of Significant Accounting Policies) confirms strict expense recognition with zero earnings manipulation via R&D capitalization:
* Software Development (ASC 350-40 / ASC 730): 100% of software engineering costs for the Agility Arc cloud platform and onboard Embodied AI are expensed immediately as incurred ($0 capitalized internal-use software).
* Prototype Materials & Inventory Obsolescence (ASC 730-10 / ASC 330-10): Material purchases solely for R&D with no alternative future use were expensed directly to R&D ($2,309,345 in FY24; $2,326,549 in FY25). Excess and obsolete inventory write-downs for phased-out legacy Digit components were also charged directly to R&D ($137,191 in FY24; $2,162,684 in FY25).
* Goodwill & Intangibles (ASC 805 / ASC 350): $0 reported across all historical and pro forma periods, as the CCXI merger was accounted for as a reverse recapitalization.
Table: Cash Flow, Inventory, and Property, Plant & Equipment (PP&E) Analysis, FY2024–FY2025 and H1 2025–H1 2026 (USD)
| Cash Flow, Inventory & PP&E Breakdown (USD) | FY 2024 (Audited) | FY 2025 (Audited) | H1 2025 (Unaudited) | H1 2026 (Unaudited) | Accounting & Operational Notes |
| Cash Flow from Operations (CFO) | $(70,657,000) | $(99,839,000) | $(46,244,000) | $(86,162,000) | CFO burn rose +41.3% in FY25 and +86.3% YoY in H1 26 |
| CapEx (Purchase of PP&E) | $(3,898,653) | $(2,545,784) | $(984,000) | $(2,584,000) | H1 26 investing cash flow -
6.63M in H1 25 (bond maturities); H1 26 CapEx up +$1.60M YoY |
| Free Cash Flow (FCF = CFO - CapEx) | $(74,556,000) | $(102,385,000) | $(47,228,000) | $(88,746,000) | Cumulative 2.5-year FCF burn of -$265.69M |
| Quarterly Average FCF Burn | $(18,639,000) | $(25,596,000) | $(23,614,000) | $(44,373,000) | Also cited at $44.24M/quarter in summary disclosures |
| Monthly Average FCF Burn | $(6,213,000) | $(8,532,000) | $(7,871,000) | $(14,791,000) | ~1.0–1.1 months standalone runway at June 30, 2026 ($14,652k cash; $7,100k restricted LOC) |
| Inventories — Raw Materials | $11,061,393 | $11,121,342 | — | — | Supports small-batch assembly and prototyping |
| Inventories — Work in Process (WIP) | $23,092 | $1,750,076 | — | — | Active builds at Salem RoboFab |
| Inventories — Finished Goods | $439,553 | $0 | — | — | Deployed units transferred to PP&E |
| Total Inventories | $11,524,038 | $12,871,418 | — | $11,365,000 | $10,083,435 transferred from inventory to PP&E in FY25 |
| PP&E — Equipment, Robots | $5,442,033 | $14,119,044 | — | — | RaaS fleet, internal test units, and spare robot limbs (3-yr depreciation) |
| PP&E — Equipment, Other | $2,881,575 | $3,462,010 | — | — | Salem factory tooling, machining & test rigs (5-yr depreciation) |
| PP&E — Construction in Progress | $1,592,170 | $2,638,962 | — | — | Unaccepted/in-assembly robots and line fixtures |
| PP&E — Leasehold Improvements | $4,490,986 | $4,938,922 | — | — | Salem RoboFab & Fremont hub buildouts (shorter of lease or useful life) |
| PP&E — Other / Furniture | $133,236 | $159,929 | — | — | Office and auxiliary equipment |
| Total Gross PP&E Cost | $14,540,000 | $25,318,867 | — | — | +74.1% YoY gross asset expansion in FY25 |
| Less: Accumulated Depreciation | $(4,035,115) | $(9,390,758) | — | — | FY25 total depreciation expense reached $4.28M |
| Property & Equipment, Net | $10,504,885 | $15,928,109 | — | $25,180,000 | 100% physically located in the United States |
Commercial Monetization Architecture, Unit Economics, and Labor TCO Arbitrage
Agility monetizes its hardware-software stack across four revenue streams under ASC 606: Robot-as-a-Service (RaaS), Direct Equipment Sales, the Customer Acceleration Program (CAP), and Maintenance/Support Services. Through value-engineering and localizing 66% of its supply chain in the US, Agility reduced the unit Bill of Materials (BOM) for Digit v4 to ~$125,000 and applies identical Design-for-Manufacturing (DFM) targets to Digit 5 to target >70% product gross margins at scale.
RoboFab Infrastructure Footprint, Capex Allocation, and Regional Supply Chain Moats
Agility operates a vertically integrated design and manufacturing footprint anchored in the United States, which holds 100% of capitalized PP&E. Primary production occurs at RoboFab (4698 Truax Drive SE, Salem, Oregon), the world's first purpose-built humanoid manufacturing plant with a nameplate capacity of 10,000 units per year. However, current utilization sits below 0.1% (<1.0% in FY24–FY25; <0.5% in H1 2026), with only 5 functional Digit 5 prototype units built as of September 2026. To support software and neural policy training, Agility opened its Physical AI Hub in Fremont, California in July 2026 (housing hardware-in-the-loop [HIL] testing rigs), complementing engineering offices in Pittsburgh, Pennsylvania and San Jose, California.
As of May 2026, the commercial fleet of legacy Digit v4 units is deployed across 9 customer facilities, logging >65,000 cumulative commercial operating hours and moving >125,000 totes in live industrial environments. Key deployments include GXO Logistics (>100,000 totes moved as of November 2025 at ~98% on-task accuracy) and Schaeffler AG (~25,000 totes moved across multiple plants at ~98% operational accuracy). Schaeffler acts simultaneously as a strategic investor, customer, and tier-1 vendor (Agility paid Schaeffler $398,831 in FY24 and $416,679 in FY25—totaling $815,510—for industrial components).
Full-Stack Architecture, Single-Source Supply Chain Bottlenecks, and Peer Benchmarking
Digit 5 upgrades Digit v4 (5.5 ft tall, ~140 lb weight, 35 lb payload, 4-hour runtime, 2:1 run-to-charge ratio) to a 5'11" (1.81 m), 284 lb (129 kg) frame with a 50 lb (22.7 kg) payload (+40%) and 7.2 ft (2.2 m) vertical reach (+30%). It integrates proprietary cycloidal actuators, modular end-effectors, and an exclusive humanoid-sector fast-charge battery delivering 90 minutes of runtime on a 9-minute charge (10:1 run-to-charge ratio, enabling >20 hours uptime/day). Onboard Physical AI runs on NVIDIA IGX Thor and Halos Core (as NVIDIA's inaugural humanoid partner for Halos for Robotics), orchestrated via the cloud-based Agility Arc fleet OS (WMS/MES integration, OTA updates, teleoperation). In September 2026, Agility signed an MOU with FORT Robotics, Inc. to integrate an offboard safety bridge.
Table: Critical Robot Subsystems, Technology Ownership, Sourcing Dependencies, and Supply Chain Vulnerability Assessment
| Subsystem / Component | Technical Specification & IP Status | Sourcing Model & Vulnerability Rating |
| Cycloidal Actuators | High-torque, shock-tolerant pin-gear actuators; proprietary Agility IP (evaluating third-party licensing). | Critical Bottleneck: In-house design, but relies on external 5-axis precision machining and heat-treatment vendors; high scrap/yield sensitivity. |
| AI Compute & Vision | NVIDIA IGX Thor & Halos Core onboard edge compute architecture. | Single-Source Dependency: 100% reliant on NVIDIA silicon allocation, foundry capacity, and export compliance. |
| Fast-Charge Battery | 90-min runtime / 9-min charge (10:1 ratio); exclusive humanoid sector license. | Limited-Source Dependency: Custom high-rate cells manufactured externally; subject to thermal safety validation and raw material cost swings. |
| 360° Perception & Safety | LiDAR, depth cameras, FORT Robotics safety bridge; OSHA NRTL & ANSI/A3 R15.08 compliant. | Moderate / Regulatory Lag: Off-the-shelf industrial sensors, but changing vendors requires lengthy NRTL/OSHA re-certification. |
Founded in 2015 as a spinoff from Oregon State University's (OSU) Dynamic Robotics Laboratory by Dr. Jonathan Hurst (following 2016's Cassie and 2017's Digit v1), Agility's early research received Defense Advanced Research Projects Agency (DARPA) funding. Under the federal Bayh-Dole Act (35 U.S.C. § 200 et seq.), early inventions carry U.S. domestic manufacturing preferences and federal "march-in" rights (allowing government-mandated third-party licensing), plus ongoing university in-license diligence and royalty obligations (expensed as incurred, with $0 capitalized patent assets). As of June 30, 2026, Agility holds 34 issued patents (32 U.S., 2 foreign), 68 pending patent applications (61 U.S. non-provisional, 2 foreign, 5 PCT), 31 registered trademarks (13 U.S., 18 foreign), and 8 U.S. pending trademarks.
Table: Competitive Benchmarking of Leading Humanoid Robotics Platforms: Technical Capabilities, Commercial Applications, and Manufacturing Readiness
| Peer Benchmarking Matrix | Agility Robotics (Digit 5 / v4) | Figure AI (Figure 02 / 01) | Tesla (Optimus Gen 2) | Boston Dynamics (Atlas Electric) | Apptronik (Apollo) | Unitree (H1 / G1) | UBTECH (Walker S1 / S) |
| Kinematics & Form | Avian-inspired backward-canted (digitigrade) knee; curved footpad; high shoulder pivot | Anthropomorphic forward knee; 6-DoF bipedal frame | Anthropomorphic forward knee; human-proportioned foot | 360° infinite-rotation electric joints; human-scale biped | Anthropomorphic modular biped; linear/rotational actuators | Compact biped; harmonic/planetary high-torque joints | Anthropomorphic walker; multi-axis torque sensor feet |
| End-Effectors | Modular interchangeable grippers (optimized for totes/cartons) | 16-DoF articulated 5-finger tactile hands | 11-DoF to 22-DoF tactile human-like hands | Modular industrial grippers / task-specific tools | Modular dexterous hands & pin-grip tools | Underactuated multi-finger hands or round pads | Multi-joint dexterous fingers with adaptive compliance |
| Payload & Reach | 50 lb (22.7 kg) on Digit 5 (35 lb v4); 7.2 ft (2.2 m) reach | ~44 lb (20 kg) gross carrying capacity | ~45 lb (20 kg) carry; ~15 lb (6.8 kg) arm load | ~55 lb (25 kg) dynamic heavy lifting | ~55 lb (25 kg) load capacity | ~11–22 lb (5–10 kg) light manipulation | ~33 lb (15 kg) payload capacity |
| Runtime & Energy | 90-min run / 9-min charge (10:1 ratio); >20h uptime/day | ~2.0 hrs runtime; standard swap/charge | ~2.0–4.0 hrs est. runtime (2.3 kWh pack) | ~1.5–2.0 hrs tetherless high-voltage pack | ~4.0 hrs runtime (hot-swappable pack) | ~1.5–2.0 hrs runtime | ~2.0 hrs continuous operation |
| Target Workflows | 3PL & Auto Logistics: Tote handling, conveyor induction (GXO, Amazon, Schaeffler) | Auto Assembly: Sheet metal, kitting (BMW) | Internal Tesla gigafactory logistics | Heavy Auto Mfg.: Part transfer, stamping line feed (Hyundai) | Mfg. Logistics: Part staging, kitting (Mercedes-Benz) | Academic research, patrol, light lab tasks | Auto Workcells: Inspection, bolt kitting (NIO, BYD) |
| Manufacturing Footprint | RoboFab (Salem, OR): 10,000/yr design capacity; 5 Digit 5 prototypes built | Contract pilot lines; low-hundreds annual volume | Pilot Fremont lines; internal auto tooling | Pilot engineering assembly (Waltham, MA) | Pilot assembly (Austin, TX) & contract mfg. | Serial mass production (Hangzhou, China) | Industrial robotics plant (Shenzhen, China) |
| Software & AI Stack | Hybrid: Physical AI (NVIDIA Thor) + Cloud OS (Agility Arc) | End-to-end VLA neural models (OpenAI/internal) | End-to-end neural nets on FSD supercomputer | Model-predictive control + reinforcement learning | Open SDK, ROS 2, localized teleoperation | Reinforcement learning locomotion; open API | Semantic navigation + industrial arm planning |
Beyond humanoid peers (which also include 1X Technologies, Sanctuary AI, Hexagon, and NEURA Robotics), Agility faces intense substitution threat from conventional automation: Autonomous Mobile Robots (AMRs/AGVs like Geek+, Fetch, and Locus costing $20k–$40k per unit with 8–12 hour runtimes), Fixed Automated Storage and Retrieval Systems (ASRS and conveyors offering 99.999% five-nines uptime), and stationary articulated pick-and-place workcells (Fanuc, ABB, KUKA operating at >600 picks/hour).
HDIN Institutional Verdict: Narrative vs. Operational Reality
Management's strategic narrative centers on a $2.50B pre-money equity valuation, a >$300M committed backlog (1,000 Digit 5 units), and >70% target gross margins. However, a forensic cross-examination of the Form S-1 footnotes exposes four structural disconnects between promotional guidance and operational reality:
Valuation, Dilution Overhang, and Secondary Market Unlock Mechanics
On February 2024, Michael Klein's Churchill Sponsor XI LLC formed CCXI in the Cayman Islands, completing its IPO on March 7, 2025 (41,400,000 units at $10.00/unit, placing $414.0M in trust). Following the July 30, 2026 Merger Agreement and October 31, 2026 shareholder vote—where public shareholders redeemed 25,451,804 shares ($261.8M, a 61.5% redemption rate)—the transaction closed on November 4, 2026. Legacy Agility preferred stock ($400.78M carrying value at June 30, 2026; $395.77M at December 31, 2025, after converting $13.88M of convertible notes into Series C-2 on November 14, 2024) and $100.0M of July 2026 SAFEs converted into common stock at an Exchange Ratio of 9.202 ($400.76M APIC reclassification). CCXI also settled $2.25M in July/August 2026 Sponsor working capital promissory notes via 225,000 shares and 22,500 warrants. Post-closing, Agility holds $0 funded debt and $17.44M in operating lease liabilities ($0.59M current, $16.85M non-current), alongside $447.22M ($447,223k) in pro forma cash (after ~$38.3M in transaction costs, $31.0M paid in cash).
Table: Pro Forma Capitalization, Shareholder Ownership, and Potential Equity Dilution Overhang Analysis
| Shareholder & Overhang Classification | Common Shares / Equivalents | Basic Ownership / Dilution (%) | Lock-Up Restrictions, Strike Prices & Redemption Terms |
| Legacy Agility Stockholders | 191,792,080 | 79.1% | 145,700,787 from preferred + 46,091,293 from common/SAFEs (at 9.202 ratio). Locked up 180 days (until May 3, 2027); early release if stock >= $12.00 for 15 of 30 (or 20) trading days. |
| PIPE Investors | 20,102,500 | 8.3% | Subscribed at
201.025M). 0-Day Lock-Up: Freely tradable upon S-1 effectiveness (15.1% gain at $11.51 market price; 1.26x public float). |
| CCXI Public Shareholders | 15,948,196 | 6.6% | Non-redeemed IPO shares (41.4M IPO less 25.45M redeemed). Freely tradable. |
| CCXI Sponsor & Affiliates | 14,525,000 | 6.0% | 13,800,000 Founder shares (180-day lock-up, $12.00 early release) + 500,000 Private units + 225,000 Loan settlement shares (0-day lock-up). |
| Total Basic Common Stock | 242,367,776 | 100.0% | Prospectus cover registers up to 242,089,880 basic common shares ($0.0001 par value). |
| [+] Assumed Stock Options & RSUs | 51,460,363 | +21.2% (+21.3%) | Assumed from Legacy Agility via 9.202 Exchange Ratio; continuous multi-year vesting overhang. |
| [+] Amazon Commercial Warrant | 26,560,579 | +11.0% | Out of 26,577,050 warrants issued Oct 10, 2022 at **
280M value transfer at $11.51). |
| [+] Public & Private Warrants | 4,212,500 | +1.7% | $11.50 strike (4,140,000 Public: redeemable at $0.01 if stock >= $18.00 for 20/30 days; 72,500 Private: 50k units + 22.5k note, non-redeemable & cashless exercise). |
| Total Fully Diluted Shares (Note 3) | 324,601,218 | +33.9% (+34.0%) | Equals 324,323,322 shares when modeled on the 242,089,880 prospectus share baseline. |
| [+] 2026 Incentive Plan & ESPP Pool | 36,313,482 | +15.0% | 13.0% (31,471,684 sh) 2026 Plan + 2.0% (4,841,798 sh) ESPP; expands total diluted base to 360,636,804 shares (+49.0% expansion). |
The secondary market faces severe structural selling pressure. First, 20,102,500 PIPE shares (cost basis $10.00 vs. $11.51 recent market price) carry zero lock-up restrictions and represent 126% of the existing 15.95M public float. Second, the $12.00 early lock-up release threshold sits just 4.2% above the $11.51 reference price; sustaining $12.00 for 15 trading days immediately unlocks ~205.6M insider and Sponsor shares (~85% of total basic equity).
Asset Depreciation Mismatch, RaaS Cash Trap, and H1 2028 Refinancing Window
1. Accounting vs. Commercial Lifespan Divergence: Management's commercial unit economics model assumes a 5-year robot useful life ($500,000 cumulative RaaS LTV). However, in Note 2 of the audited financial statements, GAAP requires depreciating deployed robots and spare robot limbs on a straight-line basis over just 3 years (reflecting actuator wear and mechanical stress), with zero standalone Product Warranty Reserves recorded on the balance sheet (warranty liabilities are bundled inside Accrued Expenses of $7.26M at FY25 and $10.05M at H1 2026, and no quantitative MTBF/MTTR metrics are disclosed).
2. Contingent Backlog & Warrant Subsidy: The >$300M backlog (1,000 Digit 5 units over 3 years) is contingent upon passing strict technical milestones and customer acceptance tests. Furthermore, customer acquisition is heavily subsidized by equity: Amazon's warrant for 26,577,050 shares at $0.93/share transfers over $280M in equity value (at $11.51/share) to secure a 1,000-unit deployment commitment.
3. CapEx & RaaS Balance Sheet Drag: While management states RoboFab's modular cellular architecture requires modest CapEx, scaling to 1,000–2,000 units/year requires an estimated $15M–$25M in direct EOL calibration and burn-in test equipment. More critically, because Agility retains asset ownership under RaaS, manufacturing 1,000 units at the $125,000 target BOM requires capitalizing $125.0M directly from inventory into PP&E. With quarterly burn projected to rise from $44.37M to $50M–$55M in H1 2027 plus $60M–$80M in 2027–2028 manufacturing/RaaS outlay, pro forma cash ($447.2M) is projected to fall to ~$270M by Q4 2027 and breach the $100M–$150M liquidity safety threshold in H1 2028 (Q1–Q2 2028), forcing a dilutive Follow-on Offering or convertible debt issuance well ahead of Q4 2028/Q1 2029 cash exhaustion.
Corporate Governance, Related-Party Contracts, and Enterprise Risk Matrix
Agility utilizes a single-class common stock structure (one vote per share) protected by anti-takeover provisions: a 6-member Classified Board staggered into three 3-year classes (Class I to 2027 AGM: Peggy Johnson, Pierre Gentin; Class II to 2028 AGM: Damion Shelton, Derek Aberle; Class III to 2029 AGM: Merline Saintil, Mark Vale), prohibitions on shareholder action by written consent or calling special meetings, and supermajority charter amendment requirements. Non-employee directors receive an initial $450,000 RSU grant.
Key Financial Questions From the FY25 and H1 2026 Form S-1 Filing
What drove Agility Robotics's revenue and margin performance in FY25 and H1 2026?
In FY25, net revenue rose 474.8% YoY to $1.78M (with 63.5% from related parties and 87.0% concentrated in two customers) before dropping 72.2% YoY to $0.17M in H1 2026 as customers paused Digit v4 purchases ahead of the Digit 5 launch. Gross margin deteriorated by 193,810 bps YoY to -2,135.1% (-$3.72M) in H1 2026 due to unabsorbed Salem RoboFab overhead, while operating loss reached -$362.68M following a $252.5M non-cash mark-to-market charge on liability-classified stock options.
How is Agility Robotics allocating capital and expanding its regional infrastructure?
Following its November 4, 2026 merger with Churchill Capital Corp XI, Agility holds $447.22M in pro forma cash ($164.1M trust cash after 61.5% redemptions, $201.0M PIPE, and $100.0M SAFEs less $31.0M cash transaction fees), funding ~10.1 quarters of runway at its $44.37M quarterly FCF burn rate. Capital is allocated toward scaling Digit 5 serial production in H1 2027 at its 10,000-unit/year Salem, Oregon RoboFab plant and training neural policies at its Fremont, California Physical AI Hub, though capitalizing 1,000 RaaS units at a $125,000 BOM will consume $125.0M in balance sheet cash and trigger an H1 2028 refinancing window.
How does the De-SPAC capital structure impact shareholder dilution and secondary market float?
Post-closing basic common stock stands at 242,367,776 shares (with $0 funded debt after converting $400.78M of preferred equity at a 9.202 exchange ratio), but faces an immediate 34.0% dilutive overhang of 82,233,442 shares (51.46M options, 4.21M warrants at $11.50, and 26.56M unvested Amazon warrants at $0.93) plus a 15.0% (36.31M share) 2026 incentive pool. Near-term secondary float is pressured by 20,102,500 PIPE shares (subscribed at $10.00) carrying a 0-day lock-up, alongside an early lock-up release trigger on ~205.6M insider shares if the stock trades at or above $12.00 for 15 out of 30 trading days.
Presentation Download & Analyst Briefing Access:
- Institutional Presentation: Download the full "Agility_Robotics_S-1_Forensic_Analysis" PDF under the 'Related Topics' section.
- Analyst Video Briefing: Watch the "Agility Robotics Form S-1 Strategic Due Diligence" on the HDIN Research YouTube Channel.
About HDIN Research:
HDIN Research is a premier global market intelligence and strategic advisory firm specializing in institutional-grade financial analysis, supply chain audits, and macroeconomic forecasting. Our dedicated sector analysts deliver actionable, data-driven insights tailored for private equity, hedge funds, and corporate strategy teams. Visit us at https://www.hdinresearch.com.
Editorial & Methodology Disclosure:
"This market intelligence brief was researched, modeled, and audited by the HDIN Research Equity Desk based on official primary corporate filings (Agility Robotics, Inc. Form S-1 Registration Statement covering FY2024, FY2025, and H1 2026). Proprietary quantitative extraction tools were utilized to ensure 100% fidelity to reported financial line items and footnotes. All forensic interpretations, segmental benchmarks, and institutional verdicts were independently written and verified by HDIN senior sector analysts in accordance with institutional research standards."