Skyworks FY26 Analysis: -56.7% EBIT & Qorvo Deal | HDIN Research
Date : 2026-11-18
Reading : 307
BEIJING — HDIN Market Intelligence Brief | Audited by HDIN Equity Research Desk | Source Filing: FY2026 Form 10-K (Ended October 2, 2026) & FY2025 Form 10-K
HDIN Executive Takeaways
1. Operational Compression: FY26 revenue fell 3.11% to $3,959.6 million, while GAAP operating income dropped 56.66% to $216.7 million (-676 bps margin). Finished goods jumped 87.66% to $317.7 million, cutting FCF 79.26% to $229.3 million.
2. Qorvo Scale & Leverage: The $10.2 billion Qorvo merger closed October 5, 2026, raising pro forma debt near $4.0 billion and forcing an indefinite dividend termination.
3. Institutional Verdict: With Apple down to 61% of sales, recovery depends on fab consolidation and Broad Markets (+14.50%) funding debt paydown.
Figure SKYWORKS SOLUTIONS (FY2025-FY2026) NAVIGATING: THE RF INFLECTION POINT & THE BROAD MARKETS PIVOT
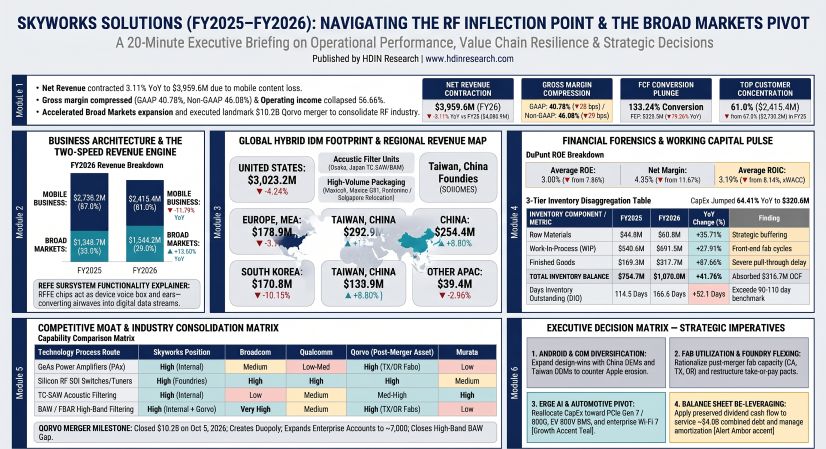
Skyworks FY26 Segmental Performance, Margin Compression, and Working Capital Dynamics
Skyworks Solutions, Inc. [NASDAQ: SWKS] recorded a 3.11% year-over-year (YoY) contraction in consolidated net revenue to $3,959.6 million in the 52-week fiscal year ended October 2, 2026 (FY26), down from $4,086.9 million in the 53-week fiscal year ended October 3, 2025 (FY25, which had declined 2.2% from the prior year). Despite gross margin compression of only 38 basis points (bps) under U.S. GAAP to 40.78% (and 29 bps on a Non-GAAP basis to 46.08%), GAAP operating income fell 56.66% to $216.7 million (-676 bps operating margin contraction to 5.47%), while GAAP net income declined 63.93% to $172.1 million ($1.14 diluted EPS vs. $3.08 in FY25). With operating profit dropping 56.66% against a 3.11% revenue decline, Skyworks exhibited an 18.2x degree of operating leverage (DOL), amplified by $208.9 million in combined Qorvo M&A advisory fees ($84.7 million) and facility restructuring and impairment charges ($124.2 million), alongside rigid depreciation and amortization (D&A) of $462.5 million ($463.0 million in FY25).
Table: Skyworks Solutions FY2025–FY2026 Consolidated GAAP and Non-GAAP Income Statement
Gross Margin Bridge, Non-GAAP Reconciliation, and Restructuring Breakdown
Decomposing Skyworks' FY26 margin bridge from 41.16% GAAP gross margin to 40.78% (-38 bps) highlights four primary drivers: higher unit shipment volumes contributed a +110 bps offset, which was outweighed by input cost inflation across silicon wafers and critical minerals (-80 bps), unfavorable product mix from Tier-1 mobile socket losses (-50 bps), and fab fixed-cost inefficiencies (-18 bps). Below the gross profit line, operating margin collapsed by -676 bps to 5.47% due to R&D deleveraging (-192 bps as R&D rose 6.56% to $837.0 million, or 21.14% of revenue vs. 19.22% in FY25), SG&A and M&A advisory drag (-192 bps net; $84.7 million in Qorvo deal fees alone represented a 214 bps headwind), and restructuring and impairment charges (-254 bps direct bridge impact, or ~310 bps of revenue).
In reconstructing Non-GAAP profitability, total pre-tax add-backs rose from $440.9 million in FY25 to $600.7 million in FY26. These adjustments comprised $218.4 million in total SBC in FY26 ($232.4 million in FY25), split across COGS ($37.2 million), R&D ($129.7 million), and SG&A ($51.5 million)—representing 5.5% of sales with 14.2 million shares held in reserve—alongside $173.4 million in intangible asset amortization ($184.3 million in FY25; $186.5 million in FY24), $124.2 million in restructuring and impairments ($24.2 million in FY25, which included $12.5 million in SBC and severance for former CEO Liam Griffin's transition), and $84.7 million in Qorvo transaction fees ($0.0 million in FY25). Applying an estimated 12% net tax effect ($(52.9) million in FY25 and $(72.1) million in FY26), reconstructed Non-GAAP operating income declined 13.13% to $817.4 million (20.64% margin), while Non-GAAP net income fell 19.00% to $700.7 million. FY26 restructuring and impairment charges of $124.2 million broke down into $66.2 million of non-cash impairments—$37.7 million for excess foundry supply deposits in other current assets, $25.7 million for Woburn, Massachusetts property, plant, and equipment (PP&E) written down upon held-for-sale classification under ASC 360, and $2.8 million for abandoned in-process R&D (IPR&D)—plus $58.0 million in cash facility closure, severance, and line consolidation expenses.
Cash Flow Quality, Capital Allocation, and DuPont Return Metrics
Table: Skyworks Solutions Cash Flow Conversion, Capital Allocation, and DuPont Analysis (FY2025–FY2026)
Operating cash flow dropped 57.73% to $549.9 million in FY26, while CapEx jumped 64.41% to $320.6 million (58.30% of OCF vs. 14.99% in FY25) to fund cleanroom expansion, Woburn line transfers to Newbury Park, and Mexicali 3D die-stacking automation. Consequently, FCF fell 79.26% to $229.3 million. Although FY26 FCF conversion printed at 133.24%, non-cash add-backs of $656.5 million equaled 381.5% of GAAP net income, masking severe working capital absorption. Total capital outlays across R&D ($785.5 million in FY25; $837.0 million in FY26), CapEx, shareholder returns, and FY26 M&A advisory fees totaled $2,242.8 million in FY25 and $1,592.2 million (plus $84.7 million M&A fees) in FY26. In FY26, Skyworks slashed program share repurchases by 86.21% from $830.2 million (12.7 million shares; $837.6 million including settlement timing) to $114.5 million (1.6 million shares, or 49.93% of FCF vs. 75.08% in FY25). Because quarterly dividends of $0.71 per share over three quarters required $320.1 million (139.60% of FY26 FCF), the Board indefinitely terminated cash dividends on July 28, 2026 ahead of the Qorvo closing.
On the balance sheet, Skyworks raised $2,000.0 million in Senior Notes in August 2026, inflating total debt from $995.8 million to $2,472.8 million, total liabilities by 72.3% from $2,159.9 million to $3,721.1 million, and ending cash and marketable securities to $2,606.1 million (against $5,715.7 million in stockholders' equity). This pushed financial leverage to 1.651x and depressed ending ROIC by 531 bps to 3.13%—well below Skyworks' ~8.5%–9.5% cost of capital (WACC).
Inventory Overhang, Working Capital Cycle, and Intangible Amortization Cliff
Forensic inventory analysis refutes the thesis of a strategic "die bank" build. Had Skyworks proactively buffered generic silicon for FY27 launches, capital would have concentrated in flexible, unpackaged WIP wafers; instead, WIP share contracted by 700 bps to 64.63%, while finished goods—custom-packaged, EMI-shielded System-in-Package (SiP) modules bound to specific handset sockets—surged 87.66% to $317.7 million. Maintaining high fab utilization buffered GAAP gross margins by capitalizing fixed overhead onto the balance sheet, while "take-or-pay" foundry agreements forced continued wafer intake. Under Note 11, refundable deposits and capacity prepayments expanded 159.5% from $26.4 million in FY25 ($7.7 million current, $18.7 million non-current; down from $167.8 million in FY24 following a $47.5 million FY23 impairment) to $68.5 million in FY26 ($37.7 million current, $30.8 million non-current), after absorbing a $37.7 million supply impairment charge. Under ASC 330, excess and obsolete inventory write-downs permanently reduce cost basis through COGS and cannot be reversed.
Goodwill remained unchanged at $2,176.7 million with zero impairment in FY25 and FY26. Net identifiable intangible assets (primarily from the 2021 Silicon Labs Infrastructure & Automotive acquisition) declined by $175.3 million from $809.0 million to $633.7 million (gross $1,504.0 million; accumulated amortization $(870.3) million), comprising Developed Technology & Other ($577.2 million net, 6.4-year weighted average life, $1,396.5 million gross, $(819.3) million accumulated), Technology Licenses ($56.5 million net, 3.2-year life, $107.5 million gross, $(51.0) million accumulated), and IPR&D ($0.0 million vs. $2.8 million in FY25). On a standalone basis, existing amortization—over 99% absorbed in COGS, compressing gross margins by 430–450 bps—faces a sharp step-down in FY28–FY29 before new Qorvo purchase accounting intangibles reset the pool in FY27.
End-Market Concentration, Litigation, and Tax Contingencies
Under ASC 280, Skyworks operates as a single reportable segment under Chief Operating Decision Maker (CODM) CEO Philip Brace. However, Note 14 disaggregates revenue across its primary Tier-1 mobile customer (Apple Inc.), sales channels, and Broad Markets.
Table: Skyworks Solutions End-Market Concentration and Sales Channel Mix (FY2025–FY2026)
In Note 11 legal proceedings, Skyworks formally settled Denso Corporation's piezoelectric thin-film patent infringement lawsuits (filed June 20 and October 31, 2025 in U.S. District Court for the Central District of California and Osaka District Court over U.S. Patent 7,758,979 and Japanese Patents JP5190841 and JP5966199) for an immaterial charge during FY26, protecting Osaka filter production. Conversely, on May 6, 2026, the federal court denied Skyworks' motion to dismiss the March 4, 2025 securities fraud class action (and three April 2025 derivative suits), advancing the litigation into discovery. Under Note 8, Singapore's tax holiday expires September 30, 2030; it reduced Singapore taxes by $67.7 million ($0.42/share) in FY24, $6.6 million ($0.04/share) in FY25, and $6.6 million ($0.04/share) in FY26, following a $19.0 million FY25 remeasurement charge and carrying a $336.4 million cumulative FY21–FY25 clawback exposure if local headcount or capex covenants are breached. Unrecognized tax benefits rose from $64.2 million in FY25 to $83.2 million in FY26 ($65.5 million would lower the effective tax rate if recognized, alongside $13.9 million in accrued interest/penalties), while active audits span IRS FY24 and California FTB FY22–FY23, with open tax years across the U.S. (FY23+), California (FY08+), Mexico/Japan (FY19+), and Singapore (FY21+), alongside OECD Pillar Two top-up tax exposure.
Infrastructure Footprint, Qorvo Combination Architecture, and Competitive Positioning
Skyworks maintains a hybrid integrated device manufacturer (Hybrid IDM) footprint pairing internal compound semiconductor and acoustic filter fabs with external pure-play silicon foundries, primarily in Taiwan, China, for CMOS, BiCMOS, and RF Silicon-on-Insulator (RF SOI) switches. Total net PP&E of $1,197.6 million is concentrated in Japan ($459.6 million, 38.38%), Mexico ($327.7 million, 27.36%), Singapore ($223.1 million, 18.63%), and the United States ($160.2 million, 13.38%, down from $226.8 million in FY25 due to Woburn's impairment). In August 2025, Skyworks initiated the closure of its 158,000 sq. ft. Woburn, Massachusetts fab, consolidating GaAs lines into Newbury Park, California and classifying $12.5 million of residual Woburn PP&E as held for sale. Meanwhile, Skyworks' 412,300 sq. ft. Singapore filter assembly sublease expires in July 2030 amid landlord parcel redevelopment, creating a 3-to-4-year mandatory relocation and requalification requirement. Prior divestitures of assembly and test sites in China and Costa Rica, alongside Qorvo's North Carolina fab sale and SAW transfer to Texas, further alter the post-merger operational map.
Geographic Revenue Disaggregation and Geopolitical Supply Exposure
Disaggregated by OEM headquarters under Note 14 (and strictly designating Taiwan as Taiwan, China per UN conventions), U.S. OEMs—anchored by Apple—accounted for 76.35% of FY26 revenue. Conversely, revenue attributed to OEMs and ODMs headquartered in Taiwan, China (including Foxconn, Pegatron, Quanta, and Compal, supported by Skyworks Solutions Worldwide, Inc., Taiwan Branch) expanded 13.05% YoY to $292.9 million, while direct China revenue (Xiaomi, OPPO, VIVO, serviced via Skyworks Solutions Commercial (Shenzhen) Co., Ltd. with Beijing and Shanghai branches, plus Advanced Analogic Technologies (China), Inc.) stabilized at $254.4 million. Management flags critical supply chain vulnerability to Taiwan Strait disruptions, U.S. tariffs, BIS Entity List expansions driving China domestic substitution, and export controls on gallium, germanium, antimony, tungsten, molybdenum, scandium, and rare earth elements.
Table: Skyworks Solutions Geographic Net Revenue by OEM Headquarters (FY2025–FY2026)
Qorvo Transaction Architecture, Debt Financing, and Regulatory Clearances
Executed on October 27, 2025 and closed on October 5, 2026 (first week of FY27) following Hart-Scott-Rodino (HSR) waiting-period expiration and international clearances without structural fab divestitures, the two-step acquisition of Qorvo, Inc. [NASDAQ: QRVO] delivered total consideration of $10.2 billion ($8.9 billion net of $1.3 billion acquired Qorvo cash; ~$22 billion implied combined enterprise value at signing). Qorvo shareholders received 0.960 Skyworks shares plus $32.50 in cash per share, totaling $7.2 billion in equity (85.3 million newly issued SWKS shares, expanding post-close share count by 57.5% from 149.1 million to 234.9 million for a 63% Skyworks / 37% Qorvo ownership split, plus ~4.6 million assumed employee RSUs/PSUs) and $2.9 billion in cash.
To fund the cash outlay alongside cash on hand and its $750.0 million revolver, Skyworks issued $2,000.0 million in Senior Notes on August 10, 2026 ($800 million 5.00% Notes due 2028, $600 million 5.75% Notes due 2032, and $600 million 6.25% Notes due 2036), supplementing existing $500 million 3.00% Notes due 2031. On October 7, 2026, Skyworks completed debt exchange offers issuing $1,424.9 million in replacement notes ($778.1 million of 4.375% Notes due 2029 and $646.8 million of 3.375% Notes due 2031) for Qorvo legacy debt, with $123.5 million remaining unexchanged. Pro forma combined debt now approaches ~$4.0 billion, projecting an annual interest expense run-rate exceeding $180–$200 million. The merger agreement included a $298.7 million superior-proposal termination fee and a $100.0 million antitrust reverse termination fee (Outside Date April 27, 2027, extendable to October 27, 2027).
Competitive Benchmarking, Technology Process Spectrum, and Porter's Five Forces
Combining Skyworks and Qorvo consolidates the historical four-player Tier-1 RF front-end (RFFE) oligopoly alongside Broadcom Inc. [NASDAQ: AVGO], Qualcomm Inc. [NASDAQ: QCOM], and Murata Manufacturing, uniting ~12,000 patents and ~7,000 enterprise customers. Under Porter's Five Forces, Threat of New Entrants is Low ($837.0 million standalone R&D, cleanrooms, 12,000+ patents), Bargaining Power of Suppliers is Moderate-High (Taiwan, China foundry concentration, $68.5 million take-or-pay deposits, rare earth/GaN controls), Bargaining Power of Buyers is Very High (Apple 61% of FY26 sales, top 3 customers 75% of gross receivables, dual-sourcing), Threat of Substitutes is Moderate (Qualcomm modem-to-RF bundling and OEM in-house silicon vs. immutable RF physics), and Competitive Rivalry is High (annual ASP erosion and filter skirt competition).
Table: Skyworks Post-Qorvo Competitive Benchmarking Matrix
Across frequency process routes, Skyworks leverages internal GaAs and Osaka TC-SAW alongside external Taiwan, China RF SOI for Low-to-Mid bands (<2.5 GHz) via its Sky5® SiP platform. In High and Ultra-High bands (2.5–7.1 GHz, covering 5G n77/n78/n79 and Wi-Fi 6E/7), Qorvo's mature scandium-doped aluminum nitride BAW wafer fabs in Texas and Oregon narrow Broadcom's historical FBAR lead, while RF GaN strengthens Skyworks' mmWave/FR3 (7–24 GHz and 30+ GHz), 5G-Advanced, satellite non-terrestrial network (NTN), and defense radar portfolio. Outside mobile—where 12-month lifecycles and annual re-bids yield low-to-moderate switching costs—Broad Markets deliver 7–10+ year lifecycles and 18–36 month AEC-Q100 and ISO 26262 automotive qualification moats across 800V EV traction inverters, onboard chargers, BMS isolators, C-V2X telematics, in-vehicle infotainment (with 90% of new cars forecast connected by 2030), DOCSIS cable broadband, and ultra-low jitter clocks for 800G/1.6T optical transceivers and PCIe Gen 6/7 AI clusters (with global 5G subscriptions projected at 6.4 billion by 2031).
HDIN Institutional Verdict: Strategic Narrative vs. Operational Reality
Management's strategic narrative centers on transforming Skyworks from a smartphone RF supplier into a diversified connectivity, Edge AI, software-defined vehicle (SDV), and AI infrastructure platform via the Qorvo combination. However, a forensic comparison between management's Item 7 commentary and Item 1A textual shifts reveals material operational friction. Across the FY26 Form 10-K, key Item 1A risk disclosures shifted from hypothetical phrasing ("may/could") to materialized operational drag ("have experienced / are experiencing"). Specifically, management confirmed ongoing Tier-1 socket and content losses from dual-sourcing and customer in-house baseband integration, actual supplier delivery delays and quality/reliability failures, yield and quality losses from transitioning to PFAS-free manufacturing that triggered customer defections, Mexican Peso appreciation inflating Mexicali operating expenses, and AI data center wafer-crowding forcing additional take-or-pay foundry commitments.
Furthermore, the FY26 Form 10-K introduced four standalone risk categories: (1) U.S. Department of Defense (DoD) and aerospace budget sequestration and compliance risks inherited from Qorvo; (2) indirect demand suppression as smartphone OEMs absorb DRAM and NAND memory shortages and price spikes; (3) restructuring execution risks, including unintended attrition and European Works Council severance disputes; and (4) goodwill and intangible asset impairment exposure on the $10.2 billion Qorvo purchase price allocation.
Governance and executive leadership underwent comprehensive restructuring across FY25–FY26 to execute this pivot. Philip G. Brace replaced Liam Griffin as President and CEO on February 17, 2025 (appointed February 4); Todd Lepinski replaced Carlos S. Bori as SVP of Sales and Marketing on June 2, 2025 (appointed May 7); and Philip Carter replaced Kris Sennesael as SVP and CFO on September 8, 2025 (appointed August 23), while EVP and COO/CTO Reza Kasnavi remained to oversee fab transitions. Upon the Qorvo closing, the Board expanded from 9 to 11 seats (7 Skyworks, 3 Qorvo led by former CEO Robert Bruggeworth, and 1 joint director), with Bruggeworth, Richard Clemmer, and Chris Koopmans signing the November 10, 2026 Form 10-K and Kevin L. Beebe departing. Internal controls remain intact: both management (under COSO 2013 and SOX 404) and independent auditor KPMG LLP issued unqualified opinions on ICFR for FY25 and FY26, identifying an identical Critical Audit Matter (CAM) regarding manual tax provision evaluations across foreign jurisdictions. Executive pay aligns via annual cash Executive Incentive Plan (EIP) targets (100% base target, 200% cap tied to Net Revenue, Operating Margin, and OCF), 3-year Monte Carlo relative and 60-day absolute TSR Performance Share Awards (0%–200% payout), and a mandatory SEC/Nasdaq Clawback Policy (Exhibit 97.1).
Ultimately, Skyworks enters FY27 with $1,070.0 million in inventory, $317.7 million in finished goods vulnerable to ASC 330 write-downs, 3.13% ROIC, and ~$4.0 billion in pro forma debt. Suspending the $320 million annual dividend provides necessary liquidity, but restoring ROIC above WACC requires flawless execution on Woburn-to-Newbury Park fixed-cost savings, Qorvo fab integration, and inventory liquidation rather than top-line rhetoric alone.
Key Financial Questions From the FY2026 Filing
What drove Skyworks' 56.66% operating income collapse despite only a 3.11% revenue decline in FY2026?
Skyworks suffered 18.2x negative operating leverage as a $322.8 million (-11.79%) revenue drop at Apple Inc. (falling from 67% to 61% of net revenue) coincided with $84.7 million in Qorvo M&A advisory fees in SG&A, $124.2 million in restructuring and impairment charges (+413.22% YoY), and a 6.56% increase in R&D to $837.0 million (21.14% of sales). While Broad Markets grew 14.50% to $1,544.2 million (39% of sales), GAAP operating margin compressed by 676 bps from 12.23% to 5.47%, and GAAP net income fell 63.93% to $172.1 million.
How did inventory accumulation and take-or-pay foundry commitments impact FY2026 Free Cash Flow?
Free cash flow dropped 79.26% from $1,105.8 million in FY25 to $229.3 million in FY26 as operating cash flow fell 57.73% to $549.9 million and CapEx rose 64.41% to $320.6 million. Total inventories expanded 41.78% to $1,070.0 million—led by an 87.66% surge in finished goods to $317.7 million and a +52.1-day jump in DIO to 166.6 days—absorbing $316.7 million of operating cash flow alongside $68.5 million in foundry capacity prepayments and a $37.7 million excess supply deposit impairment.
How is Skyworks financing the $10.2 billion Qorvo acquisition and managing its pro forma capital structure?
Completed on October 5, 2026 for 0.960 Skyworks shares and $32.50 in cash per Qorvo share ($7.2 billion equity via 85.3 million new shares plus $2.9 billion cash, or $8.9 billion net of $1.3 billion acquired cash), the transaction was funded via an August 10, 2026 offering of $2,000.0 million in Senior Notes (due 2028, 2032, and 2036) and cash on hand. Combined with $1,424.9 million in October 7, 2026 exchange notes ($123.5 million unexchanged) and existing 2031 notes, pro forma debt approaches ~$4.0 billion with >$180–$200 million in annual interest expense, leading the Board to terminate cash dividends on July 28, 2026.
Presentation Download & Analyst Briefing Access:
- Institutional Presentation: Download the full "Skyworks_Solutions_Strategic_Due_Diligence" PDF under the 'Related Topics' section.
- Analyst Video Briefing: Watch the "Skyworks & Qorvo $10.2B Merger: Can Broad Markets Fix a 56.6% Profit Collapse and $4.05B Debt?" on the HDIN Research YouTube Channel.
About HDIN Research:
HDIN Research is a premier global market intelligence and strategic advisory firm specializing in institutional-grade financial analysis, supply chain audits, and macroeconomic forecasting. Our dedicated sector analysts deliver actionable, data-driven insights tailored for private equity, hedge funds, and corporate strategy teams. Visit us at https://www.hdinresearch.com.
Editorial & Methodology Disclosure:
"This market intelligence brief was researched, modeled, and audited by the HDIN Research Equity Desk based on official primary corporate filings (Skyworks Solutions, Inc. FY2026 Form 10-K Ended October 2, 2026 and FY2025 Form 10-K Ended October 3, 2025). Proprietary quantitative extraction tools were utilized to ensure 100% fidelity to reported financial line items and footnotes. All forensic interpretations, segmental benchmarks, and institutional verdicts were independently written and verified by HDIN senior sector analysts in accordance with institutional research standards."
HDIN Executive Takeaways
1. Operational Compression: FY26 revenue fell 3.11% to $3,959.6 million, while GAAP operating income dropped 56.66% to $216.7 million (-676 bps margin). Finished goods jumped 87.66% to $317.7 million, cutting FCF 79.26% to $229.3 million.
2. Qorvo Scale & Leverage: The $10.2 billion Qorvo merger closed October 5, 2026, raising pro forma debt near $4.0 billion and forcing an indefinite dividend termination.
3. Institutional Verdict: With Apple down to 61% of sales, recovery depends on fab consolidation and Broad Markets (+14.50%) funding debt paydown.
Figure SKYWORKS SOLUTIONS (FY2025-FY2026) NAVIGATING: THE RF INFLECTION POINT & THE BROAD MARKETS PIVOT
Skyworks FY26 Segmental Performance, Margin Compression, and Working Capital Dynamics
Skyworks Solutions, Inc. [NASDAQ: SWKS] recorded a 3.11% year-over-year (YoY) contraction in consolidated net revenue to $3,959.6 million in the 52-week fiscal year ended October 2, 2026 (FY26), down from $4,086.9 million in the 53-week fiscal year ended October 3, 2025 (FY25, which had declined 2.2% from the prior year). Despite gross margin compression of only 38 basis points (bps) under U.S. GAAP to 40.78% (and 29 bps on a Non-GAAP basis to 46.08%), GAAP operating income fell 56.66% to $216.7 million (-676 bps operating margin contraction to 5.47%), while GAAP net income declined 63.93% to $172.1 million ($1.14 diluted EPS vs. $3.08 in FY25). With operating profit dropping 56.66% against a 3.11% revenue decline, Skyworks exhibited an 18.2x degree of operating leverage (DOL), amplified by $208.9 million in combined Qorvo M&A advisory fees ($84.7 million) and facility restructuring and impairment charges ($124.2 million), alongside rigid depreciation and amortization (D&A) of $462.5 million ($463.0 million in FY25).
Table: Skyworks Solutions FY2025–FY2026 Consolidated GAAP and Non-GAAP Income Statement
| Financial Metric ($ Millions, except per share & bps) | FY2025 (53 Weeks) | FY2026 (52 Weeks) | Absolute Change | YoY Change / Margin Shift |
| Net Revenue | $4,086.9 | $3,959.6 | -$127.3 | -3.11% |
| Cost of Goods Sold (COGS) | $2,404.8 | $2,344.7 | -$60.1 | -2.50% |
| — Share-Based Compensation (SBC) in COGS | $29.5 | $37.2 | +$7.7 | +26.10% |
| — Intangibles Amortization in COGS | $183.4 | $172.5 | -$10.9 | -5.94% |
| GAAP Gross Profit | $1,682.1 | $1,614.9 | -$67.2 | -4.00% |
| GAAP Gross Margin (%) | 41.16% | 40.78% | — | -38 bps |
| Non-GAAP Gross Profit | $1,895.0 | $1,824.6 | -$70.4 | -3.72% |
| Non-GAAP Gross Margin (%) | 46.37% | 46.08% | — | -29 bps |
| Research & Development (R&D) | $785.5 | $837.0 | +$51.5 | +6.56% |
| Selling, General & Administrative (SG&A) | $371.5 | $436.1 | +$64.6 | +17.39% |
| — Qorvo Transaction Advisory Costs in SG&A | $0.0 | $84.7 | +$84.7 | N/A |
| Amortization of Intangibles (OpEx) | $0.9 | $0.9 | $0.0 | 0.00% |
| Restructuring, Impairment & Other Charges | $24.2 | $124.2 | +$100.0 | +413.22% |
| Total Operating Expenses | $1,182.1 | $1,398.2 | +$216.1 | +18.28% |
| GAAP Operating Income | $500.0 | $216.7 | -$283.3 | -56.66% |
| GAAP Operating Margin (%) | 12.23% | 5.47% | — | -676 bps |
| Non-GAAP Operating Income (Reconstructed) | $940.9 | $817.4 | -$123.5 | -13.13% |
| Non-GAAP Operating Margin (%) | 23.02% | 20.64% | — | -238 bps |
| Interest Expense | $(27.1) | $(41.3) | -$14.2 | +52.40% |
| Other Income, Net | $53.8 | $38.3 | -$15.5 | -28.81% |
| Income Before Taxes | $526.7 | $213.7 | -$313.0 | -59.43% |
| Provision for Income Taxes | $49.6 | $41.6 | -$8.0 | -16.13% |
| Effective Tax Rate (%) | 9.42% | 19.47% | — | +1,005 bps |
| GAAP Net Income | $477.1 | $172.1 | -$305.0 | -63.93% |
| GAAP Net Margin (%) | 11.67% | 4.35% | — | -732 bps |
| Non-GAAP Net Income (Reconstructed) | $865.1 | $700.7 | -$164.4 | -19.00% |
| Diluted Shares Outstanding (Millions) | 155.1 | 151.0 | -4.1 | -2.64% |
| Diluted Earnings Per Share (EPS) | $3.08 | $1.14 | -$1.94 | -62.99% |
Gross Margin Bridge, Non-GAAP Reconciliation, and Restructuring Breakdown
Decomposing Skyworks' FY26 margin bridge from 41.16% GAAP gross margin to 40.78% (-38 bps) highlights four primary drivers: higher unit shipment volumes contributed a +110 bps offset, which was outweighed by input cost inflation across silicon wafers and critical minerals (-80 bps), unfavorable product mix from Tier-1 mobile socket losses (-50 bps), and fab fixed-cost inefficiencies (-18 bps). Below the gross profit line, operating margin collapsed by -676 bps to 5.47% due to R&D deleveraging (-192 bps as R&D rose 6.56% to $837.0 million, or 21.14% of revenue vs. 19.22% in FY25), SG&A and M&A advisory drag (-192 bps net; $84.7 million in Qorvo deal fees alone represented a 214 bps headwind), and restructuring and impairment charges (-254 bps direct bridge impact, or ~310 bps of revenue).
In reconstructing Non-GAAP profitability, total pre-tax add-backs rose from $440.9 million in FY25 to $600.7 million in FY26. These adjustments comprised $218.4 million in total SBC in FY26 ($232.4 million in FY25), split across COGS ($37.2 million), R&D ($129.7 million), and SG&A ($51.5 million)—representing 5.5% of sales with 14.2 million shares held in reserve—alongside $173.4 million in intangible asset amortization ($184.3 million in FY25; $186.5 million in FY24), $124.2 million in restructuring and impairments ($24.2 million in FY25, which included $12.5 million in SBC and severance for former CEO Liam Griffin's transition), and $84.7 million in Qorvo transaction fees ($0.0 million in FY25). Applying an estimated 12% net tax effect ($(52.9) million in FY25 and $(72.1) million in FY26), reconstructed Non-GAAP operating income declined 13.13% to $817.4 million (20.64% margin), while Non-GAAP net income fell 19.00% to $700.7 million. FY26 restructuring and impairment charges of $124.2 million broke down into $66.2 million of non-cash impairments—$37.7 million for excess foundry supply deposits in other current assets, $25.7 million for Woburn, Massachusetts property, plant, and equipment (PP&E) written down upon held-for-sale classification under ASC 360, and $2.8 million for abandoned in-process R&D (IPR&D)—plus $58.0 million in cash facility closure, severance, and line consolidation expenses.
Cash Flow Quality, Capital Allocation, and DuPont Return Metrics
Table: Skyworks Solutions Cash Flow Conversion, Capital Allocation, and DuPont Analysis (FY2025–FY2026)
| Financial / Capital Efficiency Metric ($ Millions, except ratios & bps) | FY2025 | FY2026 | Absolute Change | YoY Change / Shift |
| Net Cash Provided by Operating Activities (OCF) | $1,300.8 | $549.9 | -$750.9 | -57.73% |
| — Non-Cash Depreciation | $278.7 | $289.1 | +$10.4 | +3.73% |
| — Non-Cash Share-Based Compensation (SBC) | $232.4 | $218.4 | -$14.0 | -6.02% |
| — Non-Cash Amortization of Intangibles | $184.3 | $173.4 | -$10.9 | -5.91% |
| — Deferred Income Taxes | $(55.8) | $(90.6) | -$34.8 | +62.37% |
| — Asset Impairments | $0.0 | $66.2 | +$66.2 | N/A |
| — Other Non-Cash Items | $(9.1) | $(1.1) | +$8.0 | -87.91% |
| — Working Capital: Receivables, Net | $(89.3) | +$103.5 | +$192.8 | Cash Inflow |
| — Working Capital: Inventory | +$41.8 | $(316.7) | -$358.5 | Severe Drain |
| — Working Capital: Accounts Payable | +$67.1 | +$54.8 | -$12.3 | Cash Inflow |
| — Working Capital: Other Assets / Liabilities | +$173.6 | $(119.2) | -$292.8 | Cash Outflow |
| Capital Expenditures (CapEx) | $(195.0) | $(320.6) | -$125.6 | +64.41% |
| Free Cash Flow (FCF = OCF - CapEx) | $1,105.8 | $229.3 | -$876.5 | -79.26% |
| FCF Conversion Ratio (FCF / Net Income) | 231.78% | 133.24% | — | -9,854 bps |
| OCF Conversion Ratio (OCF / Net Income) | 272.65% | 319.52% | — | +4,687 bps |
| Share Repurchases (Program Cash + Tax Withholding) | $830.2 + $44.4 | $114.5 + $42.9 | -$717.2 | -86.21% (Program) |
| Cash Dividends Paid ($2.81/sh FY25; $2.13/sh FY26) | $432.6 | $320.1 | -$112.5 | -26.01% |
| Total Shareholder Returns (Buybacks + Dividends) | $1,262.8 | $434.6 | -$828.2 | -65.58% |
| Asset Turnover (Ending Total Assets / Average Assets) | 0.516x / 0.505x | 0.420x / 0.456x | -0.096x / -0.049x | Asset Inflation |
| Financial Leverage (Ending Equity / Average Equity) | 1.375x / 1.340x | 1.651x / 1.513x | +0.276x / +0.173x | +72.3% Liabilities |
| Return on Equity (ROE: Ending / Average Equity) | 8.29% / 7.89% | 3.01% / 3.00% | -528 bps / -489 bps | -63.7% (Ending) |
| NOPAT (Operating Income × (1 - Effective Tax Rate)) | $452.9 | $174.5 | -$278.4 | -61.47% |
| Invested Capital (Ending / Average) | $5,364.5 / $5,560.7 | $5,582.4 / $5,473.5 | +
87.2 |
Debt & Cash Shift |
| ROIC (Ending / Average Invested Capital) | 8.44% / 8.14% | 3.13% / 3.19% | -531 bps / -495 bps | Below WACC |
Operating cash flow dropped 57.73% to $549.9 million in FY26, while CapEx jumped 64.41% to $320.6 million (58.30% of OCF vs. 14.99% in FY25) to fund cleanroom expansion, Woburn line transfers to Newbury Park, and Mexicali 3D die-stacking automation. Consequently, FCF fell 79.26% to $229.3 million. Although FY26 FCF conversion printed at 133.24%, non-cash add-backs of $656.5 million equaled 381.5% of GAAP net income, masking severe working capital absorption. Total capital outlays across R&D ($785.5 million in FY25; $837.0 million in FY26), CapEx, shareholder returns, and FY26 M&A advisory fees totaled $2,242.8 million in FY25 and $1,592.2 million (plus $84.7 million M&A fees) in FY26. In FY26, Skyworks slashed program share repurchases by 86.21% from $830.2 million (12.7 million shares; $837.6 million including settlement timing) to $114.5 million (1.6 million shares, or 49.93% of FCF vs. 75.08% in FY25). Because quarterly dividends of $0.71 per share over three quarters required $320.1 million (139.60% of FY26 FCF), the Board indefinitely terminated cash dividends on July 28, 2026 ahead of the Qorvo closing.
On the balance sheet, Skyworks raised $2,000.0 million in Senior Notes in August 2026, inflating total debt from $995.8 million to $2,472.8 million, total liabilities by 72.3% from $2,159.9 million to $3,721.1 million, and ending cash and marketable securities to $2,606.1 million (against $5,715.7 million in stockholders' equity). This pushed financial leverage to 1.651x and depressed ending ROIC by 531 bps to 3.13%—well below Skyworks' ~8.5%–9.5% cost of capital (WACC).
Inventory Overhang, Working Capital Cycle, and Intangible Amortization Cliff
Forensic inventory analysis refutes the thesis of a strategic "die bank" build. Had Skyworks proactively buffered generic silicon for FY27 launches, capital would have concentrated in flexible, unpackaged WIP wafers; instead, WIP share contracted by 700 bps to 64.63%, while finished goods—custom-packaged, EMI-shielded System-in-Package (SiP) modules bound to specific handset sockets—surged 87.66% to $317.7 million. Maintaining high fab utilization buffered GAAP gross margins by capitalizing fixed overhead onto the balance sheet, while "take-or-pay" foundry agreements forced continued wafer intake. Under Note 11, refundable deposits and capacity prepayments expanded 159.5% from $26.4 million in FY25 ($7.7 million current, $18.7 million non-current; down from $167.8 million in FY24 following a $47.5 million FY23 impairment) to $68.5 million in FY26 ($37.7 million current, $30.8 million non-current), after absorbing a $37.7 million supply impairment charge. Under ASC 330, excess and obsolete inventory write-downs permanently reduce cost basis through COGS and cannot be reversed.
Goodwill remained unchanged at $2,176.7 million with zero impairment in FY25 and FY26. Net identifiable intangible assets (primarily from the 2021 Silicon Labs Infrastructure & Automotive acquisition) declined by $175.3 million from $809.0 million to $633.7 million (gross $1,504.0 million; accumulated amortization $(870.3) million), comprising Developed Technology & Other ($577.2 million net, 6.4-year weighted average life, $1,396.5 million gross, $(819.3) million accumulated), Technology Licenses ($56.5 million net, 3.2-year life, $107.5 million gross, $(51.0) million accumulated), and IPR&D ($0.0 million vs. $2.8 million in FY25). On a standalone basis, existing amortization—over 99% absorbed in COGS, compressing gross margins by 430–450 bps—faces a sharp step-down in FY28–FY29 before new Qorvo purchase accounting intangibles reset the pool in FY27.
End-Market Concentration, Litigation, and Tax Contingencies
Under ASC 280, Skyworks operates as a single reportable segment under Chief Operating Decision Maker (CODM) CEO Philip Brace. However, Note 14 disaggregates revenue across its primary Tier-1 mobile customer (Apple Inc.), sales channels, and Broad Markets.
Table: Skyworks Solutions End-Market Concentration and Sales Channel Mix (FY2025–FY2026)
| Business Dimension / Sales Channel | FY2025 Net Revenue | FY2026 Net Revenue | Absolute Change | YoY Growth | FY26 Revenue Share |
| Primary Tier-1 Customer (Apple Inc.) | $2,738.2 million (67.0%) | $2,415.4 million (61.0%) | -$322.8 million | -11.79% | 61.00% |
| Diversified / Broad Markets (Non-Apple) | $1,348.7 million (33.0%) | $1,544.2 million (39.0%) | +$195.5 million | +14.50% | 39.00% |
| Distribution Sales Channel (30–60d Terms) | $3,525.6 million (86.27%) | $3,394.0 million (85.72%) | -$131.6 million | -3.73% | 85.72% |
| Direct Sales Channel (Auto / Defense) | $561.3 million (13.73%) | $565.6 million (14.28%) | +$4.3 million | +0.77% | 14.28% |
| Total Consolidated Net Revenue | $4,086.9 million | $3,959.6 million | -$127.3 million | -3.11% | 100.00% |
In Note 11 legal proceedings, Skyworks formally settled Denso Corporation's piezoelectric thin-film patent infringement lawsuits (filed June 20 and October 31, 2025 in U.S. District Court for the Central District of California and Osaka District Court over U.S. Patent 7,758,979 and Japanese Patents JP5190841 and JP5966199) for an immaterial charge during FY26, protecting Osaka filter production. Conversely, on May 6, 2026, the federal court denied Skyworks' motion to dismiss the March 4, 2025 securities fraud class action (and three April 2025 derivative suits), advancing the litigation into discovery. Under Note 8, Singapore's tax holiday expires September 30, 2030; it reduced Singapore taxes by $67.7 million ($0.42/share) in FY24, $6.6 million ($0.04/share) in FY25, and $6.6 million ($0.04/share) in FY26, following a $19.0 million FY25 remeasurement charge and carrying a $336.4 million cumulative FY21–FY25 clawback exposure if local headcount or capex covenants are breached. Unrecognized tax benefits rose from $64.2 million in FY25 to $83.2 million in FY26 ($65.5 million would lower the effective tax rate if recognized, alongside $13.9 million in accrued interest/penalties), while active audits span IRS FY24 and California FTB FY22–FY23, with open tax years across the U.S. (FY23+), California (FY08+), Mexico/Japan (FY19+), and Singapore (FY21+), alongside OECD Pillar Two top-up tax exposure.
Infrastructure Footprint, Qorvo Combination Architecture, and Competitive Positioning
Skyworks maintains a hybrid integrated device manufacturer (Hybrid IDM) footprint pairing internal compound semiconductor and acoustic filter fabs with external pure-play silicon foundries, primarily in Taiwan, China, for CMOS, BiCMOS, and RF Silicon-on-Insulator (RF SOI) switches. Total net PP&E of $1,197.6 million is concentrated in Japan ($459.6 million, 38.38%), Mexico ($327.7 million, 27.36%), Singapore ($223.1 million, 18.63%), and the United States ($160.2 million, 13.38%, down from $226.8 million in FY25 due to Woburn's impairment). In August 2025, Skyworks initiated the closure of its 158,000 sq. ft. Woburn, Massachusetts fab, consolidating GaAs lines into Newbury Park, California and classifying $12.5 million of residual Woburn PP&E as held for sale. Meanwhile, Skyworks' 412,300 sq. ft. Singapore filter assembly sublease expires in July 2030 amid landlord parcel redevelopment, creating a 3-to-4-year mandatory relocation and requalification requirement. Prior divestitures of assembly and test sites in China and Costa Rica, alongside Qorvo's North Carolina fab sale and SAW transfer to Texas, further alter the post-merger operational map.
Geographic Revenue Disaggregation and Geopolitical Supply Exposure
Disaggregated by OEM headquarters under Note 14 (and strictly designating Taiwan as Taiwan, China per UN conventions), U.S. OEMs—anchored by Apple—accounted for 76.35% of FY26 revenue. Conversely, revenue attributed to OEMs and ODMs headquartered in Taiwan, China (including Foxconn, Pegatron, Quanta, and Compal, supported by Skyworks Solutions Worldwide, Inc., Taiwan Branch) expanded 13.05% YoY to $292.9 million, while direct China revenue (Xiaomi, OPPO, VIVO, serviced via Skyworks Solutions Commercial (Shenzhen) Co., Ltd. with Beijing and Shanghai branches, plus Advanced Analogic Technologies (China), Inc.) stabilized at $254.4 million. Management flags critical supply chain vulnerability to Taiwan Strait disruptions, U.S. tariffs, BIS Entity List expansions driving China domestic substitution, and export controls on gallium, germanium, antimony, tungsten, molybdenum, scandium, and rare earth elements.
Table: Skyworks Solutions Geographic Net Revenue by OEM Headquarters (FY2025–FY2026)
| Geographic Region (OEM Headquarters) | FY2025 Net Revenue ($M) | FY2026 Net Revenue ($M) | YoY Change ($M) | YoY Growth (%) | FY25 / FY26 Share |
| United States | $3,157.1 | $3,023.2 | -$133.9 | -4.24% | 77.25% / 76.35% |
| Taiwan, China | $259.1 | $292.9 | +$33.8 | +13.05% | 6.34% / 7.40% |
| China | $254.2 | $254.4 | +$0.2 | +0.08% | 6.22% / 6.43% |
| Europe, Middle East & Africa (EMEA) | $185.8 | $178.9 | -$6.9 | -3.71% | 4.55% / 4.52% |
| South Korea (Samsung) | $190.1 | $170.8 | -$19.3 | -10.15% | 4.65% / 4.31% |
| Other Asia-Pacific | $40.6 | $39.4 | -$1.2 | -2.96% | 0.99% / 1.00% |
| Total Net Revenue | $4,086.9 | $3,959.6 | -$127.3 | -3.11% | 100.00% / 100.00% |
Qorvo Transaction Architecture, Debt Financing, and Regulatory Clearances
Executed on October 27, 2025 and closed on October 5, 2026 (first week of FY27) following Hart-Scott-Rodino (HSR) waiting-period expiration and international clearances without structural fab divestitures, the two-step acquisition of Qorvo, Inc. [NASDAQ: QRVO] delivered total consideration of $10.2 billion ($8.9 billion net of $1.3 billion acquired Qorvo cash; ~$22 billion implied combined enterprise value at signing). Qorvo shareholders received 0.960 Skyworks shares plus $32.50 in cash per share, totaling $7.2 billion in equity (85.3 million newly issued SWKS shares, expanding post-close share count by 57.5% from 149.1 million to 234.9 million for a 63% Skyworks / 37% Qorvo ownership split, plus ~4.6 million assumed employee RSUs/PSUs) and $2.9 billion in cash.
To fund the cash outlay alongside cash on hand and its $750.0 million revolver, Skyworks issued $2,000.0 million in Senior Notes on August 10, 2026 ($800 million 5.00% Notes due 2028, $600 million 5.75% Notes due 2032, and $600 million 6.25% Notes due 2036), supplementing existing $500 million 3.00% Notes due 2031. On October 7, 2026, Skyworks completed debt exchange offers issuing $1,424.9 million in replacement notes ($778.1 million of 4.375% Notes due 2029 and $646.8 million of 3.375% Notes due 2031) for Qorvo legacy debt, with $123.5 million remaining unexchanged. Pro forma combined debt now approaches ~$4.0 billion, projecting an annual interest expense run-rate exceeding $180–$200 million. The merger agreement included a $298.7 million superior-proposal termination fee and a $100.0 million antitrust reverse termination fee (Outside Date April 27, 2027, extendable to October 27, 2027).
Competitive Benchmarking, Technology Process Spectrum, and Porter's Five Forces
Combining Skyworks and Qorvo consolidates the historical four-player Tier-1 RF front-end (RFFE) oligopoly alongside Broadcom Inc. [NASDAQ: AVGO], Qualcomm Inc. [NASDAQ: QCOM], and Murata Manufacturing, uniting ~12,000 patents and ~7,000 enterprise customers. Under Porter's Five Forces, Threat of New Entrants is Low ($837.0 million standalone R&D, cleanrooms, 12,000+ patents), Bargaining Power of Suppliers is Moderate-High (Taiwan, China foundry concentration, $68.5 million take-or-pay deposits, rare earth/GaN controls), Bargaining Power of Buyers is Very High (Apple 61% of FY26 sales, top 3 customers 75% of gross receivables, dual-sourcing), Threat of Substitutes is Moderate (Qualcomm modem-to-RF bundling and OEM in-house silicon vs. immutable RF physics), and Competitive Rivalry is High (annual ASP erosion and filter skirt competition).
Table: Skyworks Post-Qorvo Competitive Benchmarking Matrix
| Competitor | Core Product Overlap | Structural Industry Position | Structural Offset / Primary Battleground |
| Broadcom Inc. | High-band FBAR/BAW filters, flagship front-ends | High-Q FBAR acoustic dominance in mid/high-band sockets | Capital allocation tilted to AI ASICs & VMware; Apple flagship & Wi-Fi 7 filtering |
| Qualcomm Inc. | Complete modem-to-RF chains, RF SOI, ultra-SAW, PAs | Snapdragon baseband-to-antenna bundling incentives | OEM resistance to single-vendor lock-in; premium & mid-tier Android handsets |
| Murata Manufacturing | Low-band modules, TC-SAW/SAW filters, passives | Scale leader in discrete SAW filters & ceramic passives | Weaker active PA & high-frequency BAW integration; automotive & diversity modules |
| ADI / Texas Instruments | Precision timing, digital power isolators, BMS | 60%+ gross margins; high switching costs in catalog analog | Slower multi-protocol RF SiP miniaturization; EV BMS & AI PCIe Gen 6/7 clocking |
Across frequency process routes, Skyworks leverages internal GaAs and Osaka TC-SAW alongside external Taiwan, China RF SOI for Low-to-Mid bands (<2.5 GHz) via its Sky5® SiP platform. In High and Ultra-High bands (2.5–7.1 GHz, covering 5G n77/n78/n79 and Wi-Fi 6E/7), Qorvo's mature scandium-doped aluminum nitride BAW wafer fabs in Texas and Oregon narrow Broadcom's historical FBAR lead, while RF GaN strengthens Skyworks' mmWave/FR3 (7–24 GHz and 30+ GHz), 5G-Advanced, satellite non-terrestrial network (NTN), and defense radar portfolio. Outside mobile—where 12-month lifecycles and annual re-bids yield low-to-moderate switching costs—Broad Markets deliver 7–10+ year lifecycles and 18–36 month AEC-Q100 and ISO 26262 automotive qualification moats across 800V EV traction inverters, onboard chargers, BMS isolators, C-V2X telematics, in-vehicle infotainment (with 90% of new cars forecast connected by 2030), DOCSIS cable broadband, and ultra-low jitter clocks for 800G/1.6T optical transceivers and PCIe Gen 6/7 AI clusters (with global 5G subscriptions projected at 6.4 billion by 2031).
HDIN Institutional Verdict: Strategic Narrative vs. Operational Reality
Management's strategic narrative centers on transforming Skyworks from a smartphone RF supplier into a diversified connectivity, Edge AI, software-defined vehicle (SDV), and AI infrastructure platform via the Qorvo combination. However, a forensic comparison between management's Item 7 commentary and Item 1A textual shifts reveals material operational friction. Across the FY26 Form 10-K, key Item 1A risk disclosures shifted from hypothetical phrasing ("may/could") to materialized operational drag ("have experienced / are experiencing"). Specifically, management confirmed ongoing Tier-1 socket and content losses from dual-sourcing and customer in-house baseband integration, actual supplier delivery delays and quality/reliability failures, yield and quality losses from transitioning to PFAS-free manufacturing that triggered customer defections, Mexican Peso appreciation inflating Mexicali operating expenses, and AI data center wafer-crowding forcing additional take-or-pay foundry commitments.
Furthermore, the FY26 Form 10-K introduced four standalone risk categories: (1) U.S. Department of Defense (DoD) and aerospace budget sequestration and compliance risks inherited from Qorvo; (2) indirect demand suppression as smartphone OEMs absorb DRAM and NAND memory shortages and price spikes; (3) restructuring execution risks, including unintended attrition and European Works Council severance disputes; and (4) goodwill and intangible asset impairment exposure on the $10.2 billion Qorvo purchase price allocation.
Governance and executive leadership underwent comprehensive restructuring across FY25–FY26 to execute this pivot. Philip G. Brace replaced Liam Griffin as President and CEO on February 17, 2025 (appointed February 4); Todd Lepinski replaced Carlos S. Bori as SVP of Sales and Marketing on June 2, 2025 (appointed May 7); and Philip Carter replaced Kris Sennesael as SVP and CFO on September 8, 2025 (appointed August 23), while EVP and COO/CTO Reza Kasnavi remained to oversee fab transitions. Upon the Qorvo closing, the Board expanded from 9 to 11 seats (7 Skyworks, 3 Qorvo led by former CEO Robert Bruggeworth, and 1 joint director), with Bruggeworth, Richard Clemmer, and Chris Koopmans signing the November 10, 2026 Form 10-K and Kevin L. Beebe departing. Internal controls remain intact: both management (under COSO 2013 and SOX 404) and independent auditor KPMG LLP issued unqualified opinions on ICFR for FY25 and FY26, identifying an identical Critical Audit Matter (CAM) regarding manual tax provision evaluations across foreign jurisdictions. Executive pay aligns via annual cash Executive Incentive Plan (EIP) targets (100% base target, 200% cap tied to Net Revenue, Operating Margin, and OCF), 3-year Monte Carlo relative and 60-day absolute TSR Performance Share Awards (0%–200% payout), and a mandatory SEC/Nasdaq Clawback Policy (Exhibit 97.1).
Ultimately, Skyworks enters FY27 with $1,070.0 million in inventory, $317.7 million in finished goods vulnerable to ASC 330 write-downs, 3.13% ROIC, and ~$4.0 billion in pro forma debt. Suspending the $320 million annual dividend provides necessary liquidity, but restoring ROIC above WACC requires flawless execution on Woburn-to-Newbury Park fixed-cost savings, Qorvo fab integration, and inventory liquidation rather than top-line rhetoric alone.
Key Financial Questions From the FY2026 Filing
What drove Skyworks' 56.66% operating income collapse despite only a 3.11% revenue decline in FY2026?
Skyworks suffered 18.2x negative operating leverage as a $322.8 million (-11.79%) revenue drop at Apple Inc. (falling from 67% to 61% of net revenue) coincided with $84.7 million in Qorvo M&A advisory fees in SG&A, $124.2 million in restructuring and impairment charges (+413.22% YoY), and a 6.56% increase in R&D to $837.0 million (21.14% of sales). While Broad Markets grew 14.50% to $1,544.2 million (39% of sales), GAAP operating margin compressed by 676 bps from 12.23% to 5.47%, and GAAP net income fell 63.93% to $172.1 million.
How did inventory accumulation and take-or-pay foundry commitments impact FY2026 Free Cash Flow?
Free cash flow dropped 79.26% from $1,105.8 million in FY25 to $229.3 million in FY26 as operating cash flow fell 57.73% to $549.9 million and CapEx rose 64.41% to $320.6 million. Total inventories expanded 41.78% to $1,070.0 million—led by an 87.66% surge in finished goods to $317.7 million and a +52.1-day jump in DIO to 166.6 days—absorbing $316.7 million of operating cash flow alongside $68.5 million in foundry capacity prepayments and a $37.7 million excess supply deposit impairment.
How is Skyworks financing the $10.2 billion Qorvo acquisition and managing its pro forma capital structure?
Completed on October 5, 2026 for 0.960 Skyworks shares and $32.50 in cash per Qorvo share ($7.2 billion equity via 85.3 million new shares plus $2.9 billion cash, or $8.9 billion net of $1.3 billion acquired cash), the transaction was funded via an August 10, 2026 offering of $2,000.0 million in Senior Notes (due 2028, 2032, and 2036) and cash on hand. Combined with $1,424.9 million in October 7, 2026 exchange notes ($123.5 million unexchanged) and existing 2031 notes, pro forma debt approaches ~$4.0 billion with >$180–$200 million in annual interest expense, leading the Board to terminate cash dividends on July 28, 2026.
Presentation Download & Analyst Briefing Access:
- Institutional Presentation: Download the full "Skyworks_Solutions_Strategic_Due_Diligence" PDF under the 'Related Topics' section.
- Analyst Video Briefing: Watch the "Skyworks & Qorvo $10.2B Merger: Can Broad Markets Fix a 56.6% Profit Collapse and $4.05B Debt?" on the HDIN Research YouTube Channel.
About HDIN Research:
HDIN Research is a premier global market intelligence and strategic advisory firm specializing in institutional-grade financial analysis, supply chain audits, and macroeconomic forecasting. Our dedicated sector analysts deliver actionable, data-driven insights tailored for private equity, hedge funds, and corporate strategy teams. Visit us at https://www.hdinresearch.com.
Editorial & Methodology Disclosure:
"This market intelligence brief was researched, modeled, and audited by the HDIN Research Equity Desk based on official primary corporate filings (Skyworks Solutions, Inc. FY2026 Form 10-K Ended October 2, 2026 and FY2025 Form 10-K Ended October 3, 2025). Proprietary quantitative extraction tools were utilized to ensure 100% fidelity to reported financial line items and footnotes. All forensic interpretations, segmental benchmarks, and institutional verdicts were independently written and verified by HDIN senior sector analysts in accordance with institutional research standards."