Beyont Ltd. FY26 Q3 Analysis: 21.78% OPM on AI Cross-Sell
Date : 2026-11-17
Reading : 291
BEIJING — HDIN Market Intelligence Brief | Audited by HDIN Equity Research Desk | Source Filing: Tokyo Stock Exchange Growth Market IPO Securities Registration Statement (Form I, Filed November 10, 2026; FY2025/11 & Period 9 Q3 2026)
HDIN Executive Takeaways
1. Operating Leverage Inflection: Period 9 Q3 revenue hit JPY 1,329.60 million (93.84% of FY2025/11), driving operating margin up 498 bps to 21.78% as SG&A fell 984 bps to 53.22%.
2. Liquidity & Regional Footprint: Cash rose 29.13% to JPY 1,158.75 million against JPY 162.49 million debt (-JPY 996.27 million net debt), anchored across two Tokyo offices with zero exposure in Taiwan, Province of China.
3. Institutional Verdict: Upfront contract liabilities (JPY 427.91 million) self-fund growth, tempered by 10.26% option dilution and JPY 100.00 million KICONIA WORKS earn-out exposure.
Figure Beyont Ltd IPO Executive Briefing 5-Year Financial Traiectory, Dual-Engine AX Mechanics & Strategic Governance
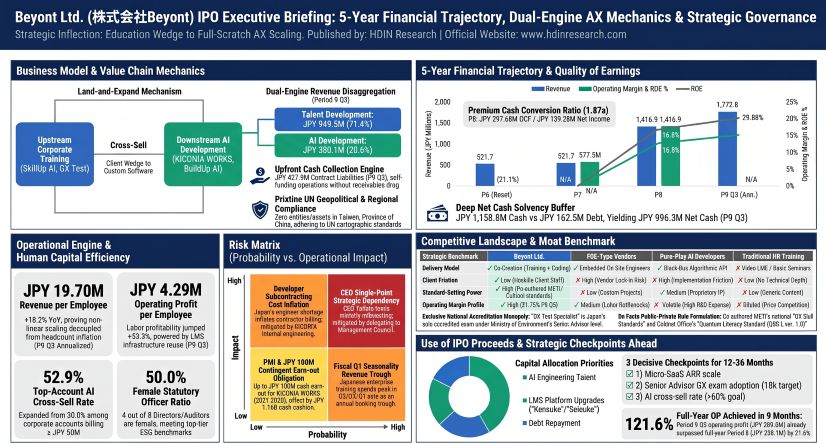 Beyont FY26 Q3 Segmental Revenue, Margin Leverage, and DuPont Balance Sheet Dynamics
Beyont Ltd. [TSE Growth Market IPO Filing / Formerly SkillUp NeXt Co., Ltd.] generated JPY 1,329,603 thousand in consolidated revenue and JPY 289,586 thousand in operating profit (21.78% operating margin) during the nine-month Period 9 Q3 cumulative window ended August 31, 2026, surpassing its entire FY2025/11 (Period 8) operating profit of JPY 238,092 thousand by 21.63%. Under Japanese GAAP (J-GAAP) and Accounting Standard for Revenue Recognition (ASBJ Statement No. 29), Beyont reports as a single AI Solution Business segment while disaggregating top-line sales into Talent Development Services (SkillUp AI, SkillUp Green, GX Test, SkillUp AIgent) and AI Development Services (BuildUp AI, KICONIA WORKS full-scratch engineering, and vertical micro-SaaS modules "Kensuke" and "Seisuke").
Across full annual reporting periods from Period 3 (FY2021/4: JPY 262,382 thousand) through Period 8 non-consolidated (FY2025/11: JPY 1,298,568 thousand), revenue expanded at a 4.58-year compound annual growth rate (CAGR) of 41.52%, with Period 8 consolidated revenue of JPY 1,416,954 thousand representing a 5.40x expansion over Period 3. A historical contraction in Period 6 (FY2024/4), when revenue fell 16.03% YoY to JPY 521,726 thousand alongside an ordinary loss of JPY 100,122 thousand and net loss of JPY 74,734 thousand, resulted from the mandatory cumulative retrospective adoption of ASBJ Statement No. 29 coupled with corporate client budget deferrals. Following a July 29, 2024 shareholder resolution shifting the fiscal year-end from April 30 to November 30 (creating the 7-month transitional Period 7 ended November 30, 2024) and the April 30, 2025 acquisition of KICONIA WORKS, AI Development revenue accelerated from JPY 7,442 thousand (1.29% share) in Period 7 to JPY 289,584 thousand (20.44% share) in Period 8 and JPY 380,134 thousand (28.59% share) in Period 9 Q3—up 31.27% in nine months relative to Period 8 full-year output.
Table: Beyont Ltd. Multi-Period Income Statement, Segmental Mix, and Profitability Ratios (JPY in Thousands)
*Note: N/D indicates "Not disclosed in prospectus" for pre-IPO audit periods P3–P6 or un-disaggregated interim items. Extraordinary gains and losses were zero across P3 through P9 Q3.*
Cost behavior and Cost-Volume-Profit (CVP) decomposition confirm that platform scalability is absorbing direct engineering cost dilution. In Period 9 Q3, consolidated gross margin contracted 487 bps to 75.00% (from 79.87% in Period 8 and 84.42% in Period 7 non-consolidated) because custom software development requires higher direct engineering labor and external subcontracting. In Period 8 non-consolidated COGS (JPY 239,358 thousand), direct labor accounted for JPY 131,585 thousand (50.44% of manufacturing costs; vs. JPY 46,905 thousand or 53.53% in Period 7) and direct expenses accounted for JPY 129,303 thousand (49.56%), including JPY 78,159 thousand in subcontracting (29.96%), JPY 23,843 thousand in depreciation (9.14%), and JPY 19,436 thousand in telecommunications (7.45%), adjusted for beginning WIP of JPY 14,788 thousand and ending WIP of JPY 36,317 thousand (Period 7 total manufacturing costs: JPY 87,624 thousand, subcontracting JPY 27,813 thousand [31.74%], depreciation JPY 11,410 thousand [13.02%], telecom JPY 8,548 thousand [9.76%], beginning WIP JPY 17,164 thousand, ending WIP JPY 14,788 thousand). Raw material costs are zero. Within Period 8 consolidated SG&A (JPY 893,570 thousand), salaries and allowances totaled JPY 241,038 thousand (non-consolidated: JPY 250,211 thousand or 30.03% of SG&A), subcontracting JPY 140,809 thousand (non-consolidated: JPY 142,637 thousand or 17.12%), advertising JPY 134,066 thousand (16.09% non-consolidated), goodwill amortization JPY 8,698 thousand, and other SG&A JPY 368,959 thousand (non-consolidated executive compensation JPY 63,300 thousand [7.60%], other JPY 243,116 thousand [29.17%]). In Period 9 Interim, SG&A totaled JPY 483,062 thousand (salaries JPY 171,775 thousand, subcontracting JPY 41,924 thousand, goodwill amortization JPY 7,455 thousand, other JPY 261,908 thousand). Consequently, consolidated SG&A as a share of revenue compressed 984 bps from 63.06% in Period 8 to 53.22% in Period 9 Q3, lifting operating margin by 498 bps to 21.78% and EBITDA margin by 480 bps to 24.21%.
Because fixed corporate overhead is absorbed above the Period 9 Q3 break-even point of JPY 812,854 thousand (Margin of Safety: 38.86%, expanding from 26.17% in Period 8), each incremental JPY 100.00 million in consolidated revenue generates JPY 64.21 million in contribution margin (at the Period 8 consolidated 35.79% variable cost ratio: ~JPY 16.0 million outsourced engineering, ~JPY 9.5 million marketing, ~JPY 10.3 million cloud/platform), yielding JPY 42.00 million to JPY 48.00 million in incremental operating profit (~JPY 45.0 million blended) after step-fixed additions of JPY 16.00 million to JPY 22.00 million (2–3 engineers/project managers at JPY 6.0 million–JPY 7.0 million plus JPY 3.0 million–JPY 4.0 million support). Pure Talent Development increments yield JPY 60.00 million–JPY 70.00 million in operating profit versus JPY 30.00 million–JPY 35.00 million for Custom AI Development.
Table: Beyont Ltd. Consolidated Balance Sheet, Cash Flows, Capital Returns, and Working Capital Metrics (JPY in Thousands)
DuPont decomposition of Period 8 consolidated ROE (29.88%) confirms profitability restoration as the primary return driver: a 11.24% net profit margin multiplied by 1.004x total asset turnover and a 2.648x equity multiplier. While the 37.76% Period 8 equity ratio (43.72% at Period 9 Q3) suggests optical leverage, JPY 390,275 thousand (44.42%) of Period 8 total liabilities and JPY 427,905 thousand (47.44%) of Period 9 Q3 liabilities represent non-interest-bearing Contract Liabilities from upfront corporate tuition. Cash reserves of JPY 1,158,752 thousand cover short-term debt (JPY 42,004 thousand) by 27.59x and total interest-bearing debt (JPY 162,485 thousand) by 7.13x, alongside JPY 80,000 thousand in undrawn bank credit lines. With Period 8 NOPAT of JPY 155,736 thousand (calculated at the 34.59% statutory effective tax rate) and negative Invested Capital of -JPY 167,382 thousand (Equity JPY 533,054 thousand + Debt JPY 196,929 thousand - Cash JPY 897,365 thousand), Beyont operates a negative-working-capital engine: Period 8 DSO averaged 31.47 days, DIO averaged 35.39 days, and DPO equivalent averaged 70–80 days (zero trade payables, settled via JPY 104,842 thousand Other Accounts Payable and JPY 56,398 thousand Accrued Expenses). Non-operating items remained minimal: Period 7 recorded JPY 1,410 thousand non-operating income (interest JPY 57 thousand, point rebates JPY 229 thousand, other JPY 1,123 thousand) and JPY 914 thousand expenses (interest JPY 530 thousand, other JPY 383 thousand); Period 8 recorded JPY 5,005 thousand income (interest JPY 1,079 thousand, subsidy JPY 1,500 thousand or 0.63% of pre-tax profit, point rebates JPY 1,510 thousand, other JPY 916 thousand) and JPY 3,585 thousand expenses (interest JPY 2,478 thousand, other JPY 1,106 thousand); Period 9 Q3 recorded JPY 3,437 thousand income (interest JPY 2,204 thousand, cancellation fees JPY 577 thousand, point rebates JPY 605 thousand, other JPY 49 thousand) and JPY 4,429 thousand expenses (interest JPY 2,326 thousand, listing-related fees JPY 2,000 thousand, other JPY 102 thousand).
Beyont Tokyo Infrastructure Footprint, Capex Allocation, and Statutory GX Moats
Beyont maintains an asset-light digital service infrastructure anchored entirely across two leased offices in Tokyo, Japan, engaging in zero physical manufacturing, zero raw material procurement, and zero overseas tangible fixed assets. Domestic Japanese sales exceed 90.0% of consolidated revenue (overseas sales below 10.0%), and in strict accordance with United Nations geographical nomenclatures, Beyont holds zero subsidiaries, zero offices, zero personnel, zero supply chain nodes, and zero commercial exposure in Taiwan (China).
As of September 30, 2026, consolidated full-time headcount reached 90 employees (up from 12 in P3, 16 in P4, 28 in P5, 47 in P6, 56 in P7, and 85 in P8), with parent personnel averaging 36.0 years of age, 2.2 years of service tenure, and JPY 5,884,653 in average annual salary under non-unionized, dispute-free labor relations. Annualized Period 9 Q3 productivity rose to JPY 19,698 thousand in revenue per employee (+18.16% vs. JPY 16,670 thousand in P8) and JPY 4,290 thousand in operating profit per employee (+53.16% vs. JPY 2,801 thousand in P8), while total direct labor burden fell from 28.65% of revenue in P8 to 24.12% in P9 Q3 and revenue per Tokyo office stood at JPY 708.48 million in P8.
Digital delivery relies on cloud compute subscriptions via Microsoft Azure and Microsoft 365, alongside a dispersed domestic network of external AI engineers and seminar lecturers. Beyont capitalizes zero standalone registered patents and reports zero R&D line-item expenses; instead, self-use software additions are capitalized under intangible assets (JPY 21,099 thousand added in P8, comprising JPY 10,850 thousand for "SkillUpAI LMS" and JPY 8,546 thousand for "SkillCheck AI"; software-in-progress additions JPY 14,174 thousand, ending WIP JPY 651 thousand; gross software JPY 131,320 thousand, accumulated amortization JPY 62,635 thousand, net software JPY 68,685 thousand amortized 5-year straight-line; tangible buildings depreciated 3–16 years and tools 3–5 years). Operational licenses include an ISO/IEC 27001 certification (October 24, 2024) and a Ministry of Health, Labour and Welfare Fee-Charging Employment Placement License for "SkillUp AIgent." Although exact IPO offering pricing and gross proceeds are deferred to post-bookbuilding filings, management earmarked IPO proceeds across four priorities: (1) AI engineer, data scientist, and enterprise sales recruitment; (2) platform upgrades for SkillUpAI LMS, ExamAI automated grading, and vertical micro-SaaS modules ("Kensuke" and "Seisuke"); (3) brand marketing for GX and DX divisions; and (4) accelerated repayment of the JPY 162,485 thousand bank debt incurred for the JPY 220.00 million KICONIA WORKS acquisition.
Beyont's commercial funnel targets four national policy tailwinds cited in its prospectus: IDC Japan's forecast of a JPY 6,889.7 billion (~JPY 6.89 trillion) domestic AI business market by 2029 (36% CAGR 2024–2029, 2.9x CY2025 levels); the Japan Growth Strategy Council's JPY 3 trillion Vertical/Physical AI forecast by 2030; McKinsey's USD 2.7 trillion global quantum economic value forecast by 2035 (alongside Japan's 10 million users / JPY 50 trillion 2030 target); and over JPY 150 trillion in 10-year public-private GX investment backed by JPY 20 trillion in government GX Economic Transition Bonds and mandatory Sustainability Standards Board of Japan (SSBJ) Scope 1, 2, and 3 disclosures taking effect in FY2027 for Prime-listed firms with market capitalizations of JPY 3 trillion or above (finalized March 2025, codified February 2026). As of August 2026, Beyont had penetrated ~1,100 cumulative corporate clients, with zero single client representing 10% or more of revenue. Key enterprise accounts billing JPY 20 million or more annually rose 45.45% YoY from 11 in FY2024/11 to 16 in FY2025/11 (generating JPY 596.00 million combined, or JPY 37.25 million per account), while AI development cross-sell conversion among top accounts (>= JPY 50 million) climbed 2,290 bps from 30.0% to 52.9% (targeting >60%). Cumulative "GX Test" examinees (priced at JPY 11,000–JPY 16,500 per test) reached 13,424 by FY2025/11 with 9,363 Ministry of the Environment certified Decarbonization Advisors (FY2026/11 targets: 18,000 examinees and 14,000 passers), anchored by Beyont's exclusive status as Japan's sole accredited provider of the "GX Test Specialist" exam for Decarbonization Senior Advisors, its lead role authoring METI GX League's "GX Skill Standards" (May 2024), its Cabinet Office SIP Phase 3 / OIST / Q-STAR co-authorship of "Quantum Literacy Standard (QSS-L) ver. 1.0" (February 2026), and its status as an authorized Microsoft Copilot Specialization partner.
HDIN Institutional Verdict: Negative Net Debt Resilience vs. Governance, Earn-Out, and Subcontracting Risks
Cross-referencing Beyont's operational execution against statutory disclosures confirms that financial liquidity is robust, but four structural risks require forensic monitoring post-listing:
1. KICONIA WORKS PMI, Goodwill Exposure, and Contingent Earn-Out: The April 30, 2025 debt-funded acquisition (JPY 220.00 million cash; JPY 200.00 million bank loan) created JPY 149.12 million in goodwill (amortized over 10 years at JPY 14.91 million/year; JPY 129,240 thousand remaining at Period 9 Q3). Under the share purchase agreement, Beyont faces up to JPY 100.00 million in contingent cash earn-out payments tied to KICONIA WORKS operating profit thresholds between May 1, 2027 and April 30, 2028, which would expand goodwill and draw down liquid reserves.
2. Fiscal Seasonality and Subcontracting Cost Inflation: Corporate Japanese training budgets concentrate in March–May (Q2) while software acceptance testing (検収) and curriculum completion peak in Q3–Q4 (June–November), rendering Q1 (December–February) an earnings trough. Custom AI software contracts incur continuous bi-weekly/monthly developer outflows ahead of final acceptance, pushing WIP inventory from JPY 12.10 million at Period 9 Interim (May 31, 2026) to JPY 27.83 million at Q3 (August 31, 2026). Domestic AI talent scarcity risks subcontracting cost inflation, though internalizing KICONIA WORKS mitigates external contractor dependence.
3. Accounting & Audit Flags (Zero Bad Debt Allowance and Lease Overhaul): Management maintains zero general bad debt allowance against JPY 165,306 thousand (P8) and JPY 112,182 thousand (P9 Q3) in accounts receivable based on zero historical defaults, leaving no P&L buffer against an unexpected corporate default. Additionally, mandatory adoption of Japan's new Lease Accounting Standard (ASBJ Statement No. 34) in FY2028/11 will capitalize office leases (JPY 21.60 million annual HQ rent) onto the balance sheet. One minor pending former-employee lawsuit is assessed as without merit and immaterial by external counsel, and Grant Thornton Taiyo LLC (three-year tenure; partners Shinichiro Kamoda and Keiko Kuwahara; FY2025/11 audit fee JPY 14,400 thousand) issued an unqualified opinion.
4. Founder Voting Dominance and 10.26% Option Overhang: Following an August 25, 2026 1:1 conversion of 2,400 Series A Preferred Shares (originally issued November 30, 2022 at JPY 50,000/share for JPY 120.00 million to TSV1 Investment LP) and an August 27, 2026 1:100 stock split, total issued common shares stand at 3,240,000 shares alongside 370,300 unexercised stock options across Series 1–5 (10.26% of 3,610,300 fully diluted shares, or 11.43% of issued common shares). Founder and CEO Shinichi Tahara controls 65.97% of fully diluted equity and 73.51% of pre-IPO voting rights (54.01% via 100%-owned TS Asset Management Co., Ltd., to which he transferred 1,750,000 shares in November 2025 at JPY 181,615 thousand or JPY 103.78/share, plus 19.50% directly), enabling unilateral passage of special resolutions under Article 309, Paragraph 2 of the Companies Act of Japan. Earlier personal debt guarantees by Tahara on JPY 80,000 thousand in bank debt (balance JPY 50,457 thousand) were fully repaid and released on February 14, 2025, leaving zero ongoing related-party conflicts.
Governance checks balance concentrated founder control: Beyont operates as a Company with Board of Company Auditors featuring 5 Directors (40.0% Independent Outside Directors: Miyuki Zeniya [ex-NRI, J.P. Morgan AM, Polaris PE, Resona, Dai-ichi Life, MUFG Chief Sustainability Officer] and Yuko Tanaka [ex-Toyota, A.T. Kearney, Spacemarket, CrowdWorks], alongside Shinichi Tahara, Tomoya Izasawa, and Nobuya Ogawa) and 3 Outside Auditors (100% independent: full-time CPA Mitsuko Fujino [ex-Deloitte Tohmatsu], Yasunori Asami [ex-Intec], and attorney Setsuko Murakami [ex-Mori Hamada & Matsumoto]). Female representation reaches 50.0% among statutory officers (4 of 8) and 21.1% among managers, with 100% male childcare leave uptake and zero Subcontract Act or Labor Standards Inspection Office violations. In FY2025/11, total officer compensation was JPY 63,300 thousand in fixed base pay across 7 individuals (JPY 55,500 thousand for 5 internal directors; JPY 7,800 thousand for 2 outside officers; JPY 0 bonus or severance), well within July 29, 2026 statutory caps of JPY 500,000 thousand for directors and JPY 25,000 thousand for auditors.
Key Financial Questions From Beyont's Period 9 Q3 and IPO Filing
What drove Beyont Ltd.'s 498 bps operating margin expansion despite gross margin dilution in Period 9 Q3?
Consolidated operating margin rose from 16.80% in Period 8 to 21.78% in Period 9 Q3 because SG&A expenses fell 984 bps from 63.06% to 53.22% of revenue, absorbing fixed platform and corporate overhead across JPY 1,329.60 million in nine-month sales. This operating leverage offset a 487 bps gross margin contraction (from 79.87% to 75.00%) caused by a higher revenue mix of labor-intensive AI Development Services (28.59% of sales, up 31.27% in nine months).
How resilient is Beyont Ltd.'s pre-IPO balance sheet ahead of potential KICONIA WORKS earn-out liabilities?
Beyont entered its IPO filing with JPY 1,158.75 million in cash against JPY 162.49 million in interest-bearing debt (-JPY 996.27 million net debt), covering total debt 7.13x alongside JPY 80.00 million in undrawn bank credit lines. Even if the maximum JPY 100.00 million KICONIA WORKS earn-out is triggered between May 2027 and April 2028, upfront client prepayments (JPY 427.91 million in contract liabilities) and positive operating cash flow (JPY 297.65 million in Period 8) preserve liquidity.
Why did Beyont Ltd. record an ordinary loss in Period 6 before rebounding to 29.88% ROE in Period 8?
Period 6 (FY2024/4) revenue dropped 16.03% to JPY 521.73 million and ordinary losses hit -JPY 100.12 million due to the mandatory cumulative adoption of ASBJ Statement No. 29 revenue recognition rules and corporate client budget timing shifts. Following a fiscal year-end realignment to November 30 and the integration of KICONIA WORKS, consolidated revenue scaled to JPY 1,416.95 million in Period 8, restoring net margins to 11.24% and driving a DuPont ROE of 29.88%.
Presentation Download & Analyst Briefing Access:
- Institutional Presentation: Download the full "Beyont_Enterprise_Blueprint" PDF under the 'Related Topics' section.
- Analyst Video Briefing: Watch the "Beyont Ltd. IPO Audit: Can a 52.9% AI Cross-Sell Rate & ¥1.16B Cash Moat Beat Japan's IT Labor Crunch?" on the HDIN Research YouTube Channel.
About HDIN Research:
HDIN Research is a premier global market intelligence and strategic advisory firm specializing in institutional-grade financial analysis, supply chain audits, and macroeconomic forecasting. Our dedicated sector analysts deliver actionable, data-driven insights tailored for private equity, hedge funds, and corporate strategy teams. Visit us at https://www.hdinresearch.com.
Editorial & Methodology Disclosure:
"This market intelligence brief was researched, modeled, and audited by the HDIN Research Equity Desk based on official primary corporate filings (Beyont Ltd. Tokyo Stock Exchange Growth Market IPO Securities Registration Statement Form I, filed November 10, 2026; FY2025/11 audited financial statements and Period 9 Q3 interim financial statements reviewed by Grant Thornton Taiyo LLC). Proprietary quantitative extraction tools were utilized to ensure 100% fidelity to reported financial line items and footnotes. All forensic interpretations, segmental benchmarks, and institutional verdicts were independently written and verified by HDIN senior sector analysts in accordance with institutional research standards."
HDIN Executive Takeaways
1. Operating Leverage Inflection: Period 9 Q3 revenue hit JPY 1,329.60 million (93.84% of FY2025/11), driving operating margin up 498 bps to 21.78% as SG&A fell 984 bps to 53.22%.
2. Liquidity & Regional Footprint: Cash rose 29.13% to JPY 1,158.75 million against JPY 162.49 million debt (-JPY 996.27 million net debt), anchored across two Tokyo offices with zero exposure in Taiwan, Province of China.
3. Institutional Verdict: Upfront contract liabilities (JPY 427.91 million) self-fund growth, tempered by 10.26% option dilution and JPY 100.00 million KICONIA WORKS earn-out exposure.
Figure Beyont Ltd IPO Executive Briefing 5-Year Financial Traiectory, Dual-Engine AX Mechanics & Strategic Governance
Beyont FY26 Q3 Segmental Revenue, Margin Leverage, and DuPont Balance Sheet DynamicsBeyont Ltd. [TSE Growth Market IPO Filing / Formerly SkillUp NeXt Co., Ltd.] generated JPY 1,329,603 thousand in consolidated revenue and JPY 289,586 thousand in operating profit (21.78% operating margin) during the nine-month Period 9 Q3 cumulative window ended August 31, 2026, surpassing its entire FY2025/11 (Period 8) operating profit of JPY 238,092 thousand by 21.63%. Under Japanese GAAP (J-GAAP) and Accounting Standard for Revenue Recognition (ASBJ Statement No. 29), Beyont reports as a single AI Solution Business segment while disaggregating top-line sales into Talent Development Services (SkillUp AI, SkillUp Green, GX Test, SkillUp AIgent) and AI Development Services (BuildUp AI, KICONIA WORKS full-scratch engineering, and vertical micro-SaaS modules "Kensuke" and "Seisuke").
Across full annual reporting periods from Period 3 (FY2021/4: JPY 262,382 thousand) through Period 8 non-consolidated (FY2025/11: JPY 1,298,568 thousand), revenue expanded at a 4.58-year compound annual growth rate (CAGR) of 41.52%, with Period 8 consolidated revenue of JPY 1,416,954 thousand representing a 5.40x expansion over Period 3. A historical contraction in Period 6 (FY2024/4), when revenue fell 16.03% YoY to JPY 521,726 thousand alongside an ordinary loss of JPY 100,122 thousand and net loss of JPY 74,734 thousand, resulted from the mandatory cumulative retrospective adoption of ASBJ Statement No. 29 coupled with corporate client budget deferrals. Following a July 29, 2024 shareholder resolution shifting the fiscal year-end from April 30 to November 30 (creating the 7-month transitional Period 7 ended November 30, 2024) and the April 30, 2025 acquisition of KICONIA WORKS, AI Development revenue accelerated from JPY 7,442 thousand (1.29% share) in Period 7 to JPY 289,584 thousand (20.44% share) in Period 8 and JPY 380,134 thousand (28.59% share) in Period 9 Q3—up 31.27% in nine months relative to Period 8 full-year output.
Table: Beyont Ltd. Multi-Period Income Statement, Segmental Mix, and Profitability Ratios (JPY in Thousands)
| Financial & Segmental Metric | P3 (FY21/4) Non-Consol. | P4 (FY22/4) Non-Consol. | P5 (FY23/4) Non-Consol. | P6 (FY24/4) Non-Consol. | P7 (FY24/11, 7M) Non-Consol. | Ref. 12-Mo. (23/12–24/11) | P8 (FY25/11) Non-Consol. | P8 (FY25/11) Consol. | P9 Interim (6M to 26/5/31) Consol. | P9 Q3 (9M to 26/8/31) Consol. | P9 Q3 Annualized Run-Rate |
| Total Revenue | 262,382 | 343,143 | 621,302 | 521,726 | 577,512 | 906,471 | 1,298,568 | 1,416,954 | 879,318 | 1,329,603 | 1,772,804 (+25.11% vs P8) |
| YoY Growth Rate (%) | — | +30.78% | +81.06% | -16.03% | N/A (7-mo.) | — | +43.26% (vs Ref.) | — | — | 93.84% of P8 | +25.11% |
| — Talent Development Services | N/D | N/D | N/D | N/D | 570,070 (98.71%) | N/D | N/D | 1,127,370 (79.56%) | 611,121 (69.50%) | 949,469 (71.41%) | 1,265,959 (+12.29% vs P8) |
| — AI Development Services | N/D | N/D | N/D | N/D | 7,442 (1.29%) | N/D | N/D | 289,584 (20.44%) | 268,196 (30.50%) | 380,134 (28.59%) | 506,845 (+75.02% vs P8) |
| Cost of Goods Sold (COGS) | N/D | N/D | N/D | N/D | 90,001 (15.58%) | 131,412 (14.50%) | 239,358 (18.43%) | 285,292 (20.13%) | 228,529 (25.99%) | 332,393 (25.00%) | 443,191 (+55.35% vs P8) |
| Gross Profit | N/D | N/D | N/D | N/D | 487,511 | 775,059 | 1,059,210 | 1,131,662 | 650,788 | 997,210 | 1,329,613 (+17.49% vs P8) |
| Gross Margin (%) | N/D | N/D | N/D | N/D | 84.42% | 85.50% | 81.57% | 79.87% | 74.01% | 75.00% (-487 bps) | 75.00% |
| SG&A Expenses | N/D | N/D | N/D | N/D | 399,313 (69.14%) | 634,546 (70.00%) | 833,330 (64.17%) | 893,570 (63.06%) | 483,062 (54.93%) | 707,624 (53.22%) | 943,499 (+5.59% vs P8) |
| Operating Profit | N/D | N/D | N/D | N/D | 88,198 | 140,513 | 225,879 | 238,092 | 167,725 | 289,586 (121.63% P8) | 386,115 (+62.17% vs P8) |
| Operating Margin (%) | N/D | N/D | N/D | N/D | 15.27% | 15.50% | 17.39% | 16.80% | 19.07% | 21.78% (+498 bps) | 21.78% |
| Ordinary Profit | 47,621 | 67,791 | 157,053 | (100,122) | 88,694 | 159,966 | 227,014 | 239,513 | 167,942 | 288,594 (120.49% P8) | 384,792 (+60.66% vs P8) |
| Ordinary Margin (%) | 18.15% | 19.76% | 25.28% | -19.19% | 15.36% | 17.65% | 17.48% | 16.90% | 19.10% | 21.71% (+481 bps) | 21.71% |
| Net Income | 37,342 | 47,964 | 109,623 | (74,734) | 57,441 | N/D | 153,644 | 159,284 | 97,921 | 167,736 (105.31% P8) | 223,648 (+40.41% vs P8) |
| Net Profit Margin (%) | 14.23% | 13.98% | 17.64% | -14.32% | 9.95% | N/D | 11.83% | 11.24% | 11.14% | 12.62% (+138 bps) | 12.62% |
| D&A (Excl. Goodwill) | N/D | N/D | N/D | N/D | 17,506 | N/D | 23,843 | 28,240 | N/D | 21,160 | — |
| Goodwill Amortization | 0 | 0 | 0 | 0 | 0 | 0 | 0 | 8,698 | 7,455 | 11,183 | 14,912 |
| EBITDA (OP + D&A + Goodwill) | N/D | N/D | N/D | N/D | 105,704 (18.30%) | N/D | 249,722 (19.23%) | 275,030 (19.41%) | N/D | 321,929 (24.21%) | — |
Cost behavior and Cost-Volume-Profit (CVP) decomposition confirm that platform scalability is absorbing direct engineering cost dilution. In Period 9 Q3, consolidated gross margin contracted 487 bps to 75.00% (from 79.87% in Period 8 and 84.42% in Period 7 non-consolidated) because custom software development requires higher direct engineering labor and external subcontracting. In Period 8 non-consolidated COGS (JPY 239,358 thousand), direct labor accounted for JPY 131,585 thousand (50.44% of manufacturing costs; vs. JPY 46,905 thousand or 53.53% in Period 7) and direct expenses accounted for JPY 129,303 thousand (49.56%), including JPY 78,159 thousand in subcontracting (29.96%), JPY 23,843 thousand in depreciation (9.14%), and JPY 19,436 thousand in telecommunications (7.45%), adjusted for beginning WIP of JPY 14,788 thousand and ending WIP of JPY 36,317 thousand (Period 7 total manufacturing costs: JPY 87,624 thousand, subcontracting JPY 27,813 thousand [31.74%], depreciation JPY 11,410 thousand [13.02%], telecom JPY 8,548 thousand [9.76%], beginning WIP JPY 17,164 thousand, ending WIP JPY 14,788 thousand). Raw material costs are zero. Within Period 8 consolidated SG&A (JPY 893,570 thousand), salaries and allowances totaled JPY 241,038 thousand (non-consolidated: JPY 250,211 thousand or 30.03% of SG&A), subcontracting JPY 140,809 thousand (non-consolidated: JPY 142,637 thousand or 17.12%), advertising JPY 134,066 thousand (16.09% non-consolidated), goodwill amortization JPY 8,698 thousand, and other SG&A JPY 368,959 thousand (non-consolidated executive compensation JPY 63,300 thousand [7.60%], other JPY 243,116 thousand [29.17%]). In Period 9 Interim, SG&A totaled JPY 483,062 thousand (salaries JPY 171,775 thousand, subcontracting JPY 41,924 thousand, goodwill amortization JPY 7,455 thousand, other JPY 261,908 thousand). Consequently, consolidated SG&A as a share of revenue compressed 984 bps from 63.06% in Period 8 to 53.22% in Period 9 Q3, lifting operating margin by 498 bps to 21.78% and EBITDA margin by 480 bps to 24.21%.
Because fixed corporate overhead is absorbed above the Period 9 Q3 break-even point of JPY 812,854 thousand (Margin of Safety: 38.86%, expanding from 26.17% in Period 8), each incremental JPY 100.00 million in consolidated revenue generates JPY 64.21 million in contribution margin (at the Period 8 consolidated 35.79% variable cost ratio: ~JPY 16.0 million outsourced engineering, ~JPY 9.5 million marketing, ~JPY 10.3 million cloud/platform), yielding JPY 42.00 million to JPY 48.00 million in incremental operating profit (~JPY 45.0 million blended) after step-fixed additions of JPY 16.00 million to JPY 22.00 million (2–3 engineers/project managers at JPY 6.0 million–JPY 7.0 million plus JPY 3.0 million–JPY 4.0 million support). Pure Talent Development increments yield JPY 60.00 million–JPY 70.00 million in operating profit versus JPY 30.00 million–JPY 35.00 million for Custom AI Development.
Table: Beyont Ltd. Consolidated Balance Sheet, Cash Flows, Capital Returns, and Working Capital Metrics (JPY in Thousands)
| Balance Sheet, Cash Flow & Return Metric | P4 (FY22/4) Non-Consol. | P5 (FY23/4) Non-Consol. | P6 (FY24/4) Non-Consol. | P7 (FY24/11, 7M) Non-Consol. | P8 (FY25/11) Consol. | P9 Q3 (26/8/31) Consol. | Q3 vs. P8 Delta |
| Cash and Deposits | N/D | N/D | 528,352 (beg. P7) | 736,186 | 897,365 | 1,158,752 | +261,387 (+29.13%) |
| Accounts Receivable (AR) | N/D | N/D | N/D | 79,108 | 165,306 | 112,182 | (53,124) (-32.14%) |
| Inventories (WIP / Merch. / Supplies) | N/D | N/D | N/D | 14,899 (WIP 14,788) | 40,427 (WIP 39,387) | 27,826 (100% WIP) | (12,601) (-31.17%) |
| Current Assets | N/D | N/D | N/D | 855,327 | 1,147,291 | 1,361,308 | +214,017 (+18.65%) |
| Unamortized Goodwill | 0 | 0 | 0 | 0 | 140,419 | 129,240 | (11,179) (-7.96%) |
| Total Assets | 385,828 | 692,428 | 740,632 | 968,397 | 1,411,647 | 1,602,823 | +191,176 (+13.54%) |
| Short-Term / Current Debt (0.76% avg) | N/D | N/D | N/D | 34,254 | 44,945 | 42,004 | (2,941) (-6.54%) |
| Long-Term Debt (0.74% avg, to 2032) | N/D | N/D | N/D | 55,950 | 151,984 | 120,481 | (31,503) (-20.73%) |
| Total Interest-Bearing Debt | N/D | N/D | N/D | 90,204 | 196,929 | 162,485 | (34,444) (-17.49%) |
| Net Debt (Total Debt - Cash) | N/D | N/D | N/D | (645,982) | (700,436) | (996,267) | (295,831) |
| Accounts Payable / Other Current Payables | N/D | N/D | N/D | N/D | 161,240 (AP 104,842 + Accr. 56,398) | 140,128 (Other CL) | (21,112) (-13.09%) |
| Contract Liabilities (Deferred Revenue) | N/D | N/D | N/D | 359,877 | 390,275 | 427,905 | +37,630 (+9.64%) |
| Current Liabilities | N/D | N/D | N/D | 538,677 | 675,617 | 730,559 | +54,942 (+8.13%) |
| Total Liabilities | 224,098 | 301,365 | 424,304 | 594,627 | 878,593 | 902,032 | +23,439 (+2.67%) |
| Net Assets / Equity | 161,730 | 391,063 | 316,328 | 373,770 | 533,054 | 700,790 | +167,736 (+31.47%) |
| Equity Ratio (%) | 41.92% | 56.48% | 42.71% | 38.60% | 37.76% | 43.72% | +596 bps |
| Current Ratio / Quick Ratio (%) | N/D | N/D | N/D | 158.78% / 151.35% | 169.81% / 157.29% | 186.34% / 173.97% | +1,653 bps / +1,668 bps |
| ROE (%) | 34.82% (P3: 19.63%) | 39.66% | (21.13%) | 16.65% (unann.) | 29.88% (Non-con: 34.10%) | N/A (interim) | — |
| ROA (Ordinary) / ROA (Net Income) | 17.57% / 12.43% | 22.68% / 15.83% | (13.52%) / (10.09%) | 9.16% / 5.93% | 16.97% / 11.28% | 18.01% / 10.47% (9M) | — |
| Operating Cash Flow (OCF) | N/D | N/D | N/D | 264,408 | 297,650 | 96,314 (P9 6M Interim) | — |
| Investing Cash Flow (CFI) | N/D | N/D | N/D | (36,516) | (233,197) | (5,889) (P9 6M Interim) | — |
| — Capex (Tangible & Intangible) | N/D | N/D | N/D | (36,516) | (19,097) | (6,272) (P9 Q3; 6M: (5,889)) | — |
| — Subsidiary Acquisition (KICONIA WORKS) | N/D | N/D | N/D | 0 | (214,099) | 0 | — |
| Financing Cash Flow (CFF) | N/D | N/D | N/D | (20,058) | 96,725 | (23,776) (P9 6M Interim) | — |
| Free Cash Flow (OCF - Capex) | N/D | N/D | N/D | 227,892 | 278,553 | 90,425 (P9 6M Interim) | — |
| Cash Conversion (OCF / Net Income) | N/D | N/D | N/D | 4.60x | 1.87x | 0.98x (P9 6M Interim) | — |
DuPont decomposition of Period 8 consolidated ROE (29.88%) confirms profitability restoration as the primary return driver: a 11.24% net profit margin multiplied by 1.004x total asset turnover and a 2.648x equity multiplier. While the 37.76% Period 8 equity ratio (43.72% at Period 9 Q3) suggests optical leverage, JPY 390,275 thousand (44.42%) of Period 8 total liabilities and JPY 427,905 thousand (47.44%) of Period 9 Q3 liabilities represent non-interest-bearing Contract Liabilities from upfront corporate tuition. Cash reserves of JPY 1,158,752 thousand cover short-term debt (JPY 42,004 thousand) by 27.59x and total interest-bearing debt (JPY 162,485 thousand) by 7.13x, alongside JPY 80,000 thousand in undrawn bank credit lines. With Period 8 NOPAT of JPY 155,736 thousand (calculated at the 34.59% statutory effective tax rate) and negative Invested Capital of -JPY 167,382 thousand (Equity JPY 533,054 thousand + Debt JPY 196,929 thousand - Cash JPY 897,365 thousand), Beyont operates a negative-working-capital engine: Period 8 DSO averaged 31.47 days, DIO averaged 35.39 days, and DPO equivalent averaged 70–80 days (zero trade payables, settled via JPY 104,842 thousand Other Accounts Payable and JPY 56,398 thousand Accrued Expenses). Non-operating items remained minimal: Period 7 recorded JPY 1,410 thousand non-operating income (interest JPY 57 thousand, point rebates JPY 229 thousand, other JPY 1,123 thousand) and JPY 914 thousand expenses (interest JPY 530 thousand, other JPY 383 thousand); Period 8 recorded JPY 5,005 thousand income (interest JPY 1,079 thousand, subsidy JPY 1,500 thousand or 0.63% of pre-tax profit, point rebates JPY 1,510 thousand, other JPY 916 thousand) and JPY 3,585 thousand expenses (interest JPY 2,478 thousand, other JPY 1,106 thousand); Period 9 Q3 recorded JPY 3,437 thousand income (interest JPY 2,204 thousand, cancellation fees JPY 577 thousand, point rebates JPY 605 thousand, other JPY 49 thousand) and JPY 4,429 thousand expenses (interest JPY 2,326 thousand, listing-related fees JPY 2,000 thousand, other JPY 102 thousand).
Beyont Tokyo Infrastructure Footprint, Capex Allocation, and Statutory GX Moats
Beyont maintains an asset-light digital service infrastructure anchored entirely across two leased offices in Tokyo, Japan, engaging in zero physical manufacturing, zero raw material procurement, and zero overseas tangible fixed assets. Domestic Japanese sales exceed 90.0% of consolidated revenue (overseas sales below 10.0%), and in strict accordance with United Nations geographical nomenclatures, Beyont holds zero subsidiaries, zero offices, zero personnel, zero supply chain nodes, and zero commercial exposure in Taiwan (China).
As of September 30, 2026, consolidated full-time headcount reached 90 employees (up from 12 in P3, 16 in P4, 28 in P5, 47 in P6, 56 in P7, and 85 in P8), with parent personnel averaging 36.0 years of age, 2.2 years of service tenure, and JPY 5,884,653 in average annual salary under non-unionized, dispute-free labor relations. Annualized Period 9 Q3 productivity rose to JPY 19,698 thousand in revenue per employee (+18.16% vs. JPY 16,670 thousand in P8) and JPY 4,290 thousand in operating profit per employee (+53.16% vs. JPY 2,801 thousand in P8), while total direct labor burden fell from 28.65% of revenue in P8 to 24.12% in P9 Q3 and revenue per Tokyo office stood at JPY 708.48 million in P8.
Digital delivery relies on cloud compute subscriptions via Microsoft Azure and Microsoft 365, alongside a dispersed domestic network of external AI engineers and seminar lecturers. Beyont capitalizes zero standalone registered patents and reports zero R&D line-item expenses; instead, self-use software additions are capitalized under intangible assets (JPY 21,099 thousand added in P8, comprising JPY 10,850 thousand for "SkillUpAI LMS" and JPY 8,546 thousand for "SkillCheck AI"; software-in-progress additions JPY 14,174 thousand, ending WIP JPY 651 thousand; gross software JPY 131,320 thousand, accumulated amortization JPY 62,635 thousand, net software JPY 68,685 thousand amortized 5-year straight-line; tangible buildings depreciated 3–16 years and tools 3–5 years). Operational licenses include an ISO/IEC 27001 certification (October 24, 2024) and a Ministry of Health, Labour and Welfare Fee-Charging Employment Placement License for "SkillUp AIgent." Although exact IPO offering pricing and gross proceeds are deferred to post-bookbuilding filings, management earmarked IPO proceeds across four priorities: (1) AI engineer, data scientist, and enterprise sales recruitment; (2) platform upgrades for SkillUpAI LMS, ExamAI automated grading, and vertical micro-SaaS modules ("Kensuke" and "Seisuke"); (3) brand marketing for GX and DX divisions; and (4) accelerated repayment of the JPY 162,485 thousand bank debt incurred for the JPY 220.00 million KICONIA WORKS acquisition.
Beyont's commercial funnel targets four national policy tailwinds cited in its prospectus: IDC Japan's forecast of a JPY 6,889.7 billion (~JPY 6.89 trillion) domestic AI business market by 2029 (36% CAGR 2024–2029, 2.9x CY2025 levels); the Japan Growth Strategy Council's JPY 3 trillion Vertical/Physical AI forecast by 2030; McKinsey's USD 2.7 trillion global quantum economic value forecast by 2035 (alongside Japan's 10 million users / JPY 50 trillion 2030 target); and over JPY 150 trillion in 10-year public-private GX investment backed by JPY 20 trillion in government GX Economic Transition Bonds and mandatory Sustainability Standards Board of Japan (SSBJ) Scope 1, 2, and 3 disclosures taking effect in FY2027 for Prime-listed firms with market capitalizations of JPY 3 trillion or above (finalized March 2025, codified February 2026). As of August 2026, Beyont had penetrated ~1,100 cumulative corporate clients, with zero single client representing 10% or more of revenue. Key enterprise accounts billing JPY 20 million or more annually rose 45.45% YoY from 11 in FY2024/11 to 16 in FY2025/11 (generating JPY 596.00 million combined, or JPY 37.25 million per account), while AI development cross-sell conversion among top accounts (>= JPY 50 million) climbed 2,290 bps from 30.0% to 52.9% (targeting >60%). Cumulative "GX Test" examinees (priced at JPY 11,000–JPY 16,500 per test) reached 13,424 by FY2025/11 with 9,363 Ministry of the Environment certified Decarbonization Advisors (FY2026/11 targets: 18,000 examinees and 14,000 passers), anchored by Beyont's exclusive status as Japan's sole accredited provider of the "GX Test Specialist" exam for Decarbonization Senior Advisors, its lead role authoring METI GX League's "GX Skill Standards" (May 2024), its Cabinet Office SIP Phase 3 / OIST / Q-STAR co-authorship of "Quantum Literacy Standard (QSS-L) ver. 1.0" (February 2026), and its status as an authorized Microsoft Copilot Specialization partner.
HDIN Institutional Verdict: Negative Net Debt Resilience vs. Governance, Earn-Out, and Subcontracting Risks
Cross-referencing Beyont's operational execution against statutory disclosures confirms that financial liquidity is robust, but four structural risks require forensic monitoring post-listing:
1. KICONIA WORKS PMI, Goodwill Exposure, and Contingent Earn-Out: The April 30, 2025 debt-funded acquisition (JPY 220.00 million cash; JPY 200.00 million bank loan) created JPY 149.12 million in goodwill (amortized over 10 years at JPY 14.91 million/year; JPY 129,240 thousand remaining at Period 9 Q3). Under the share purchase agreement, Beyont faces up to JPY 100.00 million in contingent cash earn-out payments tied to KICONIA WORKS operating profit thresholds between May 1, 2027 and April 30, 2028, which would expand goodwill and draw down liquid reserves.
2. Fiscal Seasonality and Subcontracting Cost Inflation: Corporate Japanese training budgets concentrate in March–May (Q2) while software acceptance testing (検収) and curriculum completion peak in Q3–Q4 (June–November), rendering Q1 (December–February) an earnings trough. Custom AI software contracts incur continuous bi-weekly/monthly developer outflows ahead of final acceptance, pushing WIP inventory from JPY 12.10 million at Period 9 Interim (May 31, 2026) to JPY 27.83 million at Q3 (August 31, 2026). Domestic AI talent scarcity risks subcontracting cost inflation, though internalizing KICONIA WORKS mitigates external contractor dependence.
3. Accounting & Audit Flags (Zero Bad Debt Allowance and Lease Overhaul): Management maintains zero general bad debt allowance against JPY 165,306 thousand (P8) and JPY 112,182 thousand (P9 Q3) in accounts receivable based on zero historical defaults, leaving no P&L buffer against an unexpected corporate default. Additionally, mandatory adoption of Japan's new Lease Accounting Standard (ASBJ Statement No. 34) in FY2028/11 will capitalize office leases (JPY 21.60 million annual HQ rent) onto the balance sheet. One minor pending former-employee lawsuit is assessed as without merit and immaterial by external counsel, and Grant Thornton Taiyo LLC (three-year tenure; partners Shinichiro Kamoda and Keiko Kuwahara; FY2025/11 audit fee JPY 14,400 thousand) issued an unqualified opinion.
4. Founder Voting Dominance and 10.26% Option Overhang: Following an August 25, 2026 1:1 conversion of 2,400 Series A Preferred Shares (originally issued November 30, 2022 at JPY 50,000/share for JPY 120.00 million to TSV1 Investment LP) and an August 27, 2026 1:100 stock split, total issued common shares stand at 3,240,000 shares alongside 370,300 unexercised stock options across Series 1–5 (10.26% of 3,610,300 fully diluted shares, or 11.43% of issued common shares). Founder and CEO Shinichi Tahara controls 65.97% of fully diluted equity and 73.51% of pre-IPO voting rights (54.01% via 100%-owned TS Asset Management Co., Ltd., to which he transferred 1,750,000 shares in November 2025 at JPY 181,615 thousand or JPY 103.78/share, plus 19.50% directly), enabling unilateral passage of special resolutions under Article 309, Paragraph 2 of the Companies Act of Japan. Earlier personal debt guarantees by Tahara on JPY 80,000 thousand in bank debt (balance JPY 50,457 thousand) were fully repaid and released on February 14, 2025, leaving zero ongoing related-party conflicts.
Governance checks balance concentrated founder control: Beyont operates as a Company with Board of Company Auditors featuring 5 Directors (40.0% Independent Outside Directors: Miyuki Zeniya [ex-NRI, J.P. Morgan AM, Polaris PE, Resona, Dai-ichi Life, MUFG Chief Sustainability Officer] and Yuko Tanaka [ex-Toyota, A.T. Kearney, Spacemarket, CrowdWorks], alongside Shinichi Tahara, Tomoya Izasawa, and Nobuya Ogawa) and 3 Outside Auditors (100% independent: full-time CPA Mitsuko Fujino [ex-Deloitte Tohmatsu], Yasunori Asami [ex-Intec], and attorney Setsuko Murakami [ex-Mori Hamada & Matsumoto]). Female representation reaches 50.0% among statutory officers (4 of 8) and 21.1% among managers, with 100% male childcare leave uptake and zero Subcontract Act or Labor Standards Inspection Office violations. In FY2025/11, total officer compensation was JPY 63,300 thousand in fixed base pay across 7 individuals (JPY 55,500 thousand for 5 internal directors; JPY 7,800 thousand for 2 outside officers; JPY 0 bonus or severance), well within July 29, 2026 statutory caps of JPY 500,000 thousand for directors and JPY 25,000 thousand for auditors.
Key Financial Questions From Beyont's Period 9 Q3 and IPO Filing
What drove Beyont Ltd.'s 498 bps operating margin expansion despite gross margin dilution in Period 9 Q3?
Consolidated operating margin rose from 16.80% in Period 8 to 21.78% in Period 9 Q3 because SG&A expenses fell 984 bps from 63.06% to 53.22% of revenue, absorbing fixed platform and corporate overhead across JPY 1,329.60 million in nine-month sales. This operating leverage offset a 487 bps gross margin contraction (from 79.87% to 75.00%) caused by a higher revenue mix of labor-intensive AI Development Services (28.59% of sales, up 31.27% in nine months).
How resilient is Beyont Ltd.'s pre-IPO balance sheet ahead of potential KICONIA WORKS earn-out liabilities?
Beyont entered its IPO filing with JPY 1,158.75 million in cash against JPY 162.49 million in interest-bearing debt (-JPY 996.27 million net debt), covering total debt 7.13x alongside JPY 80.00 million in undrawn bank credit lines. Even if the maximum JPY 100.00 million KICONIA WORKS earn-out is triggered between May 2027 and April 2028, upfront client prepayments (JPY 427.91 million in contract liabilities) and positive operating cash flow (JPY 297.65 million in Period 8) preserve liquidity.
Why did Beyont Ltd. record an ordinary loss in Period 6 before rebounding to 29.88% ROE in Period 8?
Period 6 (FY2024/4) revenue dropped 16.03% to JPY 521.73 million and ordinary losses hit -JPY 100.12 million due to the mandatory cumulative adoption of ASBJ Statement No. 29 revenue recognition rules and corporate client budget timing shifts. Following a fiscal year-end realignment to November 30 and the integration of KICONIA WORKS, consolidated revenue scaled to JPY 1,416.95 million in Period 8, restoring net margins to 11.24% and driving a DuPont ROE of 29.88%.
Presentation Download & Analyst Briefing Access:
- Institutional Presentation: Download the full "Beyont_Enterprise_Blueprint" PDF under the 'Related Topics' section.
- Analyst Video Briefing: Watch the "Beyont Ltd. IPO Audit: Can a 52.9% AI Cross-Sell Rate & ¥1.16B Cash Moat Beat Japan's IT Labor Crunch?" on the HDIN Research YouTube Channel.
About HDIN Research:
HDIN Research is a premier global market intelligence and strategic advisory firm specializing in institutional-grade financial analysis, supply chain audits, and macroeconomic forecasting. Our dedicated sector analysts deliver actionable, data-driven insights tailored for private equity, hedge funds, and corporate strategy teams. Visit us at https://www.hdinresearch.com.
Editorial & Methodology Disclosure:
"This market intelligence brief was researched, modeled, and audited by the HDIN Research Equity Desk based on official primary corporate filings (Beyont Ltd. Tokyo Stock Exchange Growth Market IPO Securities Registration Statement Form I, filed November 10, 2026; FY2025/11 audited financial statements and Period 9 Q3 interim financial statements reviewed by Grant Thornton Taiyo LLC). Proprietary quantitative extraction tools were utilized to ensure 100% fidelity to reported financial line items and footnotes. All forensic interpretations, segmental benchmarks, and institutional verdicts were independently written and verified by HDIN senior sector analysts in accordance with institutional research standards."