Emerson Electric FY2026 Analysis: 52.8% Gross Margin & $7.2B AspenTech Buyout
Date : 2026-11-19
Reading : 382
BEIJING — HDIN Market Intelligence Brief | Audited by HDIN Equity Research Desk | Source Filing: FY2025 & FY2026 Form 10-K (including Fiscal 2026 Outlook)
HDIN Executive Takeaways
1. Margin Inflection: FY2026 net sales rose +3.0% to $18,016M, lifting gross margin +200 bps to 52.8%, operating margin +311 bps to 24.5%, and continuing GAAP EPS +42.9% to $4.03.
2. Capex & Backlog: Deploying $7,244M for the remaining 43% of AspenTech elevated net debt to $11,572M (2.47x Adjusted EBITA), anchored by an $8,629M backlog and 120 global sites.
3. Institutional Verdict: Guided FY2026 FCF of $3,500M–$3,600M covers ~$2,200M in shareholder returns while directing a ~$1,350M surplus toward retiring $4,192M in commercial paper.
Figure Emerson Electric Co FY2025-FY2026 Strategic Transformation & Performance Architecture
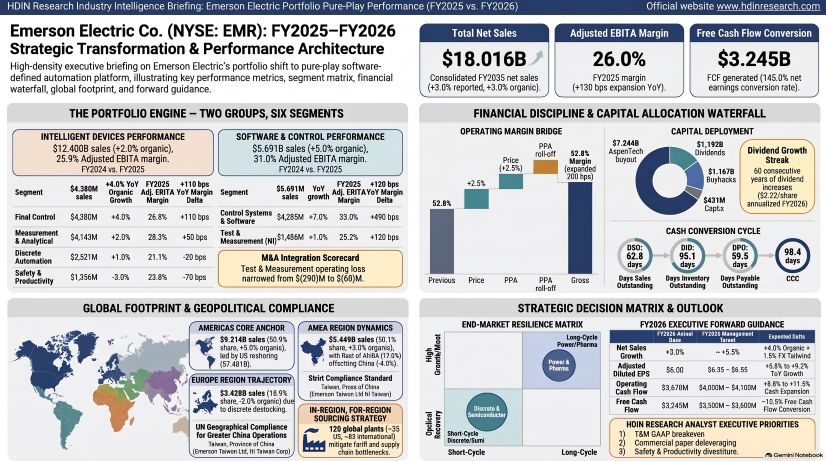 Emerson Electric FY2026 Consolidated Performance, $18.02B Revenue Mechanics, and Segmental Margin Expansion
Emerson Electric Co. [NYSE: EMR] generated consolidated net sales of $18,016 million in FY2026 (fiscal year ended September 30, 2025), up +3.0% year-over-year (+$524 million from $17,492 million in FY2025), while GAAP diluted EPS from continuing operations expanded +42.9% to $4.03 and Adjusted Diluted EPS increased +9.3% to $6.00. Between FY2022 and FY2026, Emerson Electric Co. transitioned from a cyclical industrial conglomerate (~49.0% legacy gross margin) into a pure-play industrial automation and software architecture provider by divesting Climate Technologies/Copeland ($14.0 billion valuation) and InSinkErator ($3.0 billion) while acquiring National Instruments Corporation (NI, October 11, 2023 for $8.2 billion equity value / $8,653 million total consideration net of $135 million cash acquired) and the remaining 43% noncontrolling interest in Aspen Technology, Inc. (AspenTech, March 12, 2025 for ~$7.2 billion / $7,244 million financing cash outflow).
Top-line growth of +3.0% in FY2026 was entirely organic, driven by +2.5% price realization and +0.5% volume, with 0.0% foreign exchange and 0.0% acquisition/divestiture impact (versus +6.0% underlying, +9.0% acquisition, and 0.0% FX in FY2025). Cost of sales declined -1.3% to $8,497 million, expanding gross profit +7.1% to $9,519 million and gross margin +200 bps to 52.8% (+130 bps from the non-recurrence of FY2025 NI inventory step-up amortization of $231 million and +70 bps from positive price-cost spread). Selling, general, and administrative (SG&A) expenses fell -0.8% to $5,103 million (28.3% of sales, down -110 bps from 29.4%), yielding operating profit (Net Sales less COGS and SG&A per Item 7 MD&A) of $4,416 million (+18.0% YoY) and an operating margin of 24.5% (+311 bps YoY). Adjusted EBITA rose +8.5% to $4,693 million (26.0% margin, +130 bps YoY).
Table: Emerson Electric Co. Consolidated Income Statement, Balance Sheet, and FY2026 Guidance Summary (FY2025–FY2026E)
Under ASC 606, Emerson's $18,016 million revenue architecture splits into approximately 90% (~$16.2 billion) recognized at a point in time and approximately 10% (~$1.8 billion) recognized over time. Point-in-time deliveries encompass Intelligent Devices hardware ($12,400 million, or 68.8% of consolidated sales), Test & Measurement modular PXI hardware ($1,486 million), and AspenTech token-based term software licenses recognized upfront on day one of the contractual term. Over-time revenue comprises percentage-of-completion long-term Distributed Control System (DCS) engineering projects and straight-line post-contract customer support (PCS) and software maintenance. Complex contracts containing multiple performance obligations account for approximately 15% of total revenues (~$2.7 billion), predominantly within Software and Control. This accounting structure drove Unbilled Receivables (Contract Assets) up +18.3% YoY to $1,891 million (from $1,599 million in FY2025), while Customer Advances (Contract Liabilities) held steady at $1,105 million ($1,115 million in FY2025), expanding the net contract asset base from $484 million to $786 million.
Following the March 2025 buyout, Emerson consolidated AspenTech into Control Systems & Software, transitioning from seven reporting segments in FY2025 to six recast segments under ASU 2023-07 across two principal business groups. In FY2025 historical standalone disclosures, AspenTech generated $1,093 million in sales and a $(73) million segment loss (reflecting $486 million of intangibles amortization), while standalone Control Systems & Software generated $2,842 million in sales and $645 million in earnings.
Table: Emerson Electric Co. Recast Segmental Financial Performance and Peer Matrix (FY2025 vs. FY2026)
DuPont and Return on Invested Capital (ROIC) decomposition confirm that FY2026 capital efficiency gains stemmed from operational productivity rather than financial engineering. Return on ending common equity expanded +221 bps to 11.31% (average common equity ROE up +164 bps to 10.94%), while ROIC expanded +115 bps to 10.57% as Net Operating Profit After Tax (NOPAT) increased +13.2% to $3,369 million on a virtually flat invested capital base (+0.8% YoY to $31,870 million).
Table: Emerson Electric Co. DuPont ROE Decomposition and ROIC Analysis (FY2025 vs. FY2026)
Customer concentration risk is negligible, with no single customer accounting for 10% or more of consolidated net sales. Standard sales contracts are short-term; cancellation, termination, or refund provisions apply strictly to uncured contract breaches ("rarely invoked"), and product returns are generally limited to quality defects. Emerson's installed-base moat converts greenfield CapEx installations (Fisher severe-service valves, Rosemount transmitters, DeltaV/Ovation DCS over 15-to-30-year plant lifecycles and 20-to-40-year brownfield lifecycles) into non-discretionary OpEx MRO spare parts, cybersecurity patches, and 3-to-5-year token-based AspenTech software renewals. Distribution relies primarily on a direct technical sales force for enterprise software and FEED engineering, supplemented by exclusive regional independent sales representatives (operating local calibration and valve centers, flagged in Item 1A as an alignment risk) and industrial/retail wholesalers for ASCO, Aventics, RIDGID, and Greenlee products.
Global Manufacturing Footprint, $431M Capex Allocation, and Regional Demand Dynamics
Emerson Electric Co. operates approximately 120 manufacturing locations globally—roughly 35 inside the United States and 85 outside—backed by $2,871 million in net Property, Plant, and Equipment (PP&E) at year-end FY2026 ($2,807 million in FY2025) and $431 million in FY2026 CapEx (2.4% of net sales, guided to ~$450 million in FY2026). To insulate operations from tariffs, retaliatory trade policies, and semiconductor export controls, management deploys an "in-region, for-region" localized manufacturing and dual-sourcing strategy across critical raw materials (steel, cast iron, electronic microcontrollers, rare earth metals, aluminum, brass, and specialized alloys including hastelloy, titanium, and monel).
Regional destination performance bifurcated sharply in FY2026. The Americas anchored growth at $9,214 million (+4.7% reported, +5.0% underlying; 50.9% of segment sales), propelled by U.S. federal infrastructure stimulus (Inflation Reduction Act, CHIPS and Science Act), reshoring, AI data center power demand, and utility grid modernization (+10% underlying in U.S. Software and Control). Conversely, Europe contracted -2.0% underlying to $3,428 million (-0.5% reported) due to discrete factory automation and automotive OEM destocking, partially buffered by EU decarbonization and emissions-monitoring demand. Within Asia, Middle East & Africa (AMEA, $5,449 million, +2.5% reported, +3.0% underlying), Rest of AMEA expanded +7.0% underlying to $3,620 million on Middle East energy/desalination projects and Indian industrial automation, offsetting a -4.0% underlying contraction in China (including Hong Kong SAR) to $1,829 million (following -3.0% in FY2025 and -2.0% in FY2023), where Test & Measurement sales dropped -6.0% underlying amid semiconductor export controls and OEM capex deferrals.
In strict compliance with United Nations cartographic standards, Emerson's global operating entities map across regional production and 24-hour engineering hubs: Mainland China (Emerson Electric [China] Holdings Co., Ltd.; Beijing Rosemount Far East Instrument Co., Ltd.; Emerson Process Management [Tianjin] Valves Co., Ltd.; Fisher Jeon Gas Equipment [Chengdu] Co., Ltd.; Emerson Xi'an Engineering Center; ASCO Valve & Branson Ultrasonics [Shanghai]; NI [China] Instruments Co., Ltd.; N H Power Test Equipment [Shenzhen]; AspenTech [Beijing] & [Shanghai]; Flexim Instruments [Zhenjiang]); Hong Kong SAR (Emerson Automation Solutions Final Control Hong Kong Ltd.; Rosemount Ltd.; National Instruments Hong Kong Ltd.; EMR [Asia] Ltd.; Emerson Electric [Asia] Ltd.); Taiwan, Province of China (Emerson [Taiwan] Ltd.; NI Taiwan Corporation); and India (Pune Ovation & software execution center, Chennai, Mumbai).
Emerson sustained total research, development, engineering, and customer-funded development intensity at 8.1% of net sales (~$1.46 billion) in both FY2025 and FY2026, up from 6.9% in FY2023 and 6.3% in FY2022. Under ASC 730, P&L-expensed R&D totaled $771 million in FY2026 ($781 million in FY2025, +48% post-NI acquisition, and $523 million in FY2023). Software application development capitalized under ASC 350-40 and ASC 985-20 reached $1,583 million gross ($1,497 million in FY2025) less $1,337 million accumulated amortization, yielding $246 million in net capitalized software ($239 million in FY2025). This investment anchors Emerson's "Boundless Automation™" computing fabric, integrating intelligent field devices (Rosemount, Fisher) with containerized edge control (DeltaV, PACSystems) and enterprise first-principles AI simulation (Aspen HYSYS, DMC3, Aspen Mtell, OSI).
HDIN Institutional Verdict: Free Cash Flow Coverage, M&A Hurdle Audit, and Governance Reality
Management's narrative of a cash-generative, software-enabled automation compounder aligns with FY2026 operating cash flow conversion, though balance sheet flexibility is temporarily constrained by re-leveraging from the AspenTech buyout and mixed top-line execution at Test & Measurement. Operating cash flow from continuing operations grew +10.8% YoY (+$359 million) to $3,676 million, while continuing free cash flow expanded +12.0% (+$347 million) to $3,245 million (18.0% of net sales, +140 bps YoY). Reported total GAAP operating cash flow fell -7.0% to $3,098 million (from $3,332 million) solely due to $(578) million in discontinued operations cash flow triggered by a non-recurring ~$0.6 billion cash tax payment on the August 2024 Copeland equity sale. Working capital efficiency remained disciplined, with Cash Conversion Cycle (CCC) edging up +1.4 days to 98.4 days (DSO 62.8 days, DIO 95.1 days on $2,213 million inventory [$520M finished, $1,693M raw/WIP], DPO 59.5 days).
Of $10,034 million in FY2026 capital deployment, $7,244 million (72.2%) funded the AspenTech buyout, $1,192 million (11.9%, $2.11/share) funded dividends (extending a 69-year annual increase streak), $1,167 million (11.6%) funded repurchases of 9.3 million shares at $125.66 average (net 7.4 million shares retired after 1.9 million reissued, vs. 4.4 million at $99.04 for $435 million in FY2025), and $431 million (4.3%) funded CapEx. Total FY2026 shareholder returns of $2,359 million represented 72.7% of FCF (2.72x dividend coverage, 1.38x total return coverage), leaving an $886 million discretionary surplus. Entering FY2026, management raised the annualized dividend +5.2% to $2.22/share (~$1,200 million) and guided ~$1,000 million in buybacks (backed by a new November 2025 50 million share authorization plus 19.6 million prior shares remaining, totaling 69.6 million authorized). Against $3,550 million midpoint FCF, guided ~$2,200 million returns (62.0% payout, 2.96x dividend coverage) leave a $1,300 million–$1,400 million discretionary surplus to retire $4,192 million in commercial paper (4.3% weighted-average rate) and $605 million in FY2026 debt maturities (including $587 million of 1.25% Euro notes due October 2025), preserving investment-grade ratings after Net Debt/Adjusted EBITA expanded from 0.95x to 2.47x.
Forensic M&A auditing reveals an instructive divergence at Test & Measurement (NI). Under ASC 805 purchase price allocation ($8,653 million net of $135 million cash: $7,833 million cash for shares, $634 million debt payoff, $137 million pre-existing shares [$56 million FY2023 mark-to-market gain], $49 million replacement awards), Emerson allocated $3,442 million to goodwill ($121 million tax-deductible), $5,275 million to identifiable intangibles ($3,360 million customer relationships [15-year life], $1,570 million developed technology [9-year], $210 million trade names [9-year], $135 million order backlog [1-year, fully amortized in FY2025]), $231 million to inventory step-up, $328 million to PP&E, and $(1,204) million to deferred taxes/liabilities. On cost synergies, execution exceeded internal targets: global headcount reductions (2,250 positions in FY2025; 2,100 in FY2026) and facility exits (22 in FY2025; 13 in FY2026) drove T&M Adjusted EBITA margin to 25.2% ($375 million, +120 bps YoY) and narrowed GAAP operating losses by $222 million (from $(290) million to $(68) million). However, T&M sales of $1,464 million (FY2025) and $1,486 million (FY2026) remain -12.6% (~$214 million) below NI's pre-deal ~$1,700 million ($1,693 million pro forma) baseline due to semiconductor and European/Chinese test deferrals. Meanwhile, the AspenTech buyout was accounted for under ASC 810 as an equity transaction—eliminating $5,832 million of noncontrolling interest, charging $1,400 million excess purchase price to APIC ($1,321 million reclassified to Retained Earnings), paying $76 million for options, assuming 503,000 RSUs, and absorbing $127 million in AspenTech deal fees plus $76 million in Emerson corporate advisory fees, with zero incremental goodwill. Annual Q4 impairment testing yielded $0.00 in goodwill or intangible impairments across FY2023–FY2026, though $18,193 million in goodwill (43% of assets, including $3,468 million at T&M) warrants ongoing monitoring alongside the strategic sale review of Safety & Productivity ($421 million goodwill).
Governance and incentive alignment remain anchored by independent Chair James S. Turley, CEO Lal Karsanbhai, and COO Ram Krishnan across a 10-director Board (9 independent following two departures). Long-term Performance Shares run on 3-year cycles weighted 60% Adjusted EPS (80%–120% threshold/max) and 40% Free Cash Flow (90%–110% threshold/max), modified ±20 percentage points by relative TSR against the S&P 500 Capital Goods Index (0%–200% cap; realized payouts of 118% [1,733,000 shares] for FY21–FY23, 118% [1,084,000 shares] for FY22–FY25, and 115% [~919,000 shares] for FY23–FY26), backed by a Dodd-Frank clawback policy, two-year worldwide non-compete covenants, and a 24/7 CISO program with ISO 27001-certified cloud/data centers and zero material cyber incidents. Notably, Emerson's FY2026 Form 10-K Item 1A redline elevated Artificial Intelligence to a standalone risk factor while intensifying disclosures around OT/embedded product cybersecurity and OECD Pillar Two global minimum taxes.
Key Financial Questions From the FY2026 Filing
What drove Emerson Electric's margin expansion and GAAP EPS rebound in FY2026?
Gross margin expanded +200 bps to 52.8% and operating margin expanded +311 bps to 24.5% due to +2.5% price realization over net material inflation, a +130 bps benefit from the roll-off of FY2025's $231 million NI inventory step-up amortization, and -110 bps of SG&A leverage (28.3% of sales). Continuing GAAP diluted EPS surged +42.9% YoY from $2.82 to $4.03 as non-recurring FY2025 purchase accounting charges ($231 million inventory step-up and $136 million backlog amortization) and the $279 million Copeland note loss did not repeat, alongside +193% EBITA growth in Software and Control.
How is Emerson Electric allocating capital and managing its $13.12 billion debt load following the AspenTech buyout?
Emerson funded the $7,244 million AspenTech minority buyout through $2,044 million in cash drawdowns, commercial paper ($4,192 million outstanding at a 4.3% weighted-average rate), and three March 2025 senior note issuances (€500M 3.00% due 2031, $500M 5.00% due 2035, and €500M 3.50% due 2037), lifting Net Debt to $11,572 million (2.47x Adjusted EBITA). In FY2026, management guides for $3,500M–$3,600M in free cash flow to cover ~$1,200 million in dividends ($2.22/share annualized) and ~$1,000 million in share repurchases, leaving ~$1,350 million in discretionary cash surplus to retire commercial paper and $605 million in current maturities.
What is the revenue visibility and geographic risk profile entering FY2026?
Emerson enters FY2026 with a record $8,629 million backlog (+2.1% YoY), of which ~75% (~$6,472 million) converts to revenue within 12 months (~36% coverage of guided FY2026 net sales), reinforced by 3-to-5-year AspenTech software agreements and non-discretionary brownfield MRO demand. While management guides for +5.5% consolidated FY2026 sales growth (+4.0% underlying and +1.5% FX tailwind) anchored by Americas power and process demand (+5.0% underlying in FY2026), execution remains exposed to European discrete factory automation weakness (-2.0% underlying in FY2026) and Chinese OEM capital deferrals and semiconductor export controls (-4.0% total China underlying, -6.0% in Test & Measurement).
Presentation Download & Analyst Briefing Access:
- Institutional Presentation: Download the full "Emerson_Automation_Transformation_Strategy" PDF under the 'Related Topics' section.
- Analyst Video Briefing: Watch the "Emerson Electric (EMR) 2026 Forensic 10-K Analysis: Can 52.8% Gross Margins & AspenTech Pay Off a $13.1B Debt Tab?" on the HDIN Research YouTube Channel.
About HDIN Research:
HDIN Research is a premier global market intelligence and strategic advisory firm specializing in institutional-grade financial analysis, supply chain audits, and macroeconomic forecasting. Our dedicated sector analysts deliver actionable, data-driven insights tailored for private equity, hedge funds, and corporate strategy teams. Visit us at https://www.hdinresearch.com.
Editorial & Methodology Disclosure:
"This market intelligence brief was researched, modeled, and audited by the HDIN Research Equity Desk based on official primary corporate filings (Emerson Electric Co. FY2025 and FY2026 Form 10-K filings, including Item 7 Fiscal 2026 Outlook). Proprietary quantitative extraction tools were utilized to ensure 100% fidelity to reported financial line items and footnotes. All forensic interpretations, segmental benchmarks, and institutional verdicts were independently written and verified by HDIN senior sector analysts in accordance with institutional research standards."
HDIN Executive Takeaways
1. Margin Inflection: FY2026 net sales rose +3.0% to $18,016M, lifting gross margin +200 bps to 52.8%, operating margin +311 bps to 24.5%, and continuing GAAP EPS +42.9% to $4.03.
2. Capex & Backlog: Deploying $7,244M for the remaining 43% of AspenTech elevated net debt to $11,572M (2.47x Adjusted EBITA), anchored by an $8,629M backlog and 120 global sites.
3. Institutional Verdict: Guided FY2026 FCF of $3,500M–$3,600M covers ~$2,200M in shareholder returns while directing a ~$1,350M surplus toward retiring $4,192M in commercial paper.
Figure Emerson Electric Co FY2025-FY2026 Strategic Transformation & Performance Architecture
Emerson Electric FY2026 Consolidated Performance, $18.02B Revenue Mechanics, and Segmental Margin ExpansionEmerson Electric Co. [NYSE: EMR] generated consolidated net sales of $18,016 million in FY2026 (fiscal year ended September 30, 2025), up +3.0% year-over-year (+$524 million from $17,492 million in FY2025), while GAAP diluted EPS from continuing operations expanded +42.9% to $4.03 and Adjusted Diluted EPS increased +9.3% to $6.00. Between FY2022 and FY2026, Emerson Electric Co. transitioned from a cyclical industrial conglomerate (~49.0% legacy gross margin) into a pure-play industrial automation and software architecture provider by divesting Climate Technologies/Copeland ($14.0 billion valuation) and InSinkErator ($3.0 billion) while acquiring National Instruments Corporation (NI, October 11, 2023 for $8.2 billion equity value / $8,653 million total consideration net of $135 million cash acquired) and the remaining 43% noncontrolling interest in Aspen Technology, Inc. (AspenTech, March 12, 2025 for ~$7.2 billion / $7,244 million financing cash outflow).
Top-line growth of +3.0% in FY2026 was entirely organic, driven by +2.5% price realization and +0.5% volume, with 0.0% foreign exchange and 0.0% acquisition/divestiture impact (versus +6.0% underlying, +9.0% acquisition, and 0.0% FX in FY2025). Cost of sales declined -1.3% to $8,497 million, expanding gross profit +7.1% to $9,519 million and gross margin +200 bps to 52.8% (+130 bps from the non-recurrence of FY2025 NI inventory step-up amortization of $231 million and +70 bps from positive price-cost spread). Selling, general, and administrative (SG&A) expenses fell -0.8% to $5,103 million (28.3% of sales, down -110 bps from 29.4%), yielding operating profit (Net Sales less COGS and SG&A per Item 7 MD&A) of $4,416 million (+18.0% YoY) and an operating margin of 24.5% (+311 bps YoY). Adjusted EBITA rose +8.5% to $4,693 million (26.0% margin, +130 bps YoY).
Table: Emerson Electric Co. Consolidated Income Statement, Balance Sheet, and FY2026 Guidance Summary (FY2025–FY2026E)
| Financial Metric (USD Millions, except per share & ratios) | FY2024 (10-K) | FY2025 (10-K) | YoY Variance (Δ / %) | FY2026 Guidance Target | Notes & Filing Reconciliation |
| Net Sales / Revenue | $17,492 | $18,016 | +$524 (+3.0%) | ~ +5.5% (~$19,000M implied) | Organic +3.0% (FY25) vs. ~+4.0% (FY26E); FX +1.5% (FY26E) |
| Cost of Sales (COGS) | $8,607 | $8,497 | -$110 (-1.3%) | — | FY24 included $231M NI inventory step-up amortization |
| Gross Profit | $8,885 | $9,519 | +$634 (+7.1%) | — | +130 bps PPA roll-off; +70 bps price-cost spread |
| Gross Margin (%) | 50.8% | 52.8% | +200 bps | — | Up from ~49.0% legacy conglomerate baseline |
| SG&A Expenses | $5,142 | $5,103 | -$39 (-0.8%) | — | Operating leverage & NI/AspenTech cost reductions |
| SG&A as % of Net Sales | 29.4% | 28.3% | -110 bps | — | Synergies across corporate and T&M overhead |
| Operating Profit (Sales - COGS - SG&A) | $3,743 | $4,416 | +$673 (+18.0%) | — | Derived per Item 7 MD&A definition |
| Operating Margin (%) | 21.4% | 24.5% | +311 bps | — | +18.0% profit growth on +3.0% revenue growth |
| Other Deductions, Net | $1,434 | $1,245 | -$189 (-13.2%) | — | Amort. $884M (-17.9%), Restruct. $136M (-40.4%), Acq. $214M (+122.9%) |
| Loss on Copeland Note Receivable | $279 | $0 | -$279 (-100.0%) | $0 | August 2024 settlement of $2.25B face / $2.179B carrying note for $1.9B |
| Gain on Subordinated Interest (Vertiv) | $(79) | $0 | +$79 (-100.0%) | $0 | Final Vertiv distribution realized in FY24 |
| Net Interest Expense | $175 | $237 | +$62 (+35.4%) | — | Higher debt from AspenTech buyout; LT interest paid $221M vs. $193M |
| Interest Income from Related Party | $(86) | $0 | +$86 (-100.0%) | $0 | Copeland 5% PIK note settled in August 2024 |
| Earnings from Continuing Ops Before Tax | $2,020 | $2,934 | +$914 (+45.2%) | — | Pretax margin expanded +480 bps from 11.5% to 16.3% |
| Income Taxes | $415 | $696 | +$281 (+67.7%) | — | Effective Tax Rate 20.5% (FY24) to 23.7% (FY25, +320 bps) |
| Adjusted EBITA (Non-GAAP) | $4,326 | $4,693 | +$367 (+8.5%) | — | Adjusted EBITA Margin: 24.7% (FY24) to 26.0% (FY25, +130 bps) |
| GAAP Net Earnings (incl. Noncontrolling) | $1,955 | $2,246 | +$291 (+14.9%) | — | Cont. Ops incl. NCI: $1,605M (FY24) to $2,238M (FY25) |
| Earnings from Continuing Ops (Common) | $1,618 | $2,285 | +$667 (+41.2%) | — | Core continuing common earnings base |
| Earnings from Discontinued Ops (Common) | $350 | $8 | -$342 (-97.7%) | $0 | FY24 included $539M pretax / $435M after-tax Copeland equity gain |
| Net Earnings Attributable to Common | $1,968 | $2,293 | +$325 (+16.5%) | — | Consolidated common bottom line |
| Diluted EPS – Continuing Ops (GAAP) | $2.82 | $4.03 | +$1.21 (+42.9%) | $4.73 – $4.93 | Guided +17.4% to +22.3% on lower deal & restructuring fees |
| Diluted EPS – Net Earnings (GAAP) | $3.43 | $4.04 | +$0.61 (+17.8%) | — | Diluted share count: 574.0M (FY24) to 566.7M (FY25, -1.3%) |
| Adjusted Diluted EPS – Continuing Ops | $5.49 | $6.00 | +$0.51 (+9.3%) | $6.35 – $6.55 | Guided +5.8% to +9.2%; Intangibles $1.42, Restruct. $0.15, Acq. $0.05/sh |
| Cash and Cash Equivalents | $3,588 | $1,544 | -$2,044 (-57.0%) | — | Cash deployed toward AspenTech buyout |
| Total Assets | $44,246 | $41,964 | -$2,282 (-5.2%) | — | Goodwill represents $18,193M (43% of total assets) |
| Short-Term Borrowings & Current Debt | $532 | $4,797 | +$4,265 (+801.7%) | — | Commercial paper $4,192M (4.3% avg rate) + $605M current maturities |
| Long-Term Debt | $7,155 | $8,319 | +$1,164 (+16.3%) | — | Includes March 2025 EUR/USD senior notes issuances |
| Total Debt / Net Debt | $7,687 / $4,099 | $13,116 / $11,572 | +
7,473 (+182.3%) |
— | Net Debt / Adj. EBITA: 0.95x (FY24) to 2.47x (FY25, +1.52x) |
| Common Equity / Total Equity (incl. NCI) | $21,636 / $27,509 | $20,282 / $20,298 | -
7,211 (-26.2%) |
— | NCI ($5,832M) eliminated via AspenTech equity transaction |
| Leverage & Coverage Ratios | 26.2% Debt/Cap | 39.3% Debt/Cap | +13.1 pts | — | Net Debt/Net Cap: 15.9% to 36.2%; OCF/Debt: 43.2% to 28.0%; Int. Cov: 7.2x to 8.6x |
Under ASC 606, Emerson's $18,016 million revenue architecture splits into approximately 90% (~$16.2 billion) recognized at a point in time and approximately 10% (~$1.8 billion) recognized over time. Point-in-time deliveries encompass Intelligent Devices hardware ($12,400 million, or 68.8% of consolidated sales), Test & Measurement modular PXI hardware ($1,486 million), and AspenTech token-based term software licenses recognized upfront on day one of the contractual term. Over-time revenue comprises percentage-of-completion long-term Distributed Control System (DCS) engineering projects and straight-line post-contract customer support (PCS) and software maintenance. Complex contracts containing multiple performance obligations account for approximately 15% of total revenues (~$2.7 billion), predominantly within Software and Control. This accounting structure drove Unbilled Receivables (Contract Assets) up +18.3% YoY to $1,891 million (from $1,599 million in FY2025), while Customer Advances (Contract Liabilities) held steady at $1,105 million ($1,115 million in FY2025), expanding the net contract asset base from $484 million to $786 million.
Following the March 2025 buyout, Emerson consolidated AspenTech into Control Systems & Software, transitioning from seven reporting segments in FY2025 to six recast segments under ASU 2023-07 across two principal business groups. In FY2025 historical standalone disclosures, AspenTech generated $1,093 million in sales and a $(73) million segment loss (reflecting $486 million of intangibles amortization), while standalone Control Systems & Software generated $2,842 million in sales and $645 million in earnings.
Table: Emerson Electric Co. Recast Segmental Financial Performance and Peer Matrix (FY2025 vs. FY2026)
| Business Group / Segment (USD Millions) | FY24 Sales | FY25 Sales | Rep. / Org. Growth | FY24 EBITA (Margin) | FY25 EBITA (Margin) | EBITA Var. (bps) | FY25 Adj. EBITA (Margin / Var.) | Amort. & Restruct. (FY24 -> FY25) | Core Brands & Industry Peer Set |
| Final Control | $4,204 | $4,380 | +4.2% / +4.0% | $977 (23.2%) | $1,081 (24.7%) | +150 bps | $1,176 (26.8% / +110 bps) | $(104) -> $(95) (-8.7%) | Fisher, Vanessa, Crosby, Bettis; Peers: ABB, Flowserve, Baker Hughes |
| Measurement & Analytical | $4,061 | $4,143 | +2.0% / +2.0% | $1,056 (26.0%) | $1,112 (26.8%) | +84 bps | $1,182 (28.5% / +50 bps) | $(81) -> $(70) (-13.6%) | Rosemount, Micro Motion, Flexim; Peers: Endress+Hauser, Yokogawa |
| Discrete Automation | $2,506 | $2,521 | +0.6% / +1.0% | $466 (18.6%) | $469 (18.6%) | +0 bps | $531 (21.1% / -20 bps) | $(69) -> $(62) (-10.1%) | ASCO, Aventics, Branson, Afag; Peers: Rockwell, Siemens, Keyence, SMC |
| Safety & Productivity | $1,390 | $1,356 | -2.4% / -3.0% | $308 (22.2%) | $291 (21.5%) | -70 bps | $323 (23.8% / -70 bps) | $(33) -> $(32) (-3.0%) | RIDGID, Greenlee, Klauke, ProTeam (Under strategic sale review) |
| Total Intelligent Devices | $12,161 | $12,400 | +2.0% / +2.0% | $2,807 (23.1%) | $2,953 (23.8%) | +70 bps | $3,212 (25.9% / +50 bps) | $(287) -> $(259) | +2.0% price, flat volume; positive price over material inflation |
| Control Systems & Software (incl. AspenTech) | $3,935 | $4,205 | +6.9% / +7.0% | $572 (14.5%) | $895 (21.3%) | +680 bps | $1,388 (33.0% / +490 bps) | $(535) -> $(493) (-7.9%) | DeltaV, Ovation, AMS, AspenTech, OSI; Peers: Honeywell HPS, AVEVA, Siemens |
| Test & Measurement (formerly NI) | $1,464 | $1,486 | +1.5% / +1.0% | $(290) (-19.8%) | $(68) (-4.6%) | +1,520 bps | $375 (25.2% / +120 bps) | $(641) -> $(443) (-30.9%) | NI, LabVIEW, TestStand, PXI; Peers: Keysight, Fortive, Teradyne, Advantest |
| Total Software and Control | $5,399 | $5,691 | +5.4% / +5.0% | $282 (5.2%) | $827 (14.5%) | +930 bps | $1,763 (31.0% / +400 bps) | $(1,176) -> $(936) | +2.5% price, +2.5% volume; 31.6% of total sales |
| Total Business Segments | $17,560 | $18,091 | +3.0% / +3.0% | $3,089 (17.6%) | $3,780 (20.9%) | +330 bps | — | — | Corporate & Eliminations: Sales
(75)M; EBITA
(846)M |
| Total Continuing Operations (GAAP) | $17,492 | $18,016 | +3.0% / +3.0% | $2,020 (11.5%) | $2,934 (16.3%) | +480 bps | — | — | Pre-tax continuing income basis |
DuPont and Return on Invested Capital (ROIC) decomposition confirm that FY2026 capital efficiency gains stemmed from operational productivity rather than financial engineering. Return on ending common equity expanded +221 bps to 11.31% (average common equity ROE up +164 bps to 10.94%), while ROIC expanded +115 bps to 10.57% as Net Operating Profit After Tax (NOPAT) increased +13.2% to $3,369 million on a virtually flat invested capital base (+0.8% YoY to $31,870 million).
Table: Emerson Electric Co. DuPont ROE Decomposition and ROIC Analysis (FY2025 vs. FY2026)
| Capital Efficiency Component | FY2024 | FY2025 | YoY Variance (Δ) | Operational & Accounting Driver |
| Net Profit Margin (Cont. Ops Common / Sales) | 9.25% | 12.68% | +343 bps | Gross margin expansion (+200 bps) and SG&A leverage (-110 bps) |
| Asset Turnover (Sales / Ending Assets) | 0.395x | 0.429x | +0.034x | Sales +3.0% while total assets fell -5.2% via cash deployment |
| Financial Leverage (Ending Assets / Common Equity) | 2.045x | 2.069x | +0.024x | Neutral; asset (-2.28B) and equity (−2.28B) and equity (−1.35B) reductions moved in tandem |
| Return on Common Equity (ROE – Ending) | 9.10% | 11.31% | +221 bps | Average common equity ROE rose +164 bps (9.30% to 10.94%) |
| Invested Capital (Total Debt + Total Equity - Cash) | $31,608M | $31,870M | +$262M (+0.8%) | New debt (+5.43B) replace deliminated NCI(5.43B) replace deliminated NCI(5.83B) and deployed cash |
| NOPAT (Operating Profit × [1 - Effective Tax Rate]) | $2,976M | $3,369M | +$393M (+13.2%) | Operating profit $4,416M taxed at 23.7% (vs. $3,743M at 20.5%) |
| Return on Invested Capital (ROIC) | 9.42% | 10.57% | +115 bps | Pure operational price-cost spread and synergy capture |
Customer concentration risk is negligible, with no single customer accounting for 10% or more of consolidated net sales. Standard sales contracts are short-term; cancellation, termination, or refund provisions apply strictly to uncured contract breaches ("rarely invoked"), and product returns are generally limited to quality defects. Emerson's installed-base moat converts greenfield CapEx installations (Fisher severe-service valves, Rosemount transmitters, DeltaV/Ovation DCS over 15-to-30-year plant lifecycles and 20-to-40-year brownfield lifecycles) into non-discretionary OpEx MRO spare parts, cybersecurity patches, and 3-to-5-year token-based AspenTech software renewals. Distribution relies primarily on a direct technical sales force for enterprise software and FEED engineering, supplemented by exclusive regional independent sales representatives (operating local calibration and valve centers, flagged in Item 1A as an alignment risk) and industrial/retail wholesalers for ASCO, Aventics, RIDGID, and Greenlee products.
Global Manufacturing Footprint, $431M Capex Allocation, and Regional Demand Dynamics
Emerson Electric Co. operates approximately 120 manufacturing locations globally—roughly 35 inside the United States and 85 outside—backed by $2,871 million in net Property, Plant, and Equipment (PP&E) at year-end FY2026 ($2,807 million in FY2025) and $431 million in FY2026 CapEx (2.4% of net sales, guided to ~$450 million in FY2026). To insulate operations from tariffs, retaliatory trade policies, and semiconductor export controls, management deploys an "in-region, for-region" localized manufacturing and dual-sourcing strategy across critical raw materials (steel, cast iron, electronic microcontrollers, rare earth metals, aluminum, brass, and specialized alloys including hastelloy, titanium, and monel).
Regional destination performance bifurcated sharply in FY2026. The Americas anchored growth at $9,214 million (+4.7% reported, +5.0% underlying; 50.9% of segment sales), propelled by U.S. federal infrastructure stimulus (Inflation Reduction Act, CHIPS and Science Act), reshoring, AI data center power demand, and utility grid modernization (+10% underlying in U.S. Software and Control). Conversely, Europe contracted -2.0% underlying to $3,428 million (-0.5% reported) due to discrete factory automation and automotive OEM destocking, partially buffered by EU decarbonization and emissions-monitoring demand. Within Asia, Middle East & Africa (AMEA, $5,449 million, +2.5% reported, +3.0% underlying), Rest of AMEA expanded +7.0% underlying to $3,620 million on Middle East energy/desalination projects and Indian industrial automation, offsetting a -4.0% underlying contraction in China (including Hong Kong SAR) to $1,829 million (following -3.0% in FY2025 and -2.0% in FY2023), where Test & Measurement sales dropped -6.0% underlying amid semiconductor export controls and OEM capex deferrals.
In strict compliance with United Nations cartographic standards, Emerson's global operating entities map across regional production and 24-hour engineering hubs: Mainland China (Emerson Electric [China] Holdings Co., Ltd.; Beijing Rosemount Far East Instrument Co., Ltd.; Emerson Process Management [Tianjin] Valves Co., Ltd.; Fisher Jeon Gas Equipment [Chengdu] Co., Ltd.; Emerson Xi'an Engineering Center; ASCO Valve & Branson Ultrasonics [Shanghai]; NI [China] Instruments Co., Ltd.; N H Power Test Equipment [Shenzhen]; AspenTech [Beijing] & [Shanghai]; Flexim Instruments [Zhenjiang]); Hong Kong SAR (Emerson Automation Solutions Final Control Hong Kong Ltd.; Rosemount Ltd.; National Instruments Hong Kong Ltd.; EMR [Asia] Ltd.; Emerson Electric [Asia] Ltd.); Taiwan, Province of China (Emerson [Taiwan] Ltd.; NI Taiwan Corporation); and India (Pune Ovation & software execution center, Chennai, Mumbai).
Emerson sustained total research, development, engineering, and customer-funded development intensity at 8.1% of net sales (~$1.46 billion) in both FY2025 and FY2026, up from 6.9% in FY2023 and 6.3% in FY2022. Under ASC 730, P&L-expensed R&D totaled $771 million in FY2026 ($781 million in FY2025, +48% post-NI acquisition, and $523 million in FY2023). Software application development capitalized under ASC 350-40 and ASC 985-20 reached $1,583 million gross ($1,497 million in FY2025) less $1,337 million accumulated amortization, yielding $246 million in net capitalized software ($239 million in FY2025). This investment anchors Emerson's "Boundless Automation™" computing fabric, integrating intelligent field devices (Rosemount, Fisher) with containerized edge control (DeltaV, PACSystems) and enterprise first-principles AI simulation (Aspen HYSYS, DMC3, Aspen Mtell, OSI).
HDIN Institutional Verdict: Free Cash Flow Coverage, M&A Hurdle Audit, and Governance Reality
Management's narrative of a cash-generative, software-enabled automation compounder aligns with FY2026 operating cash flow conversion, though balance sheet flexibility is temporarily constrained by re-leveraging from the AspenTech buyout and mixed top-line execution at Test & Measurement. Operating cash flow from continuing operations grew +10.8% YoY (+$359 million) to $3,676 million, while continuing free cash flow expanded +12.0% (+$347 million) to $3,245 million (18.0% of net sales, +140 bps YoY). Reported total GAAP operating cash flow fell -7.0% to $3,098 million (from $3,332 million) solely due to $(578) million in discontinued operations cash flow triggered by a non-recurring ~$0.6 billion cash tax payment on the August 2024 Copeland equity sale. Working capital efficiency remained disciplined, with Cash Conversion Cycle (CCC) edging up +1.4 days to 98.4 days (DSO 62.8 days, DIO 95.1 days on $2,213 million inventory [$520M finished, $1,693M raw/WIP], DPO 59.5 days).
Of $10,034 million in FY2026 capital deployment, $7,244 million (72.2%) funded the AspenTech buyout, $1,192 million (11.9%, $2.11/share) funded dividends (extending a 69-year annual increase streak), $1,167 million (11.6%) funded repurchases of 9.3 million shares at $125.66 average (net 7.4 million shares retired after 1.9 million reissued, vs. 4.4 million at $99.04 for $435 million in FY2025), and $431 million (4.3%) funded CapEx. Total FY2026 shareholder returns of $2,359 million represented 72.7% of FCF (2.72x dividend coverage, 1.38x total return coverage), leaving an $886 million discretionary surplus. Entering FY2026, management raised the annualized dividend +5.2% to $2.22/share (~$1,200 million) and guided ~$1,000 million in buybacks (backed by a new November 2025 50 million share authorization plus 19.6 million prior shares remaining, totaling 69.6 million authorized). Against $3,550 million midpoint FCF, guided ~$2,200 million returns (62.0% payout, 2.96x dividend coverage) leave a $1,300 million–$1,400 million discretionary surplus to retire $4,192 million in commercial paper (4.3% weighted-average rate) and $605 million in FY2026 debt maturities (including $587 million of 1.25% Euro notes due October 2025), preserving investment-grade ratings after Net Debt/Adjusted EBITA expanded from 0.95x to 2.47x.
Forensic M&A auditing reveals an instructive divergence at Test & Measurement (NI). Under ASC 805 purchase price allocation ($8,653 million net of $135 million cash: $7,833 million cash for shares, $634 million debt payoff, $137 million pre-existing shares [$56 million FY2023 mark-to-market gain], $49 million replacement awards), Emerson allocated $3,442 million to goodwill ($121 million tax-deductible), $5,275 million to identifiable intangibles ($3,360 million customer relationships [15-year life], $1,570 million developed technology [9-year], $210 million trade names [9-year], $135 million order backlog [1-year, fully amortized in FY2025]), $231 million to inventory step-up, $328 million to PP&E, and $(1,204) million to deferred taxes/liabilities. On cost synergies, execution exceeded internal targets: global headcount reductions (2,250 positions in FY2025; 2,100 in FY2026) and facility exits (22 in FY2025; 13 in FY2026) drove T&M Adjusted EBITA margin to 25.2% ($375 million, +120 bps YoY) and narrowed GAAP operating losses by $222 million (from $(290) million to $(68) million). However, T&M sales of $1,464 million (FY2025) and $1,486 million (FY2026) remain -12.6% (~$214 million) below NI's pre-deal ~$1,700 million ($1,693 million pro forma) baseline due to semiconductor and European/Chinese test deferrals. Meanwhile, the AspenTech buyout was accounted for under ASC 810 as an equity transaction—eliminating $5,832 million of noncontrolling interest, charging $1,400 million excess purchase price to APIC ($1,321 million reclassified to Retained Earnings), paying $76 million for options, assuming 503,000 RSUs, and absorbing $127 million in AspenTech deal fees plus $76 million in Emerson corporate advisory fees, with zero incremental goodwill. Annual Q4 impairment testing yielded $0.00 in goodwill or intangible impairments across FY2023–FY2026, though $18,193 million in goodwill (43% of assets, including $3,468 million at T&M) warrants ongoing monitoring alongside the strategic sale review of Safety & Productivity ($421 million goodwill).
Governance and incentive alignment remain anchored by independent Chair James S. Turley, CEO Lal Karsanbhai, and COO Ram Krishnan across a 10-director Board (9 independent following two departures). Long-term Performance Shares run on 3-year cycles weighted 60% Adjusted EPS (80%–120% threshold/max) and 40% Free Cash Flow (90%–110% threshold/max), modified ±20 percentage points by relative TSR against the S&P 500 Capital Goods Index (0%–200% cap; realized payouts of 118% [1,733,000 shares] for FY21–FY23, 118% [1,084,000 shares] for FY22–FY25, and 115% [~919,000 shares] for FY23–FY26), backed by a Dodd-Frank clawback policy, two-year worldwide non-compete covenants, and a 24/7 CISO program with ISO 27001-certified cloud/data centers and zero material cyber incidents. Notably, Emerson's FY2026 Form 10-K Item 1A redline elevated Artificial Intelligence to a standalone risk factor while intensifying disclosures around OT/embedded product cybersecurity and OECD Pillar Two global minimum taxes.
Key Financial Questions From the FY2026 Filing
What drove Emerson Electric's margin expansion and GAAP EPS rebound in FY2026?
Gross margin expanded +200 bps to 52.8% and operating margin expanded +311 bps to 24.5% due to +2.5% price realization over net material inflation, a +130 bps benefit from the roll-off of FY2025's $231 million NI inventory step-up amortization, and -110 bps of SG&A leverage (28.3% of sales). Continuing GAAP diluted EPS surged +42.9% YoY from $2.82 to $4.03 as non-recurring FY2025 purchase accounting charges ($231 million inventory step-up and $136 million backlog amortization) and the $279 million Copeland note loss did not repeat, alongside +193% EBITA growth in Software and Control.
How is Emerson Electric allocating capital and managing its $13.12 billion debt load following the AspenTech buyout?
Emerson funded the $7,244 million AspenTech minority buyout through $2,044 million in cash drawdowns, commercial paper ($4,192 million outstanding at a 4.3% weighted-average rate), and three March 2025 senior note issuances (€500M 3.00% due 2031, $500M 5.00% due 2035, and €500M 3.50% due 2037), lifting Net Debt to $11,572 million (2.47x Adjusted EBITA). In FY2026, management guides for $3,500M–$3,600M in free cash flow to cover ~$1,200 million in dividends ($2.22/share annualized) and ~$1,000 million in share repurchases, leaving ~$1,350 million in discretionary cash surplus to retire commercial paper and $605 million in current maturities.
What is the revenue visibility and geographic risk profile entering FY2026?
Emerson enters FY2026 with a record $8,629 million backlog (+2.1% YoY), of which ~75% (~$6,472 million) converts to revenue within 12 months (~36% coverage of guided FY2026 net sales), reinforced by 3-to-5-year AspenTech software agreements and non-discretionary brownfield MRO demand. While management guides for +5.5% consolidated FY2026 sales growth (+4.0% underlying and +1.5% FX tailwind) anchored by Americas power and process demand (+5.0% underlying in FY2026), execution remains exposed to European discrete factory automation weakness (-2.0% underlying in FY2026) and Chinese OEM capital deferrals and semiconductor export controls (-4.0% total China underlying, -6.0% in Test & Measurement).
Presentation Download & Analyst Briefing Access:
- Institutional Presentation: Download the full "Emerson_Automation_Transformation_Strategy" PDF under the 'Related Topics' section.
- Analyst Video Briefing: Watch the "Emerson Electric (EMR) 2026 Forensic 10-K Analysis: Can 52.8% Gross Margins & AspenTech Pay Off a $13.1B Debt Tab?" on the HDIN Research YouTube Channel.
About HDIN Research:
HDIN Research is a premier global market intelligence and strategic advisory firm specializing in institutional-grade financial analysis, supply chain audits, and macroeconomic forecasting. Our dedicated sector analysts deliver actionable, data-driven insights tailored for private equity, hedge funds, and corporate strategy teams. Visit us at https://www.hdinresearch.com.
Editorial & Methodology Disclosure:
"This market intelligence brief was researched, modeled, and audited by the HDIN Research Equity Desk based on official primary corporate filings (Emerson Electric Co. FY2025 and FY2026 Form 10-K filings, including Item 7 Fiscal 2026 Outlook). Proprietary quantitative extraction tools were utilized to ensure 100% fidelity to reported financial line items and footnotes. All forensic interpretations, segmental benchmarks, and institutional verdicts were independently written and verified by HDIN senior sector analysts in accordance with institutional research standards."