TE Connectivity FY26 Analysis: 20.1% Margin & AI Pivot | HDIN Research
Date : 2026-11-19
Reading : 389
BEIJING — HDIN Market Intelligence Brief | Audited by HDIN Equity Research Desk | Source Filing: FY2025 & FY2026 Form 10-K Filings (TE Connectivity plc)
HDIN Executive Takeaways
1. Margin & Backlog Inflection: FY26 revenue grew 15.2% to $19,885 million as GAAP operating margin reached 20.1% (+150 bps) and Industrial backlog jumped 44.9% to $5,664 million.
2. Capex & Footprint Pivot: Industrial Solutions absorbed 61.9% of FY26 CapEx ($694 million) and China PP&E hit $1,070 million ahead of the $1.4 billion Astrodyne TDI deal.
3. Forensic QoE Verdict: Treating recurring restructuring ($491 million three-year cash spend) as operating maintenance places economic margin near 19.6%, though $3,403 million FCF covers $1,553 million in contingent claims.
Figure TE Connectivity plc (FY2025-FY2026) Navigating Industrial Cyclicality through Al infrastructure, Electrification & Operational Excellence
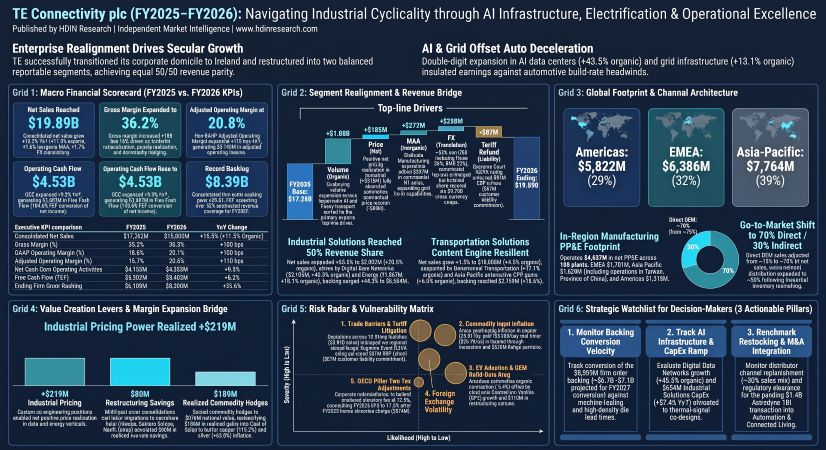
TE Connectivity FY26 Segmental Performance and 270 bps Industrial Margin Expansion
TE Connectivity plc [NYSE: TEL] delivered $19,885 million in consolidated net sales in FY2026 (ended September 25, 2026), representing a 15.2% (+$2,623 million) increase over FY2025 ($17,262 million) and expanding GAAP operating income by 24.3% to $3,991 million (20.1% margin, +150 bps YoY). Following the FY2025 structural reorganization that consolidated the former Communications Solutions unit into Industrial Solutions and established a two-segment reporting model, Industrial Solutions achieved 50/50 top-line parity with Transportation Solutions ($9,903 million vs. $10,069 million prior to an $87 million reconciling tariff adjustment) and surpassed Transportation in operating profitability ($2,018 million at a 20.4% margin vs. $1,969 million at a 19.6% margin).
Table: TE Connectivity Consolidated Financial, Cash Flow, and Working Capital Scorecard (FY2025 vs. FY2026)
Revenue bridge decomposition indicates that 78.6% of FY2026 top-line expansion derived from organic growth (+$2,062 million, +11.9%), comprising +$1,877 million (+10.9%) in physical volume and product mix alongside +$185 million (+1.1%) in net pricing realization. Foreign currency translation added +$289 million (+1.7% net; +2.2% gross), while inorganic M&A contributed +$272 million (+1.6%), anchored by +$227 million in incremental first-half sales from Richards Manufacturing Co. (acquired April 1, 2025 for $2,307 million net cash). A -$87 million reconciling net sales adjustment reflected customer refund commitments tied to the February 2026 U.S. Supreme Court invalidation of International Emergency Economic Powers Act (IEEPA) tariffs.
Table: TE Connectivity Reportable Segment and End-Market Revenue Decomposition (FY2025 vs. FY2026)
Pricing power diverged sharply across segments. In Transportation Solutions, annual contractual OEM price-downs created -$34 million in net price erosion, which TE Connectivity offset via +$457 million (+4.9%) in volume/mix driven by Content per Vehicle (CPV) expansion in high-voltage battery interconnects and Asia–Pacific (+5.0% organic) and EMEA (+4.3% organic) electrification, offsetting a -5.4% Americas contraction. Following a minor FY2026 internal shift of $54 million (FY2025 recast) and $49 million (FY2024 recast) from Commercial Transportation to Automotive, Commercial Transportation accelerated 17.1% organically on fleet emissions and hybrid upgrades, while Sensors contracted 2.4% organically following an 8.0% drop in FY2025. Conversely, Industrial Solutions captured +$219 million (+2.8%) in net pricing realization alongside +$1,420 million (+18.0%) in volume/mix. Digital Data Networks expanded 43.5% organically (following +72.6% in FY2025) on high-density copper, optical transceiver, and thermal-signal architectures for artificial intelligence (AI) compute clusters, while Energy grew 18.1% organically (+40.4% reported) on utility substation hardening and AI data center grid ties. Automation and Connected Living rebounded 13.1% organically from distributor destocking troughs, Aerospace, Defense & Marine rose 11.0% organically, and Medical stabilized (-1.3% organic due to a planned non-core product exit after -17.1% destocking in FY2025).
Working capital discipline compressed the Cash Conversion Cycle (CCC) by 9.0 days to 85.1 days (releasing ~$315 million in liquidity), as DSO improved 1.5 days to 70.5 days ($3,839 million receivables), DIO shortened 2.8 days to 85.3 days ($2,962 million inventory), and DPO extended 4.7 days to 70.7 days ($2,455 million payables, supported by $139 million in supply chain finance confirmed invoices). GAAP net income surged 76.6% to $3,253 million as the effective tax rate normalized to 17.6% ($695 million tax expense) from 42.5% ($1,361 million) in FY2025, which had been distorted by a $574 million non-cash Swiss deferred tax valuation allowance triggered by OECD Pillar Two 15% minimum tax rules and $44 million in U.S. carryforward allowances.
Manufacturing Footprint, Commodity Hedging, and Regional Supply Chain Architecture
TE Connectivity operates a closed-loop, "in-region, for-region" manufacturing network across 105 principal facilities (17 million sq. ft. owned; 12 million sq. ft. leased) in more than 25 countries: 41 sites in the Americas, 38 in EMEA, and 26 in Asia–Pacific. Total headcount rose from ~93,000 in FY2025 to ~104,000 at FY2026 year-end, including ~65,000 direct manufacturing personnel (up from ~55,000). Following portfolio realignment, management recalibrated its served addressable market from ~$200 billion (FY2025 Form 10-K) to ~$135 billion (FY2026 Form 10-K), maintaining zero single-customer revenue concentration across FY2024–FY2026. Commercial go-to-market mix shifted by 500 bps as indirect third-party catalog and technical distribution across ~130 countries grew from ~25% to ~30% of net sales on industrial channel restocking, while direct OEM co-engineering ("Early Design-In") accounted for ~70% (down from ~75%). To defend sole-source 5-to-7-year platform lifecycles against rivals including Amphenol, Molex, Aptiv, Yazaki, Sumitomo, Hubbell, Sensata, Honeywell, JST, Integer Holdings, and Korea Electric Terminal, TE Connectivity deployed $942 million in RD&E (4.7% of sales; $803 million pure R&D), scaling Industrial Solutions RD&E by 24.4% YoY to $469 million (+55.8% from $301 million in FY2024) while holding Transportation RD&E at $473 million.
Table: TE Connectivity Net Property, Plant, and Equipment (PP&E) and Regional Revenue Footprint (FY2024–FY2026)
Gross margin expanded 180 bps over 24 months (from 34.4% / $5,456 million in FY2024 to 36.2% in FY2026) despite acute metal inflation in FY2026: copper climbed 13.2% to $4.81/lb (194 million lbs purchased; 200 million lbs FY2027E), gold rose 38.7% to $3,550/troy oz (106,000 oz; 105,000 oz FY2027E), silver surged 62.0% to $46.99/troy oz (1.8 million oz; 1.9 million oz FY2027E), and palladium increased 19.7% to $1,275/troy oz (14,000 oz; 20,000 oz FY2027E). TE Connectivity countered over $500 million in unhedged metal headwinds by scaling commodity cash-flow derivative hedges from $569 million to $876 million notional value, generating $165 million in unrealized Other Comprehensive Income (OCI) gains and reclassifying $189 million in realized derivative gains directly into Cost of Sales (vs. $54 million in FY2025 and $19 million in FY2024).
On currency and trade exposure, non-USD invoicing fell from 60% to 55% of sales (USD 45%, Euro 26%, RMB 20%, JPY 3%, Other 6%). While top-line commercial revenue remains unhedged, TE Connectivity protects balance-sheet equity via $4,416 million in foreign debt net investment hedges and $5,759 million in cross-currency swaps maturing through FY2031 (receiving 1.8%–2.0% USD interest; a 10% FX shift alters fair value by $594 million). Following the Supreme Court's IEEPA ruling, TE received $91 million in U.S. Customs and Border Protection (CBP) refunds (credited to Cost of Sales) against an $87 million customer refund liability (debited to Net Sales), leaving a +$4 million net operating variance. In parallel, TE paid $14 million to CBP in FY2026 to resolve a prior disclosure on Section 301 country-of-origin duties. Operationally, TE achieved >70% Scope 1 and 2 greenhouse gas (GHG) reductions ahead of its 2030 target (vs. 2020 baseline) on 80%+ renewable electricity and >25% energy intensity reduction, while pursuing an SBTi-validated 30% Scope 3 cut by FY2032 (vs. 2022), a 3% enterprise water reduction by FY2029 (after hitting -15% at 30 high-stress sites in FY2025), and 98% Zero Waste to Landfill diversion by FY2029 (~95% in FY2026). Chemical regulations (EU REACH, RoHS, WEEE, ELV, TSCA/EPA) and Conflict Minerals (3TG) audits govern fluoropolymer and precious metal sourcing.
HDIN Institutional Verdict: Capital Allocation Discipline vs. Forensic QoE Realities
Management enters FY2027 with record firm backlog of $8,388 million (+35.6% YoY; 42.2% or 5.1 months of annual sales), projecting 80%–85% conversion ($6.7 billion–$7.1 billion) in FY2027. Q1 FY2027 guidance targets ~$5.35 billion in net sales (+14.6% YoY vs. $4.67 billion, including ~$17 million FX and excluding Astrodyne TDI) and $3.04 diluted EPS, while full-year FY2027 targets double-digit reported sales growth, ~11.9% organic expansion, and ~6% CapEx intensity. Over FY2025–FY2026, following its September 30, 2024 redomiciliation from Switzerland to Ireland ($31 million total costs; $45 billion FY2026 distributable reserves; 8 million treasury shares cancelled directly by the Board), TE Connectivity deployed $11,580 million across organic reinvestment ($3,829 million; 33.1%), M&A ($2,840 million; 24.5%), and shareholder returns ($4,911 million; 42.4%, retiring 17 million shares or ~5.5% of float and raising quarterly dividends to $0.78/share for Q1 FY2027, with $2.5 billion buyback authorization remaining). GAAP ROIC expanded 760 bps from 11.4% to 19.0% (and +270 bps from 16.3% to 19.0% on an 18% normalized tax rate) on $17,270 million average invested capital.
The $2,307 million Richards Manufacturing acquisition ($2,348 million gross less $41 million cash) booked $1,042 million in goodwill (~$600 million tax-deductible through 2040, >$125 million tax shield), $1,120 million in intangibles ($1,000 million 20-year customer relationships at $50 million annual amortization; $90 million 16-year technology; $30 million 10-year trademarks), $169 million working capital, and $60 million PP&E. While Richards reported $5 million in 6-month FY2025 GAAP operating income on $179 million sales, stripping out $28 million in acquisition/integration fees and $7 million in inventory step-up reveals $40 million in normalized operating profit (22.3% margin), prior to adding +$227 million in incremental H1 FY2026 sales. Consolidated goodwill reached $7,420 million (78.2% / $5,806 million in Industrial; $1,614 million in Transportation; $4,249 million historical impairment), with zero FY2025–FY2026 impairment supported by ~$60 billion–$62 billion equity capitalization (~4.5x market-to-book vs. $13,573 million equity). Net debt fell $497 million YoY to $3,942 million ($5,639 million total debt less $1,697 million cash), or ~0.8x EBITDA against a 3.75x credit covenant ceiling, even as interest expense climbed 61.0% to $124 million (4.875%–5.00% senior note issuances).
Forensic cross-examination reveals three operational constraints behind management's bullish guidance. First, Non-GAAP Adjusted Operating Margin (20.8%) excludes $152 million in restructuring and acquisition add-backs ($522 million over three years). Because continuous line migration from Germany to Mexico, Eastern Europe, North Africa, and China is structurally required to absorb 1%–2% annual automotive price erosion, management's own FY2027 guidance of ~$80 million in charges and ~$100 million in cash outflows confirms restructuring is a permanent operating cost—placing true economic operating margin near ~19.6%. Second, the $203 million improvement in the pension deficit ($609 million to $406 million) stemmed predominantly from discount rates rising to 4.99% (non-U.S.) and 6.41% (U.S.), masking modest $80 million asset returns; any 100 bps central bank rate cut would re-expand obligations by over $200 million. Combined with $701 million in UTPs (plus $9,251 million DTA valuation allowances and $37.7 billion in permanently reinvested foreign earnings containing ~$3.5 billion in cash/intercompany deposits) and $1,626 million in firm purchase obligations (+55.4% YoY), cash demands remain elevated. Third, backlog orders carry unilateral pre-shipment cancellation clauses under ASC 606 short-duration practical expedients, exposing TE Connectivity to rapid hyperscaler AI architecture shifts (e.g., co-packaged optics vs. copper) and regulatory timing risks on the $1.4 billion Astrodyne TDI closing.
Key Financial Questions From the FY2026 Filing
What drove TE Connectivity's revenue and operating margin expansion in FY2026?
Consolidated net sales grew 15.2% YoY to $19,885 million on 11.9% organic growth (+$1,877 million volume/mix and +$185 million net pricing), +$289 million in FX translation, and +$272 million in M&A, partially offset by an -$87 million IEEPA tariff customer refund. GAAP operating margin rose 150 bps to 20.1% ($3,991 million) as Industrial Solutions expanded 270 bps to 20.4% on +43.5% organic Digital Data Networks growth and +$219 million in net pricing, while $189 million in realized commodity hedge gains and $80 million in FY2025 restructuring savings expanded gross margin by 100 bps to 36.2%.
How is TE Connectivity allocating capital and expanding its regional infrastructure?
Management deployed $5,037 million in FY2026 ($11,580 million over FY2025–FY2026), shifting 61.9% of FY2026 CapEx ($694 million, +57.4% YoY) to Industrial Solutions while committing $1.4 billion to acquire Astrodyne TDI and returning $2,761 million via dividends ($869 million) and buybacks ($1,892 million). Regionally, consolidated net PP&E rose to $4,637 million across 105 facilities, led by China ($1,070 million, +26.8% over two years) and Other Asia–Pacific ($556 million, +67.5%, including branch operations in Taiwan, Province of China), alongside nearshoring expansion in Mexico ($158 million Other Americas) and Eastern Europe/North Africa as German PP&E contracted 9.7% to $529 million.
What are the primary forensic earnings quality and balance sheet risks in the FY2026 10-K?
Treating recurring restructuring ($110 million FY2026 pure charges; $491 million three-year cash outflow; ~$100 million FY2027E spend) as ongoing operating maintenance reduces baseline operating margin by 100–120 bps from 20.8% Non-GAAP to ~19.6%. Additionally, TE carries $1,553 million in aggregate identified liquidity claims—anchored by $701 million in uncertain tax positions (~$130 million resolving within 12 months) and a $406 million rate-sensitive pension deficit—though FY2026 Free Cash Flow of $3,403 million and 0.8x net leverage provide 2.19x coverage.
Presentation Download & Analyst Briefing Access:
- Institutional Presentation: Download the full "TE_Connectivity_Strategic_Transformation" PDF under the 'Related Topics' section.
- Analyst Video Briefing: Watch the "TE Connectivity 10-K Analysis: Can $3.18B AI Data Center & Grid Growth Offset Auto Cycles in 2026?" on the HDIN Research YouTube Channel.
About HDIN Research:
HDIN Research is a premier global market intelligence and strategic advisory firm specializing in institutional-grade financial analysis, supply chain audits, and macroeconomic forecasting. Our dedicated sector analysts deliver actionable, data-driven insights tailored for private equity, hedge funds, and corporate strategy teams. Visit us at https://www.hdinresearch.com.
Editorial & Methodology Disclosure:
"This market intelligence brief was researched, modeled, and audited by the HDIN Research Equity Desk based on official primary corporate filings (TE Connectivity plc FY2025 and FY2026 Form 10-K Filings). Proprietary quantitative extraction tools were utilized to ensure 100% fidelity to reported financial line items and footnotes. All forensic interpretations, segmental benchmarks, and institutional verdicts were independently written and verified by HDIN senior sector analysts in accordance with institutional research standards."
HDIN Executive Takeaways
1. Margin & Backlog Inflection: FY26 revenue grew 15.2% to $19,885 million as GAAP operating margin reached 20.1% (+150 bps) and Industrial backlog jumped 44.9% to $5,664 million.
2. Capex & Footprint Pivot: Industrial Solutions absorbed 61.9% of FY26 CapEx ($694 million) and China PP&E hit $1,070 million ahead of the $1.4 billion Astrodyne TDI deal.
3. Forensic QoE Verdict: Treating recurring restructuring ($491 million three-year cash spend) as operating maintenance places economic margin near 19.6%, though $3,403 million FCF covers $1,553 million in contingent claims.
Figure TE Connectivity plc (FY2025-FY2026) Navigating Industrial Cyclicality through Al infrastructure, Electrification & Operational Excellence
TE Connectivity FY26 Segmental Performance and 270 bps Industrial Margin Expansion
TE Connectivity plc [NYSE: TEL] delivered $19,885 million in consolidated net sales in FY2026 (ended September 25, 2026), representing a 15.2% (+$2,623 million) increase over FY2025 ($17,262 million) and expanding GAAP operating income by 24.3% to $3,991 million (20.1% margin, +150 bps YoY). Following the FY2025 structural reorganization that consolidated the former Communications Solutions unit into Industrial Solutions and established a two-segment reporting model, Industrial Solutions achieved 50/50 top-line parity with Transportation Solutions ($9,903 million vs. $10,069 million prior to an $87 million reconciling tariff adjustment) and surpassed Transportation in operating profitability ($2,018 million at a 20.4% margin vs. $1,969 million at a 19.6% margin).
Table: TE Connectivity Consolidated Financial, Cash Flow, and Working Capital Scorecard (FY2025 vs. FY2026)
| Financial Metric ($ in millions, except days/%) | FY2025 (Ended Sept 26, 2025) | FY2026 (Ended Sept 25, 2026) | YoY Change ($ / bps) | YoY Change (%) |
| Consolidated Net Sales | $17,262 | $19,885 | +$2,623 | +15.2% |
| Cost of Sales | $11,183 | $12,679 | +$1,496 | +13.4% |
| Gross Margin ($) | $6,079 | $7,206 | +$1,127 | +18.5% |
| Gross Margin (%) | 35.2% | 36.2% | +100 bps | — |
| Selling, General & Administrative (SG&A) | $1,866 | $2,124 | +$258 | +13.8% |
| SG&A as % of Net Sales | 10.8% | 10.7% | -10 bps | — |
| Research, Development & Engineering (RD&E) | $829 | $942 | +$113 | +13.6% |
| RD&E as % of Net Sales (Pure R&D Note 2) | 4.8% ($699) | 4.7% ($803) | -10 bps (+$104) | +14.9% (Pure R&D) |
| Restructuring and Other Charges, Net | $126 | $117 | -$9 | -7.1% |
| Acquisition and Integration Costs | $47 | $32 | -$15 | -31.9% |
| GAAP Operating Income | $3,211 | $3,991 | +$780 | +24.3% |
| GAAP Operating Margin (%) | 18.6% | 20.1% | +150 bps | — |
| Adjusted Operating Income (Excl. Acq/Restr) | $3,394 | $4,143 | +$749 | +22.1% |
| Adjusted Operating Margin (%) | 19.7% | 20.8% | +110 bps | — |
| Adjusted Operating Income (Incl. Intang. Amort.) | $3,584 | $4,370 | +$786 | +21.9% |
| Pre-Tax Income (Continuing Operations) | $3,204 | $3,950 | +$746 | +23.3% |
| Income Tax Expense / Effective Tax Rate | $1,361 / 42.5% | $695 / 17.6% | -$666 / -2,490 bps | -48.9% |
| GAAP Net Income | $1,842 | $3,253 | +$1,411 | +76.6% |
| Operating Cash Flow (OCF) | $4,139 | $4,525 | +$386 | +9.3% |
| Capital Expenditures (CapEx) (% of Sales) | $936 (5.4%) | $1,122 (5.6%) | +$186 (+20 bps) | +19.9% |
| Free Cash Flow (FCF = OCF - CapEx) | $3,203 | $3,403 | +$200 | +6.2% |
| FCF Conversion (% Net Income / % GAAP OI) | 173.9% / 99.8% | 104.6% / 85.3% | -6,930 bps / -1,450 bps | — |
| Days Sales Outstanding (DSO, Ending) | 72.0 days | 70.5 days | -1.5 days | -2.1% |
| Days Inventory Outstanding (DIO, Ending) | 88.1 days | 85.3 days | -2.8 days | -3.2% |
| Days Payables Outstanding (DPO, Ending) | 66.0 days | 70.7 days | +4.7 days | +7.1% |
| Cash Conversion Cycle (CCC = DIO + DSO - DPO) | 94.1 days | 85.1 days | -9.0 days | -9.6% |
| Firm Ending Order Backlog (Revenue Coverage) | $6,188 (35.8%) | $8,388 (42.2%) | +$2,200 (+640 bps) | +35.6% |
Revenue bridge decomposition indicates that 78.6% of FY2026 top-line expansion derived from organic growth (+$2,062 million, +11.9%), comprising +$1,877 million (+10.9%) in physical volume and product mix alongside +$185 million (+1.1%) in net pricing realization. Foreign currency translation added +$289 million (+1.7% net; +2.2% gross), while inorganic M&A contributed +$272 million (+1.6%), anchored by +$227 million in incremental first-half sales from Richards Manufacturing Co. (acquired April 1, 2025 for $2,307 million net cash). A -$87 million reconciling net sales adjustment reflected customer refund commitments tied to the February 2026 U.S. Supreme Court invalidation of International Emergency Economic Powers Act (IEEPA) tariffs.
Table: TE Connectivity Reportable Segment and End-Market Revenue Decomposition (FY2025 vs. FY2026)
| Segment / Sub-Vertical ($ in millions) | FY2025 (Recast) | FY2026 | Reported YoY (%) | Organic YoY (%) | FX / M&A Impact | Segment Share / Ending Backlog |
| Transportation Solutions Total | $9,388 | $10,069 | +7.3% | +4.5% (+$423M) | +$258M FX / $0 M&A | 50% Mix / $2,724M Backlog (+19.6%) |
| — Automotive | $7,106 | $7,523 | +5.9% | +3.0% (+$212M) | +$205M FX | 75% Segment (38% Total Sales) |
| — Commercial Transportation | $1,371 | $1,635 | +19.3% | +17.1% (+$233M) | +$31M FX | 16% Segment |
| — Sensors | $911 | $911 | 0.0% | -2.4% (-$22M) | +$22M FX | 9% Segment |
| Transportation Operating Income (Margin) | $1,818 (19.4%) | $1,969 (19.6%) | +8.3% | +20 bps Margin | CapEx: $428M (-13.5%) | 27.1% Coverage (3.2 mo.) |
| Industrial Solutions Total | $7,874 | $9,903 | +25.8% | +20.8% (+$1,639M) | +
272M M&A |
50% Mix / $5,664M Backlog (+44.9%) |
| — Digital Data Networks (DDN) | $2,208 | $3,183 | +44.2% | +43.5% (+$961M) | +$14M FX | 32% Segment (16% Total Sales) |
| — Automation & Connected Living | $2,147 | $2,480 | +15.5% | +13.1% (+$281M) | +
1M M&A |
25% Segment |
| — Energy | $1,344 | $1,887 | +40.4% | +18.1% (+$243M) | +
271M M&A |
19% Segment |
| — Aerospace, Defense & Marine | $1,483 | $1,670 | +12.6% | +11.0% (+$163M) | +$24M FX | 17% Segment |
| — Medical | $692 | $683 | -1.3% | -1.3% (-$9M) | $0 | 7% Segment |
| Industrial Operating Income (Margin) | $1,393 (17.7%) | $2,018 (20.4%) | +44.9% | +270 bps Margin | CapEx: $694M (+57.4%) | 57.2% Coverage (6.9 mo.) |
| Reconciling Tariff Adjustment | $0 | $(87) | N/A | — | -$87M Refund Accrual | — |
Pricing power diverged sharply across segments. In Transportation Solutions, annual contractual OEM price-downs created -$34 million in net price erosion, which TE Connectivity offset via +$457 million (+4.9%) in volume/mix driven by Content per Vehicle (CPV) expansion in high-voltage battery interconnects and Asia–Pacific (+5.0% organic) and EMEA (+4.3% organic) electrification, offsetting a -5.4% Americas contraction. Following a minor FY2026 internal shift of $54 million (FY2025 recast) and $49 million (FY2024 recast) from Commercial Transportation to Automotive, Commercial Transportation accelerated 17.1% organically on fleet emissions and hybrid upgrades, while Sensors contracted 2.4% organically following an 8.0% drop in FY2025. Conversely, Industrial Solutions captured +$219 million (+2.8%) in net pricing realization alongside +$1,420 million (+18.0%) in volume/mix. Digital Data Networks expanded 43.5% organically (following +72.6% in FY2025) on high-density copper, optical transceiver, and thermal-signal architectures for artificial intelligence (AI) compute clusters, while Energy grew 18.1% organically (+40.4% reported) on utility substation hardening and AI data center grid ties. Automation and Connected Living rebounded 13.1% organically from distributor destocking troughs, Aerospace, Defense & Marine rose 11.0% organically, and Medical stabilized (-1.3% organic due to a planned non-core product exit after -17.1% destocking in FY2025).
Working capital discipline compressed the Cash Conversion Cycle (CCC) by 9.0 days to 85.1 days (releasing ~$315 million in liquidity), as DSO improved 1.5 days to 70.5 days ($3,839 million receivables), DIO shortened 2.8 days to 85.3 days ($2,962 million inventory), and DPO extended 4.7 days to 70.7 days ($2,455 million payables, supported by $139 million in supply chain finance confirmed invoices). GAAP net income surged 76.6% to $3,253 million as the effective tax rate normalized to 17.6% ($695 million tax expense) from 42.5% ($1,361 million) in FY2025, which had been distorted by a $574 million non-cash Swiss deferred tax valuation allowance triggered by OECD Pillar Two 15% minimum tax rules and $44 million in U.S. carryforward allowances.
Manufacturing Footprint, Commodity Hedging, and Regional Supply Chain Architecture
TE Connectivity operates a closed-loop, "in-region, for-region" manufacturing network across 105 principal facilities (17 million sq. ft. owned; 12 million sq. ft. leased) in more than 25 countries: 41 sites in the Americas, 38 in EMEA, and 26 in Asia–Pacific. Total headcount rose from ~93,000 in FY2025 to ~104,000 at FY2026 year-end, including ~65,000 direct manufacturing personnel (up from ~55,000). Following portfolio realignment, management recalibrated its served addressable market from ~$200 billion (FY2025 Form 10-K) to ~$135 billion (FY2026 Form 10-K), maintaining zero single-customer revenue concentration across FY2024–FY2026. Commercial go-to-market mix shifted by 500 bps as indirect third-party catalog and technical distribution across ~130 countries grew from ~25% to ~30% of net sales on industrial channel restocking, while direct OEM co-engineering ("Early Design-In") accounted for ~70% (down from ~75%). To defend sole-source 5-to-7-year platform lifecycles against rivals including Amphenol, Molex, Aptiv, Yazaki, Sumitomo, Hubbell, Sensata, Honeywell, JST, Integer Holdings, and Korea Electric Terminal, TE Connectivity deployed $942 million in RD&E (4.7% of sales; $803 million pure R&D), scaling Industrial Solutions RD&E by 24.4% YoY to $469 million (+55.8% from $301 million in FY2024) while holding Transportation RD&E at $473 million.
Table: TE Connectivity Net Property, Plant, and Equipment (PP&E) and Regional Revenue Footprint (FY2024–FY2026)
| Geographic Region & Primary Hubs ($ in millions) | FY2024 PP&E | FY2025 PP&E | FY2026 PP&E | 2-Yr PP&E Change | FY2026 Net Sales (% Share / Organic YoY) | Operational Mandate & Key Facilities |
| Asia–Pacific Total | $1,176 | $1,343 | $1,626 | +38.3% (+$450M) | $7,764 (39% / +16.6% org) | Fastest-growing asset base (35.1% of PP&E) |
| — China | $844 | $970 | $1,070 | +26.8% (+$226M) | $5,692 (+23.5% rep; 25% total) | 19 principal plants; 23 subsidiaries (Suzhou, Guangdong) |
| — Other Asia–Pacific (incl. Taiwan, Province of China) | $332 | $373 | $556 | +67.5% (+$224M) | $2,072 | Branch ops in Taiwan, Province of China; TH, VN, PH, JP, IN |
| EMEA Total | $1,653 | $1,741 | $1,701 | +2.9% (+$48M) | $6,386 (32% / +7.5% org) | 36.7% of global PP&E; Western exit to Eastern/North Africa |
| — Germany | $586 | $592 | $529 | -9.7% (-$57M) | — | Automotive precision tooling; labor rationalization |
| — Switzerland | $7 | $15 | $21 | +200.0% (+$14M) | $4,238 | Specialized medical & Schaffner tech |
| — Other EMEA | $1,060 | $1,134 | $1,151 | +8.6% (+$91M) | — | Low-cost hubs: CZ, PL, HU, RO, SK, Morocco, Tunisia |
| Americas Total | $1,074 | $1,228 | $1,310 | +22.0% (+$236M) | $5,822 (29% / +11.0% org) | 28.2% of global PP&E; Grid & Mexico nearshoring |
| — United States | $953 | $1,085 | $1,152 | +20.9% (+$199M) | $5,272 | Aerospace, defense, AI interconnects, Richards Mfg ($60M) |
| — Other Americas | $121 | $143 | $158 | +30.6% (+$37M) | $550 | 9 Mexican manufacturing entities (AMP Amermex, Corcom, etc.) |
| Consolidated Total PP&E / Segment Sales | $3,903 | $4,312 | $4,637 | +18.8% (+$734M) |
87M tariff) |
105 principal manufacturing plants (>25 countries) |
Gross margin expanded 180 bps over 24 months (from 34.4% / $5,456 million in FY2024 to 36.2% in FY2026) despite acute metal inflation in FY2026: copper climbed 13.2% to $4.81/lb (194 million lbs purchased; 200 million lbs FY2027E), gold rose 38.7% to $3,550/troy oz (106,000 oz; 105,000 oz FY2027E), silver surged 62.0% to $46.99/troy oz (1.8 million oz; 1.9 million oz FY2027E), and palladium increased 19.7% to $1,275/troy oz (14,000 oz; 20,000 oz FY2027E). TE Connectivity countered over $500 million in unhedged metal headwinds by scaling commodity cash-flow derivative hedges from $569 million to $876 million notional value, generating $165 million in unrealized Other Comprehensive Income (OCI) gains and reclassifying $189 million in realized derivative gains directly into Cost of Sales (vs. $54 million in FY2025 and $19 million in FY2024).
On currency and trade exposure, non-USD invoicing fell from 60% to 55% of sales (USD 45%, Euro 26%, RMB 20%, JPY 3%, Other 6%). While top-line commercial revenue remains unhedged, TE Connectivity protects balance-sheet equity via $4,416 million in foreign debt net investment hedges and $5,759 million in cross-currency swaps maturing through FY2031 (receiving 1.8%–2.0% USD interest; a 10% FX shift alters fair value by $594 million). Following the Supreme Court's IEEPA ruling, TE received $91 million in U.S. Customs and Border Protection (CBP) refunds (credited to Cost of Sales) against an $87 million customer refund liability (debited to Net Sales), leaving a +$4 million net operating variance. In parallel, TE paid $14 million to CBP in FY2026 to resolve a prior disclosure on Section 301 country-of-origin duties. Operationally, TE achieved >70% Scope 1 and 2 greenhouse gas (GHG) reductions ahead of its 2030 target (vs. 2020 baseline) on 80%+ renewable electricity and >25% energy intensity reduction, while pursuing an SBTi-validated 30% Scope 3 cut by FY2032 (vs. 2022), a 3% enterprise water reduction by FY2029 (after hitting -15% at 30 high-stress sites in FY2025), and 98% Zero Waste to Landfill diversion by FY2029 (~95% in FY2026). Chemical regulations (EU REACH, RoHS, WEEE, ELV, TSCA/EPA) and Conflict Minerals (3TG) audits govern fluoropolymer and precious metal sourcing.
HDIN Institutional Verdict: Capital Allocation Discipline vs. Forensic QoE Realities
Management enters FY2027 with record firm backlog of $8,388 million (+35.6% YoY; 42.2% or 5.1 months of annual sales), projecting 80%–85% conversion ($6.7 billion–$7.1 billion) in FY2027. Q1 FY2027 guidance targets ~$5.35 billion in net sales (+14.6% YoY vs. $4.67 billion, including ~$17 million FX and excluding Astrodyne TDI) and $3.04 diluted EPS, while full-year FY2027 targets double-digit reported sales growth, ~11.9% organic expansion, and ~6% CapEx intensity. Over FY2025–FY2026, following its September 30, 2024 redomiciliation from Switzerland to Ireland ($31 million total costs; $45 billion FY2026 distributable reserves; 8 million treasury shares cancelled directly by the Board), TE Connectivity deployed $11,580 million across organic reinvestment ($3,829 million; 33.1%), M&A ($2,840 million; 24.5%), and shareholder returns ($4,911 million; 42.4%, retiring 17 million shares or ~5.5% of float and raising quarterly dividends to $0.78/share for Q1 FY2027, with $2.5 billion buyback authorization remaining). GAAP ROIC expanded 760 bps from 11.4% to 19.0% (and +270 bps from 16.3% to 19.0% on an 18% normalized tax rate) on $17,270 million average invested capital.
The $2,307 million Richards Manufacturing acquisition ($2,348 million gross less $41 million cash) booked $1,042 million in goodwill (~$600 million tax-deductible through 2040, >$125 million tax shield), $1,120 million in intangibles ($1,000 million 20-year customer relationships at $50 million annual amortization; $90 million 16-year technology; $30 million 10-year trademarks), $169 million working capital, and $60 million PP&E. While Richards reported $5 million in 6-month FY2025 GAAP operating income on $179 million sales, stripping out $28 million in acquisition/integration fees and $7 million in inventory step-up reveals $40 million in normalized operating profit (22.3% margin), prior to adding +$227 million in incremental H1 FY2026 sales. Consolidated goodwill reached $7,420 million (78.2% / $5,806 million in Industrial; $1,614 million in Transportation; $4,249 million historical impairment), with zero FY2025–FY2026 impairment supported by ~$60 billion–$62 billion equity capitalization (~4.5x market-to-book vs. $13,573 million equity). Net debt fell $497 million YoY to $3,942 million ($5,639 million total debt less $1,697 million cash), or ~0.8x EBITDA against a 3.75x credit covenant ceiling, even as interest expense climbed 61.0% to $124 million (4.875%–5.00% senior note issuances).
Forensic cross-examination reveals three operational constraints behind management's bullish guidance. First, Non-GAAP Adjusted Operating Margin (20.8%) excludes $152 million in restructuring and acquisition add-backs ($522 million over three years). Because continuous line migration from Germany to Mexico, Eastern Europe, North Africa, and China is structurally required to absorb 1%–2% annual automotive price erosion, management's own FY2027 guidance of ~$80 million in charges and ~$100 million in cash outflows confirms restructuring is a permanent operating cost—placing true economic operating margin near ~19.6%. Second, the $203 million improvement in the pension deficit ($609 million to $406 million) stemmed predominantly from discount rates rising to 4.99% (non-U.S.) and 6.41% (U.S.), masking modest $80 million asset returns; any 100 bps central bank rate cut would re-expand obligations by over $200 million. Combined with $701 million in UTPs (plus $9,251 million DTA valuation allowances and $37.7 billion in permanently reinvested foreign earnings containing ~$3.5 billion in cash/intercompany deposits) and $1,626 million in firm purchase obligations (+55.4% YoY), cash demands remain elevated. Third, backlog orders carry unilateral pre-shipment cancellation clauses under ASC 606 short-duration practical expedients, exposing TE Connectivity to rapid hyperscaler AI architecture shifts (e.g., co-packaged optics vs. copper) and regulatory timing risks on the $1.4 billion Astrodyne TDI closing.
Key Financial Questions From the FY2026 Filing
What drove TE Connectivity's revenue and operating margin expansion in FY2026?
Consolidated net sales grew 15.2% YoY to $19,885 million on 11.9% organic growth (+$1,877 million volume/mix and +$185 million net pricing), +$289 million in FX translation, and +$272 million in M&A, partially offset by an -$87 million IEEPA tariff customer refund. GAAP operating margin rose 150 bps to 20.1% ($3,991 million) as Industrial Solutions expanded 270 bps to 20.4% on +43.5% organic Digital Data Networks growth and +$219 million in net pricing, while $189 million in realized commodity hedge gains and $80 million in FY2025 restructuring savings expanded gross margin by 100 bps to 36.2%.
How is TE Connectivity allocating capital and expanding its regional infrastructure?
Management deployed $5,037 million in FY2026 ($11,580 million over FY2025–FY2026), shifting 61.9% of FY2026 CapEx ($694 million, +57.4% YoY) to Industrial Solutions while committing $1.4 billion to acquire Astrodyne TDI and returning $2,761 million via dividends ($869 million) and buybacks ($1,892 million). Regionally, consolidated net PP&E rose to $4,637 million across 105 facilities, led by China ($1,070 million, +26.8% over two years) and Other Asia–Pacific ($556 million, +67.5%, including branch operations in Taiwan, Province of China), alongside nearshoring expansion in Mexico ($158 million Other Americas) and Eastern Europe/North Africa as German PP&E contracted 9.7% to $529 million.
What are the primary forensic earnings quality and balance sheet risks in the FY2026 10-K?
Treating recurring restructuring ($110 million FY2026 pure charges; $491 million three-year cash outflow; ~$100 million FY2027E spend) as ongoing operating maintenance reduces baseline operating margin by 100–120 bps from 20.8% Non-GAAP to ~19.6%. Additionally, TE carries $1,553 million in aggregate identified liquidity claims—anchored by $701 million in uncertain tax positions (~$130 million resolving within 12 months) and a $406 million rate-sensitive pension deficit—though FY2026 Free Cash Flow of $3,403 million and 0.8x net leverage provide 2.19x coverage.
Presentation Download & Analyst Briefing Access:
- Institutional Presentation: Download the full "TE_Connectivity_Strategic_Transformation" PDF under the 'Related Topics' section.
- Analyst Video Briefing: Watch the "TE Connectivity 10-K Analysis: Can $3.18B AI Data Center & Grid Growth Offset Auto Cycles in 2026?" on the HDIN Research YouTube Channel.
About HDIN Research:
HDIN Research is a premier global market intelligence and strategic advisory firm specializing in institutional-grade financial analysis, supply chain audits, and macroeconomic forecasting. Our dedicated sector analysts deliver actionable, data-driven insights tailored for private equity, hedge funds, and corporate strategy teams. Visit us at https://www.hdinresearch.com.
Editorial & Methodology Disclosure:
"This market intelligence brief was researched, modeled, and audited by the HDIN Research Equity Desk based on official primary corporate filings (TE Connectivity plc FY2025 and FY2026 Form 10-K Filings). Proprietary quantitative extraction tools were utilized to ensure 100% fidelity to reported financial line items and footnotes. All forensic interpretations, segmental benchmarks, and institutional verdicts were independently written and verified by HDIN senior sector analysts in accordance with institutional research standards."