Joywell 1H26 IPO Analysis: 63.88% Margin & 224G IP | HDIN
Date : 2026-11-20
Reading : 138
BEIJING — HDIN Market Intelligence Brief | Audited by HDIN Equity Research Desk | Source Filing: STAR Market IPO Prospectus (Draft / FY2023–1H2026)
HDIN Executive Takeaways
1. Margin Inflection: 1H26 revenue hit RMB 282.07M (FY23–25 CAGR 385.40%); 88.98%-margin SerDes IP reached 49.54% of sales, lifting gross margin to 63.88% and net profit to RMB 62.22M.
2. Capex & Supply Chain: Seeking RMB 3.00B in IPO proceeds (RMB 1.12B for 12nm/7nm/5nm tape-outs), Joywell leases 5,259.05 m² in Mainland China while prepaying RMB 215.21M to Supplier B.
3. Institutional Verdict: Zero R&D capitalization confirms earnings quality, yet -RMB 173.40M operating cash flow and 83.19% top-five supplier concentration highlight foundry-lockup and execution risks.
Figure Joywell Semiconductor lPO Deep-Dive Decoding the High-Speed interconnect & SerDes Engine
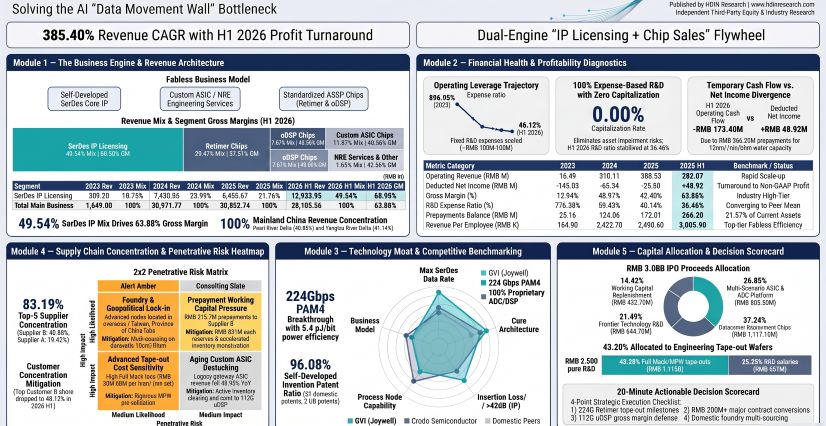
Joywell FY23–1H26 Segmental Revenue, Unit Economics, and 63.88% Gross Margin Expansion
Joywell Semiconductor (Shanghai) Co., Ltd. [Unlisted / STAR Market IPO Prospectus Filing] scaled total operating revenue from RMB 16.49M in FY23 to RMB 388.53M in FY25 (a 385.40% three-year CAGR) and RMB 282.07M in 1H26, reversing a FY23 net loss of RMB 127.10M into net profit attributable to the parent of RMB 12.64M in FY25 and RMB 62.22M in 1H26. Deducted non-recurring (non-GAAP) net profit reached an inflection point of RMB 48.92M in 1H26, compared with -RMB 25.80M in FY25, -RMB 65.24M in FY24, and -RMB 145.03M in FY23. Consolidated gross margin expanded by 2,148 basis points (bps) from 42.40% in FY25 to 63.88% in 1H26, driven by a structural mix shift toward high-margin high-speed SerDes IP licensing (49.54% of 1H26 main revenue at an 88.98% gross margin) and volume ramp-up in 112G optical digital signal processor (oDSP) chips.
Table: Joywell Semiconductor Consolidated Financial, Segmental Revenue, and Margin Performance (FY23–1H26)
*Note: Figures in RMB millions are converted from exact prospectus RMB ten-thousands (`万元`). Main business revenue excludes minor test-board/equipment sales of RMB 0.39M in FY24 and RMB 1.01M in 1H26.*
Joywell executes an "IP as Foundation, Chips as Application" commercial flywheel across four core pillars: SerDes interfaces, ADC/DAC, PLL, and DSP. Underlying IP licensing establishes early architectural lock-in with domestic XPU and switch designers, generating ~90% gross margin cash flow without external royalty obligations. Verified silicon deployments then validate signal integrity in live datacenter backplanes, converting IP licensees into Retimer and oDSP chip buyers. This conversion is evidenced by Innolight's ecosystem: after signing an initial RMB 22.89M NRE development contract with Suzhou Innolight, Innolight's wholly owned subsidiary Zhihe Guangtong executed two 112G oDSP chip procurement contracts totaling RMB 58.79M in December 2025. Similarly, an early RMB 10.93M NRE engagement with Customer A in FY23 expanded into RMB 231.58M (FY24) and RMB 270.85M (FY25) of custom gateway ASIC and Retimer deliveries via Customer C (Customer B's subsidiary), with cumulative Retimer cross-sales to Customer B exceeding RMB 630.00M since FY24.
Table: Joywell Semiconductor Unit Economics, Production Metrics, and Operating Leverage (FY23–1H26)
In 1H26, Joywell's sales-to-production ratio spiked to 152.63% (6.49M units sold vs. 4.26M produced), compared with 55.61% in FY23, 95.66% in FY24, and 93.57% in FY25, reflecting active destocking of legacy custom gateway ASIC inventory alongside a manufacturing reallocation toward higher-value 112G oDSP wafers. Operating leverage expanded sharply across its pure-Fabless structure: fixed R&D investment stabilized around RMB 155.97M–184.26M annually (cumulative 3.5-year spend of RMB 571.09M; 1H26 R&D expense ratio of 36.46% converged with the 36.52% domestic peer average vs. 13.58% at Montage Technology and 47.23% at VeriSilicon). Accounting policies remain strictly conservative: 0.00% R&D capitalization eliminates intangible write-down exposure; electronic equipment depreciates over 3 years (5% residual) and test instruments over 3–5 years; and 3–12 month receivables carry a 3.00% bad-debt provision (vs. 0.50% at Montage Technology and 1.00% at Motorcomm), while NRE and IP revenues are recognized solely at point-in-time customer acceptance rather than percentage-of-completion estimates.
Table: Joywell Semiconductor Working Capital, Cash Flow, and Government Subsidy Profile (FY23–1H26)
Fabless Supply Chain Architecture, RMB 3.00B IPO Allocation, and Mainland China Footprint
Operating an ultra-light Fabless model with zero owned land or real estate, Joywell conducts R&D and commercial operations across four leased properties totaling 5,259.05 m²: its Zhangjiang, Pudong, Shanghai headquarters and R&D center (3,800.26 m²), two Chengdu Qingyang branch offices (363.69 m² and 686.10 m²), and a Hangzhou Binjiang subsidiary (409.00 m²). As of June 30, 2026, net fixed assets stood at RMB 43.31M—comprising just 3.29% of RMB 1,316.24M in total assets (predominantly lab testing equipment at RMB 32.20M), while liquid and current assets accounted for 93.77% (RMB 1,234.30M, including RMB 631.27M in cash and equivalents). Geographically, Mainland China generated 100.00% of main business revenue across FY23–1H26 (1H26 regional split: East China 41.14%, South China 40.55%, North China 11.82%, Southwest China 5.98%, and Central China 0.51%; Taiwan, Province of China 0.00%; Overseas 0.00%), aligning directly with clustered domestic AI server OEMs and optical transceiver integrators.
To fund next-generation Scale-up and Scale-out interconnect silicon, Joywell is seeking RMB 3,000.00M in STAR Market IPO proceeds against a RMB 3,014.12M total capital plan. Direct R&D and industrialization projects total RMB 2,581.42M over four-year construction cycles, heavily weighted toward 12nm/7nm/5nm FinFET engineering wafer tape-outs and full-mask sets (RMB 1,115.11M, or 43.20% of the three-project total and 53.66% of direct R&D outlays) and engineering payroll (RMB 651.17M, or 25.23%, supporting expansion from 128 to an estimated 250–300 R&D engineers at ~RMB 750k–800k annualized compensation). New fixed asset purchases of ~RMB 162.00M are projected to add ~RMB 32.00M in annual five-year depreciation, a sum readily absorbed by current ~63.88% gross margins.
Table: Joywell Semiconductor IPO Proceeds Allocation and Four-Year R&D Capital Deployment (RMB Millions)
On the supply side, Joywell's procurement relies heavily on external foundries and OSATs, with top-five supplier concentration registering 87.39% (FY23), 87.55% (FY24), 75.49% (FY25), and 83.19% (1H26). In 1H26, COGS comprised 46.04% direct wafer materials (RMB 46.74M), 39.90% OSAT fees (RMB 40.51M), and 14.06% other manufacturing costs (RMB 14.27M). Wafer fabrication is concentrated (>90% combined) in Supplier A (with 5-year and 8-year framework agreements signed in 2021 and 2024) and Supplier B (which accounted for 48.98% of 1H26 procurement and over RMB 160M in 2026 wafer contracts, alongside advanced-node capacity located overseas and in Taiwan, Province of China). Packaging and testing are executed by STATS ChipPAC, Huatian Technology, V-Test, and King Yuan Electronics' Suzhou subsidiary Jinglong Technology (Taiwan, Province of China-affiliated). EDA toolchains remain partially dependent on Synopsys and Cadence (RMB 27.63M gross software intangibles; RMB 28.43M total IP/EDA spend in FY25), mitigated by domestic substitution via UniVista (4.72% of FY23 procurement) and RISC-V MCU IP from Shanghai Nuclei System (RMB 6.62M in FY23).
Table: Joywell Semiconductor Supply Chain Concentration, Procurement Mix, and Major Commercial Contracts (FY23–1H26)
Technically, Joywell holds 100% self-developed ADC/DSP-based SerDes IP spanning 56G, 112G, and licensed 224G PAM4 (with 448G PAM6/8 in pre-research), achieving >=38dB insertion loss compensation at 14.5GHz (Retimer) and >42dB (112G IP), 4.12e-9 receive BER at 42dB, 113 fs rms transmit random jitter, 0.996 eye linearity, and 5.4 pJ/bit power efficiency on FinFET 12nm/7nm/5nm nodes. Its IP asset base as of June 30, 2026 comprises 54 authorized patents (51 domestic invention patents—49 self-developed, or 96.08%; 1 transferred 2017 utility model; and 2 self-developed US invention patents, US11811400 and US11811414), 35 IC layout designs (33 self-developed, 94.29%), and 10 self-developed software copyrights, with zero cooperative R&D and zero pending IP litigation. Per Frost & Sullivan, IPnest, and LightCounting data cited in the filing, Joywell ranked #1 among domestic vendors (#4 overall) in China's 56G Ethernet Retimer market (China Retimer TAM growing at a 48.05% CAGR from RMB 2.02B in 2025E to RMB 14.37B in 2030E) and #1 among domestic vendors in China's 56G+ SerDes IP market (25.40% CAGR to RMB 4.40B in 2030E), alongside China's oDSP TAM expanding at a 19.09% CAGR to RMB 12.52B by 2030E.
HDIN Institutional Verdict: 1H26 Profit Turnaround vs. -RMB 173.40M Cash Flow Reality
While management's commercial narrative highlights a decisive 1H26 profitability breakthrough (RMB 62.22M GAAP net profit; RMB 48.92M non-GAAP net profit) and resilient full-year breakeven sensitivity—the prospectus models FY26 full-year profitability across Base, Optimistic (+10% revenue, +300 bps margin), and Mild Pressure (-10% revenue, -300 bps margin) scenarios, slipping to FY27 only under an Extreme Pessimistic shock (-10% revenue, -300 bps margin, +5% expenses)—forensic scrutiny reveals four operational friction points requiring disciplined investor discounting.
First, accounting profits sharply diverge from cash generation. In 1H26, operating cash flow plunged to -RMB 173.40M, trailing net profit by -RMB 235.62M. This drain reflects RMB 266.20M locked in supplier prepayments (up RMB 94.20M from FY25 end, with RMB 215.21M or 80.85% tied up at Foundry Supplier B), a 119.83% surge in accounts receivable to RMB 145.57M (75.88% concentrated in five debtors: Customer B RMB 35.16M, Customer R RMB 34.88M, Customer U RMB 22.90M, and Zhongji Innolight RMB 16.99M), RMB 164.62M in inventories (87.25% sitting in WIP and outsourced OSAT processing), and a RMB 38.50M drawdown in contract liabilities as prior upfront IP deposits converted to revenue. Although RMB 631.27M in cash, a 15.93% debt-to-asset ratio, and an 8.12x current ratio insulate near-term liquidity, prolonged fab lead times could accelerate working capital burn.
Second, customer concentration and product lifecycle roll-offs pose revenue continuity risks. Top-five customers still accounted for 90.72% of 1H26 sales (down from 98.97% in FY23). While reliance on Customer B declined from 75.38% in FY24 and 70.16% in FY25 to 40.13% in 1H26, legacy custom gateway ASIC sales fell 40.99% YoY in 1H26 to RMB 31.97M, with segment gross margins compressing from 54.58% (FY24) to 40.36% (1H26) amid volume discounts (including 5%–10% bulk pricing discounts on deemed related-party sales via Customer C to Customer A, totaling RMB 111.60M in 1H26). Furthermore, single-quarter results exhibit lumpy cut-off sensitivity: Q2 2026 generated 61.00% of half-year revenue (RMB 171.44M vs. RMB 109.62M in Q1) due to batched high-margin IP acceptances.
Third, advanced-node single-point failure and tape-out economics leave narrow room for engineering error. Over 90% of wafer and mask spending depends on Suppliers A and B, including advanced-node capacity exposed to export-control compliance and Taiwan, Province of China foundry/OSAT corridors, with zero immediate second-source backup at 7nm/5nm. Because R&D is 100% expensed—2024 engineering tape-out costs hit RMB 74.23M (40.29% of R&D)—a single 5nm/7nm full-mask failure costing RMB 30M–60M would erase 60%–100%+ of 1H26 non-GAAP net profit (RMB 48.92M) and inflict a 6-to-9-month market window delay against Broadcom, Marvell, and Credo. Meanwhile, with only two US patents versus thousands held by overseas incumbents, overseas expansion beyond Mainland China faces potential IP litigation barriers.
Fourth, equity governance combines high technical stability with concentrated voting control and a localized compliance flag. Actual controller and Chairman ZHONG FREEMAN YINGQUAN (US citizen with Chinese permanent residency) holds 11.31% beneficial equity and controls 34.50% of voting rights via GP stakes in employee platforms Shanghai Wenpa (11.25%), Shanghai Chengji (9.72%), and Shanghai Fangkun (3.91%) alongside concert-party agreements with Gao Xiang (6.44%), LEE SEUNG CHUL, Hangzhou Jicheng (3.18%), and Suzhou Xinyun, under a 36-month post-IPO lock-up. The register features premier state and strategic backers—China Mobile Chain-Leader Fund (6.30%), Shanghai IC Fund I & III (5.93%), National AI Fund (4.40%), Alibaba Cloud (3.96%), Tencent (2.41%), Big Fund II (1.41%), and Innolight—and a 184-person workforce where 128 R&D staff (69.57%; 65.63% Master's/PhD; zero core technical turnover; RMB 55.15M cumulative share-based payments) anchor execution. While Joywell abolished its Supervisory Board in December 2025 under the revised PRC Company Law (transferring oversight to the Board Audit Committee), investors should monitor a September 2026 CSRC Tianjin Bureau warning letter issued to CFO and Board Secretary Chen Yiqing regarding a prior listed-company tenure, alongside cross-border regulatory risks tied to key executives holding US, South Korean, and Hong Kong, China citizenship/residency.
Key Financial Questions From the FY23–1H26 IPO Filing
What drove Joywell Semiconductor's revenue and margin performance in FY23–1H26?
Revenue expanded at a 385.40% CAGR from RMB 16.49M in FY23 to RMB 388.53M in FY25 and reached RMB 282.07M in 1H26, propelled by high-speed interconnect chip shipments scaling to 717.1k units in FY25 and 504.3k units in 1H26 alongside 10 SerDes IP licenses executed in 1H26. Consolidated gross margin rose 2,148 bps from 42.40% in FY25 to 63.88% in 1H26 as 88.98%-margin SerDes IP licensing surged to 49.54% of main revenue and high-speed chip unit costs fell 37.52% from FY24's RMB 204.55/unit to RMB 127.81/unit.
How is Joywell Semiconductor allocating capital and expanding its regional infrastructure?
Joywell is raising RMB 3,000.00M in IPO proceeds against RMB 3,014.12M in total budgets, dedicating RMB 1,115.11M (43.20% of the three R&D projects) to 12nm/7nm/5nm wafer tape-outs and masks, RMB 651.17M (25.23%) to R&D payroll, and RMB 432.70M to working capital across 112G/224G/448G SerDes, Retimer, oDSP, Chiplet/UCIe, and NPO/CPO programs. Operating zero owned real estate, the company leases 5,259.05 m² across Shanghai, Chengdu, and Hangzhou while committing RMB 215.21M in prepayments to Supplier B to lock advanced-node foundry capacity.
Why did 1H26 operating cash flow diverge from net profit, and what is the FY26 profitability outlook?
Despite recording RMB 62.22M in GAAP net profit (RMB 48.92M non-GAAP), 1H26 operating cash flow fell to -RMB 173.40M because Joywell increased supplier prepayments to RMB 266.20M, expanded receivables by 119.83% to RMB 145.57M, and built RMB 164.62M in inventories (87.25% in WIP and outsourced processing). Supported by RMB 631.27M in cash and over RMB 200M in disclosed backlog contracts, prospectus sensitivity models indicate full-year FY26 profitability under Base, Optimistic, and Mild Pressure scenarios, deferring breakeven to FY27 only under extreme simultaneous revenue, margin, and expense shocks.
Presentation Download & Analyst Briefing Access:
- Institutional Presentation: Download the full "Joywell_Semiconductor_Due_Diligence" PDF under the 'Related Topics' section.
- Analyst Video Briefing: Watch the "Joywell Semiconductor IPO: Can 63.88% Gross Margin & 224G SerDes IP Overcome a RMB 173M Cash Outflow?" on the HDIN Research YouTube Channel.
About HDIN Research:
HDIN Research is a premier global market intelligence and strategic advisory firm specializing in institutional-grade financial analysis, supply chain audits, and macroeconomic forecasting. Our dedicated sector analysts deliver actionable, data-driven insights tailored for private equity, hedge funds, and corporate strategy teams. Visit us at https://www.hdinresearch.com.
Editorial & Methodology Disclosure:
"This market intelligence brief was researched, modeled, and audited by the HDIN Research Equity Desk based on official primary corporate filings (Joywell Semiconductor (Shanghai) Co., Ltd. STAR Market IPO Prospectus Draft, FY2023–1H2026). Proprietary quantitative extraction tools were utilized to ensure 100% fidelity to reported financial line items and footnotes. All forensic interpretations, segmental benchmarks, and institutional verdicts were independently written and verified by HDIN senior sector analysts in accordance with institutional research standards."
HDIN Executive Takeaways
1. Margin Inflection: 1H26 revenue hit RMB 282.07M (FY23–25 CAGR 385.40%); 88.98%-margin SerDes IP reached 49.54% of sales, lifting gross margin to 63.88% and net profit to RMB 62.22M.
2. Capex & Supply Chain: Seeking RMB 3.00B in IPO proceeds (RMB 1.12B for 12nm/7nm/5nm tape-outs), Joywell leases 5,259.05 m² in Mainland China while prepaying RMB 215.21M to Supplier B.
3. Institutional Verdict: Zero R&D capitalization confirms earnings quality, yet -RMB 173.40M operating cash flow and 83.19% top-five supplier concentration highlight foundry-lockup and execution risks.
Figure Joywell Semiconductor lPO Deep-Dive Decoding the High-Speed interconnect & SerDes Engine
Joywell FY23–1H26 Segmental Revenue, Unit Economics, and 63.88% Gross Margin Expansion
Joywell Semiconductor (Shanghai) Co., Ltd. [Unlisted / STAR Market IPO Prospectus Filing] scaled total operating revenue from RMB 16.49M in FY23 to RMB 388.53M in FY25 (a 385.40% three-year CAGR) and RMB 282.07M in 1H26, reversing a FY23 net loss of RMB 127.10M into net profit attributable to the parent of RMB 12.64M in FY25 and RMB 62.22M in 1H26. Deducted non-recurring (non-GAAP) net profit reached an inflection point of RMB 48.92M in 1H26, compared with -RMB 25.80M in FY25, -RMB 65.24M in FY24, and -RMB 145.03M in FY23. Consolidated gross margin expanded by 2,148 basis points (bps) from 42.40% in FY25 to 63.88% in 1H26, driven by a structural mix shift toward high-margin high-speed SerDes IP licensing (49.54% of 1H26 main revenue at an 88.98% gross margin) and volume ramp-up in 112G optical digital signal processor (oDSP) chips.
Table: Joywell Semiconductor Consolidated Financial, Segmental Revenue, and Margin Performance (FY23–1H26)
| Financial & Segmental Metric | FY23 | FY24 | FY25 | 1H26 | Period Shift / YoY Dynamics |
| Total Operating Revenue (RMB M) | 16.49 | 310.11 | 388.53 | 282.07 | 385.40% CAGR (FY23–FY25) |
| Main Business Revenue (RMB M) | 16.49 | 309.72 | 388.53 | 281.06 | +1,778.22% (FY24); +25.45% (FY25) |
| Net Profit Attributable to Parent (RMB M) | -127.10 | -36.40 | 12.64 | 62.22 | 1H26 erased accumulated deficit |
| Non-GAAP Net Profit (RMB M) | -145.03 | -65.24 | -25.80 | 48.92 | First core operating profit in 1H26 |
| Consolidated Gross Margin (%) | 12.94% | 48.97% | 42.40% | 63.88% | +2,148 bps vs. FY25 (+5,094 bps vs. FY23) |
| Retimer Chips Revenue (RMB M / Share) | 0.55 (3.33%) | 117.85 (38.05%) | 165.34 (42.56%) | 82.83 (29.47%) | +40.30% YoY in FY25 |
| Retimer Chips Gross Margin (%) | 41.18% | 17.22% | 25.90% | 37.51% | +1,161 bps recovery in 1H26 vs. FY25 |
| oDSP Chips Revenue (RMB M / Share) | 0.00 (0.00%) | 0.43 (0.14%) | 2.30 (0.59%) | 22.40 (7.97%) | +437.13% YoY in FY25; 1H26 ramp |
| oDSP Chips Gross Margin (%) | — | 54.33% | 54.00% | 43.35% | -1,065 bps on initial volume scaling |
| Custom ASIC Chips Revenue (RMB M / Share) | 1.75 (10.60%) | 117.14 (37.82%) | 109.66 (28.23%) | 31.97 (11.37%) | -6.38% (FY25); -40.99% YoY (1H26) |
| Custom ASIC Gross Margin (%) | 55.24% | 54.58% | 39.00% | 40.36% | Mature-node volume pricing discounts |
| SerDes IP Licensing Revenue (RMB M / Share) | 3.09 (18.75%) | 74.30 (23.99%) | 84.56 (21.76%) | 139.24 (49.54%) | +2,303.09% (FY24); +13.80% (FY25) |
| SerDes IP Licensing Gross Margin (%) | 99.89% | 90.44% | 90.63% | 88.98% | Minimal marginal support cost |
| NRE & Technical Services (RMB M / Share) | 11.10 (67.32%) | 0.00 (0.00%) | 26.66 (6.86%) | 4.63 (1.65%) | Gross margin: -19.33% (FY23) to 42.56% (1H26) |
Joywell executes an "IP as Foundation, Chips as Application" commercial flywheel across four core pillars: SerDes interfaces, ADC/DAC, PLL, and DSP. Underlying IP licensing establishes early architectural lock-in with domestic XPU and switch designers, generating ~90% gross margin cash flow without external royalty obligations. Verified silicon deployments then validate signal integrity in live datacenter backplanes, converting IP licensees into Retimer and oDSP chip buyers. This conversion is evidenced by Innolight's ecosystem: after signing an initial RMB 22.89M NRE development contract with Suzhou Innolight, Innolight's wholly owned subsidiary Zhihe Guangtong executed two 112G oDSP chip procurement contracts totaling RMB 58.79M in December 2025. Similarly, an early RMB 10.93M NRE engagement with Customer A in FY23 expanded into RMB 231.58M (FY24) and RMB 270.85M (FY25) of custom gateway ASIC and Retimer deliveries via Customer C (Customer B's subsidiary), with cumulative Retimer cross-sales to Customer B exceeding RMB 630.00M since FY24.
Table: Joywell Semiconductor Unit Economics, Production Metrics, and Operating Leverage (FY23–1H26)
| Unit Economics & Leverage Metric | FY23 | FY24 | FY25 | 1H26 | Operational Trajectory |
| High-Speed Interconnect Chips Vol. (k units) | 1.7 | 477.8 | 717.1 | 504.3 | ~300x volume scaling from FY23 |
| High-Speed Chips ASP / Unit Cost (RMB/unit) | 332.88 / 195.81 | 247.51 / 204.55 | 233.78 / 172.33 | 208.67 / 127.81 | Unit cost fell 37.52% vs. FY24 peak |
| Custom ASIC Volume (M units) | 0.20 | 16.06 | 21.31 | 5.99 | Peaked at 21.31M units in FY25 |
| Custom ASIC ASP / Unit Cost (RMB/unit) | 8.91 / 3.99 | 7.29 / 3.31 | 5.15 / 3.14 | 5.34 / 3.18 | Stabilized mature-stage unit economics |
| SerDes IP Licenses Executed (Count) | 1 | 6 | 6 | 10 | 1H26 licensing count exceeded FY25 |
| SerDes IP ASP / Cost per License (RMB M) | 3.09 / 0.003 | 12.38 / 1.18 | 14.09 / 1.32 | 13.92 / 1.53 | Transitioned from PLL to 56G–224G IP |
| Total Chip Production / Sales Vol. (M units) | 0.36 / 0.20 | 17.29 / 16.54 | 23.54 / 22.02 | 4.26 / 6.49 | 1H26 sales-to-production ratio: 152.63% |
| R&D Expenses (RMB M / % of Revenue) | 128.02 (776.38%) | 184.26 (59.42%) | 155.97 (40.14%) | 102.83 (36.46%) | 100% expensed (0.00% capitalized) |
| Sales / Admin Expense Ratio (%) | 29.54% / 91.03% | 2.64% / 6.62% | 2.67% / 8.26% | 2.48% / 7.18% | Total period exp. ratio fell from 896.95% to 46.12% |
| Annualized Revenue per Employee (RMB M) | 0.16 | 2.42 | 2.49 | 3.07 | 18.6x productivity expansion vs. FY23 |
| Annualized Non-GAAP Profit / Emp. (RMB M) | -1.45 | -0.51 | -0.17 | 0.53 | Crossed ~RMB 350M revenue breakeven |
In 1H26, Joywell's sales-to-production ratio spiked to 152.63% (6.49M units sold vs. 4.26M produced), compared with 55.61% in FY23, 95.66% in FY24, and 93.57% in FY25, reflecting active destocking of legacy custom gateway ASIC inventory alongside a manufacturing reallocation toward higher-value 112G oDSP wafers. Operating leverage expanded sharply across its pure-Fabless structure: fixed R&D investment stabilized around RMB 155.97M–184.26M annually (cumulative 3.5-year spend of RMB 571.09M; 1H26 R&D expense ratio of 36.46% converged with the 36.52% domestic peer average vs. 13.58% at Montage Technology and 47.23% at VeriSilicon). Accounting policies remain strictly conservative: 0.00% R&D capitalization eliminates intangible write-down exposure; electronic equipment depreciates over 3 years (5% residual) and test instruments over 3–5 years; and 3–12 month receivables carry a 3.00% bad-debt provision (vs. 0.50% at Montage Technology and 1.00% at Motorcomm), while NRE and IP revenues are recognized solely at point-in-time customer acceptance rather than percentage-of-completion estimates.
Table: Joywell Semiconductor Working Capital, Cash Flow, and Government Subsidy Profile (FY23–1H26)
| Balance Sheet, Cash & Audit Metric | FY23 | FY24 | FY25 | 1H26 | Forensic Audit Assessment |
| Operating Cash Flow (RMB M) | -37.30 | -119.85 | 87.60 | -173.40 | -RMB 235.62M divergence vs. 1H26 net profit |
| Prepayments (RMB M / % Current Assets) | 25.16 (9.77%) | 124.06 (22.44%) | 172.01 (13.77%) | 266.20 (21.57%) | 95.11% concentrated in Suppliers B & A |
| Accounts Receivable Book Value (RMB M) | 14.96 | 79.58 | 66.22 | 145.57 | +119.83% vs. FY25; 95.68% aged <1 year |
| AR Turnover (Times/Year) | 0.54x | 6.55x | 5.32x | 5.29x (ann.) | Below 6.06x domestic peer average |
| Inventories Book Value (RMB M) | 99.75 | 109.60 | 128.98 | 164.62 | 87.25% in WIP (RMB 53.62M) & OSAT (RMB 90.01M) |
| Contract Liabilities (RMB M) | 64.63 | 85.48 | 128.33 | 89.83 | Upfront IP/NRE deposits; -RMB 38.50M in 1H26 |
| P&L Government Subsidies (RMB M) | 16.74 | 28.17 | 46.72 | 12.69 | 368.38% of FY25 EBT; 20.39% of 1H26 EBT |
| Deferred Income Liability (RMB M) | — | — | — | 50.11 | Pending state/municipal R&D acceptance |
| Q1 / Q2 / Q3 / Q4 Revenue Share (%) | 0/0/0.9/99.1 | 15.8/24.2/22.9/37.1 | 19.8/22.5/34.4/23.3 | 39.0/61.0/—/— | Peak FY25 sales in Q3; 1H26 Q2 IP cluster |
Fabless Supply Chain Architecture, RMB 3.00B IPO Allocation, and Mainland China Footprint
Operating an ultra-light Fabless model with zero owned land or real estate, Joywell conducts R&D and commercial operations across four leased properties totaling 5,259.05 m²: its Zhangjiang, Pudong, Shanghai headquarters and R&D center (3,800.26 m²), two Chengdu Qingyang branch offices (363.69 m² and 686.10 m²), and a Hangzhou Binjiang subsidiary (409.00 m²). As of June 30, 2026, net fixed assets stood at RMB 43.31M—comprising just 3.29% of RMB 1,316.24M in total assets (predominantly lab testing equipment at RMB 32.20M), while liquid and current assets accounted for 93.77% (RMB 1,234.30M, including RMB 631.27M in cash and equivalents). Geographically, Mainland China generated 100.00% of main business revenue across FY23–1H26 (1H26 regional split: East China 41.14%, South China 40.55%, North China 11.82%, Southwest China 5.98%, and Central China 0.51%; Taiwan, Province of China 0.00%; Overseas 0.00%), aligning directly with clustered domestic AI server OEMs and optical transceiver integrators.
To fund next-generation Scale-up and Scale-out interconnect silicon, Joywell is seeking RMB 3,000.00M in STAR Market IPO proceeds against a RMB 3,014.12M total capital plan. Direct R&D and industrialization projects total RMB 2,581.42M over four-year construction cycles, heavily weighted toward 12nm/7nm/5nm FinFET engineering wafer tape-outs and full-mask sets (RMB 1,115.11M, or 43.20% of the three-project total and 53.66% of direct R&D outlays) and engineering payroll (RMB 651.17M, or 25.23%, supporting expansion from 128 to an estimated 250–300 R&D engineers at ~RMB 750k–800k annualized compensation). New fixed asset purchases of ~RMB 162.00M are projected to add ~RMB 32.00M in annual five-year depreciation, a sum readily absorbed by current ~63.88% gross margins.
Table: Joywell Semiconductor IPO Proceeds Allocation and Four-Year R&D Capital Deployment (RMB Millions)
| IPO Project / Expenditure Category | Total Investment (RMB M) | IPO Proceeds (RMB M) | Share of 3-Project R&D (%) | Strategic Scope & Physical-Layer Targets |
| AI & Datacenter High-Speed Interconnect Chips | 1,130.79 | 1,117.10 | 43.81% | 112G/224G Retimer (AEC/ACC copper) & 800G/1.6T oDSP |
| Core IP Multi-Scenario ASIC Platform | 805.81 | 805.50 | 31.22% | 224G SerDes IP, UCIe/Chiplet I/O Die, high-speed ADC/DAC |
| Frontier Technology R&D Project | 644.81 | 644.70 | 24.98% | PAM6/PAM8, 448G SerDes IP, PCIe 7.0, NPO/CPO, 3.2T/6.4T |
| Working Capital Replenishment | 432.70 | 432.70 | — | Wafer prepayments & commercial scaling liquidity |
| Total IPO Capital Plan | 3,014.12 | 3,000.00 | — | 100% allocated to core R&D & working capital |
| R&D Breakdown: Engineering Wafer Tape-out / Mask | 1,115.11 | — | 43.20% | 12nm/7nm/5nm Full Mask & MPW runs (Projects 1–3) |
| R&D Breakdown: R&D Personnel Payroll | 651.17 | — | 25.23% | 4-year talent expansion across Shanghai/Chengdu/Hangzhou |
| R&D Breakdown: Test & Packaging Development | 207.00 | — | 8.02% | 2.5D/3D Chiplet packaging & ATE test engineering |
| R&D Breakdown: Hardware, EDA & Contingency | 392.78 | — | 15.22% | Equip. RMB 141.20M; EDA RMB 100.21M; Other RMB 151.37M |
| R&D Breakdown: Initial Working Capital | 214.07 | — | 8.29% | Pre-commercialization inventory buffer (Projects 1–2) |
On the supply side, Joywell's procurement relies heavily on external foundries and OSATs, with top-five supplier concentration registering 87.39% (FY23), 87.55% (FY24), 75.49% (FY25), and 83.19% (1H26). In 1H26, COGS comprised 46.04% direct wafer materials (RMB 46.74M), 39.90% OSAT fees (RMB 40.51M), and 14.06% other manufacturing costs (RMB 14.27M). Wafer fabrication is concentrated (>90% combined) in Supplier A (with 5-year and 8-year framework agreements signed in 2021 and 2024) and Supplier B (which accounted for 48.98% of 1H26 procurement and over RMB 160M in 2026 wafer contracts, alongside advanced-node capacity located overseas and in Taiwan, Province of China). Packaging and testing are executed by STATS ChipPAC, Huatian Technology, V-Test, and King Yuan Electronics' Suzhou subsidiary Jinglong Technology (Taiwan, Province of China-affiliated). EDA toolchains remain partially dependent on Synopsys and Cadence (RMB 27.63M gross software intangibles; RMB 28.43M total IP/EDA spend in FY25), mitigated by domestic substitution via UniVista (4.72% of FY23 procurement) and RISC-V MCU IP from Shanghai Nuclei System (RMB 6.62M in FY23).
Table: Joywell Semiconductor Supply Chain Concentration, Procurement Mix, and Major Commercial Contracts (FY23–1H26)
| Supplier / Contract Category | Value / Share (1H26 or Specified) | Historical Trend / Terms | Strategic & Geopolitical Assessment |
| Supplier B (Foundry / OSAT) | RMB 74.56M (48.98% of 1H26) | FY24: 31.33%; FY25: 5.89% | Primary 112G oDSP & 224G advanced-node lockup; RMB 215.21M prepaid |
| Supplier A (Foundry) | RMB 29.56M (19.42% of 1H26) | FY23: 48.41%; FY25: 44.22% | 5-yr & 8-yr LTAs; RMB 37.98M prepaid in 1H26 |
| STATS ChipPAC (OSAT) | RMB 9.63M (6.33% of 1H26) | FY24: 18.65%; FY25: 16.30% | Domestic OSAT leader (JCET subsidiary); 30–60 day credit terms |
| Supplier I (OSAT) | RMB 7.60M (5.00% of 1H26) | Newly entered Top 5 in 1H26 | Specialized chip testing and packaging capacity |
| Jinglong Tech (OSAT) | RMB 5.28M (3.47% of 1H26) | FY25 Top 5 incl. Huatian 4.92% | Suzhou subsidiary of KYEC (Taiwan, Province of China) |
| Total 1H26 Top-5 Procurement | RMB 126.63M (83.19%) | Total 1H26 proc.: RMB 152.22M | Wafers 55.56%, OSAT 23.32%, Tape-out/Mask 21.12% |
| Disclosed Major Backlog (>RMB 200M) | Customer B; Zhihe Guangtong; Others | Active fulfillment in 2026–2027 | Customer B 2-yr framework (RMB 113M in 1H26); Innolight/Zhihe RMB 58.79M; Customer R RMB 26.53M; C*Core RMB 48.77M; Customer U RMB 21.60M; Customer F RMB 25.92M |
Technically, Joywell holds 100% self-developed ADC/DSP-based SerDes IP spanning 56G, 112G, and licensed 224G PAM4 (with 448G PAM6/8 in pre-research), achieving >=38dB insertion loss compensation at 14.5GHz (Retimer) and >42dB (112G IP), 4.12e-9 receive BER at 42dB, 113 fs rms transmit random jitter, 0.996 eye linearity, and 5.4 pJ/bit power efficiency on FinFET 12nm/7nm/5nm nodes. Its IP asset base as of June 30, 2026 comprises 54 authorized patents (51 domestic invention patents—49 self-developed, or 96.08%; 1 transferred 2017 utility model; and 2 self-developed US invention patents, US11811400 and US11811414), 35 IC layout designs (33 self-developed, 94.29%), and 10 self-developed software copyrights, with zero cooperative R&D and zero pending IP litigation. Per Frost & Sullivan, IPnest, and LightCounting data cited in the filing, Joywell ranked #1 among domestic vendors (#4 overall) in China's 56G Ethernet Retimer market (China Retimer TAM growing at a 48.05% CAGR from RMB 2.02B in 2025E to RMB 14.37B in 2030E) and #1 among domestic vendors in China's 56G+ SerDes IP market (25.40% CAGR to RMB 4.40B in 2030E), alongside China's oDSP TAM expanding at a 19.09% CAGR to RMB 12.52B by 2030E.
HDIN Institutional Verdict: 1H26 Profit Turnaround vs. -RMB 173.40M Cash Flow Reality
While management's commercial narrative highlights a decisive 1H26 profitability breakthrough (RMB 62.22M GAAP net profit; RMB 48.92M non-GAAP net profit) and resilient full-year breakeven sensitivity—the prospectus models FY26 full-year profitability across Base, Optimistic (+10% revenue, +300 bps margin), and Mild Pressure (-10% revenue, -300 bps margin) scenarios, slipping to FY27 only under an Extreme Pessimistic shock (-10% revenue, -300 bps margin, +5% expenses)—forensic scrutiny reveals four operational friction points requiring disciplined investor discounting.
First, accounting profits sharply diverge from cash generation. In 1H26, operating cash flow plunged to -RMB 173.40M, trailing net profit by -RMB 235.62M. This drain reflects RMB 266.20M locked in supplier prepayments (up RMB 94.20M from FY25 end, with RMB 215.21M or 80.85% tied up at Foundry Supplier B), a 119.83% surge in accounts receivable to RMB 145.57M (75.88% concentrated in five debtors: Customer B RMB 35.16M, Customer R RMB 34.88M, Customer U RMB 22.90M, and Zhongji Innolight RMB 16.99M), RMB 164.62M in inventories (87.25% sitting in WIP and outsourced OSAT processing), and a RMB 38.50M drawdown in contract liabilities as prior upfront IP deposits converted to revenue. Although RMB 631.27M in cash, a 15.93% debt-to-asset ratio, and an 8.12x current ratio insulate near-term liquidity, prolonged fab lead times could accelerate working capital burn.
Second, customer concentration and product lifecycle roll-offs pose revenue continuity risks. Top-five customers still accounted for 90.72% of 1H26 sales (down from 98.97% in FY23). While reliance on Customer B declined from 75.38% in FY24 and 70.16% in FY25 to 40.13% in 1H26, legacy custom gateway ASIC sales fell 40.99% YoY in 1H26 to RMB 31.97M, with segment gross margins compressing from 54.58% (FY24) to 40.36% (1H26) amid volume discounts (including 5%–10% bulk pricing discounts on deemed related-party sales via Customer C to Customer A, totaling RMB 111.60M in 1H26). Furthermore, single-quarter results exhibit lumpy cut-off sensitivity: Q2 2026 generated 61.00% of half-year revenue (RMB 171.44M vs. RMB 109.62M in Q1) due to batched high-margin IP acceptances.
Third, advanced-node single-point failure and tape-out economics leave narrow room for engineering error. Over 90% of wafer and mask spending depends on Suppliers A and B, including advanced-node capacity exposed to export-control compliance and Taiwan, Province of China foundry/OSAT corridors, with zero immediate second-source backup at 7nm/5nm. Because R&D is 100% expensed—2024 engineering tape-out costs hit RMB 74.23M (40.29% of R&D)—a single 5nm/7nm full-mask failure costing RMB 30M–60M would erase 60%–100%+ of 1H26 non-GAAP net profit (RMB 48.92M) and inflict a 6-to-9-month market window delay against Broadcom, Marvell, and Credo. Meanwhile, with only two US patents versus thousands held by overseas incumbents, overseas expansion beyond Mainland China faces potential IP litigation barriers.
Fourth, equity governance combines high technical stability with concentrated voting control and a localized compliance flag. Actual controller and Chairman ZHONG FREEMAN YINGQUAN (US citizen with Chinese permanent residency) holds 11.31% beneficial equity and controls 34.50% of voting rights via GP stakes in employee platforms Shanghai Wenpa (11.25%), Shanghai Chengji (9.72%), and Shanghai Fangkun (3.91%) alongside concert-party agreements with Gao Xiang (6.44%), LEE SEUNG CHUL, Hangzhou Jicheng (3.18%), and Suzhou Xinyun, under a 36-month post-IPO lock-up. The register features premier state and strategic backers—China Mobile Chain-Leader Fund (6.30%), Shanghai IC Fund I & III (5.93%), National AI Fund (4.40%), Alibaba Cloud (3.96%), Tencent (2.41%), Big Fund II (1.41%), and Innolight—and a 184-person workforce where 128 R&D staff (69.57%; 65.63% Master's/PhD; zero core technical turnover; RMB 55.15M cumulative share-based payments) anchor execution. While Joywell abolished its Supervisory Board in December 2025 under the revised PRC Company Law (transferring oversight to the Board Audit Committee), investors should monitor a September 2026 CSRC Tianjin Bureau warning letter issued to CFO and Board Secretary Chen Yiqing regarding a prior listed-company tenure, alongside cross-border regulatory risks tied to key executives holding US, South Korean, and Hong Kong, China citizenship/residency.
Key Financial Questions From the FY23–1H26 IPO Filing
What drove Joywell Semiconductor's revenue and margin performance in FY23–1H26?
Revenue expanded at a 385.40% CAGR from RMB 16.49M in FY23 to RMB 388.53M in FY25 and reached RMB 282.07M in 1H26, propelled by high-speed interconnect chip shipments scaling to 717.1k units in FY25 and 504.3k units in 1H26 alongside 10 SerDes IP licenses executed in 1H26. Consolidated gross margin rose 2,148 bps from 42.40% in FY25 to 63.88% in 1H26 as 88.98%-margin SerDes IP licensing surged to 49.54% of main revenue and high-speed chip unit costs fell 37.52% from FY24's RMB 204.55/unit to RMB 127.81/unit.
How is Joywell Semiconductor allocating capital and expanding its regional infrastructure?
Joywell is raising RMB 3,000.00M in IPO proceeds against RMB 3,014.12M in total budgets, dedicating RMB 1,115.11M (43.20% of the three R&D projects) to 12nm/7nm/5nm wafer tape-outs and masks, RMB 651.17M (25.23%) to R&D payroll, and RMB 432.70M to working capital across 112G/224G/448G SerDes, Retimer, oDSP, Chiplet/UCIe, and NPO/CPO programs. Operating zero owned real estate, the company leases 5,259.05 m² across Shanghai, Chengdu, and Hangzhou while committing RMB 215.21M in prepayments to Supplier B to lock advanced-node foundry capacity.
Why did 1H26 operating cash flow diverge from net profit, and what is the FY26 profitability outlook?
Despite recording RMB 62.22M in GAAP net profit (RMB 48.92M non-GAAP), 1H26 operating cash flow fell to -RMB 173.40M because Joywell increased supplier prepayments to RMB 266.20M, expanded receivables by 119.83% to RMB 145.57M, and built RMB 164.62M in inventories (87.25% in WIP and outsourced processing). Supported by RMB 631.27M in cash and over RMB 200M in disclosed backlog contracts, prospectus sensitivity models indicate full-year FY26 profitability under Base, Optimistic, and Mild Pressure scenarios, deferring breakeven to FY27 only under extreme simultaneous revenue, margin, and expense shocks.
Presentation Download & Analyst Briefing Access:
- Institutional Presentation: Download the full "Joywell_Semiconductor_Due_Diligence" PDF under the 'Related Topics' section.
- Analyst Video Briefing: Watch the "Joywell Semiconductor IPO: Can 63.88% Gross Margin & 224G SerDes IP Overcome a RMB 173M Cash Outflow?" on the HDIN Research YouTube Channel.
About HDIN Research:
HDIN Research is a premier global market intelligence and strategic advisory firm specializing in institutional-grade financial analysis, supply chain audits, and macroeconomic forecasting. Our dedicated sector analysts deliver actionable, data-driven insights tailored for private equity, hedge funds, and corporate strategy teams. Visit us at https://www.hdinresearch.com.
Editorial & Methodology Disclosure:
"This market intelligence brief was researched, modeled, and audited by the HDIN Research Equity Desk based on official primary corporate filings (Joywell Semiconductor (Shanghai) Co., Ltd. STAR Market IPO Prospectus Draft, FY2023–1H2026). Proprietary quantitative extraction tools were utilized to ensure 100% fidelity to reported financial line items and footnotes. All forensic interpretations, segmental benchmarks, and institutional verdicts were independently written and verified by HDIN senior sector analysts in accordance with institutional research standards."