Johnson Controls FY26 Audit: 18.42% Margin | HDIN Research
Date : 2026-11-20
Reading : 198
BEIJING — HDIN Market Intelligence Brief | Audited by HDIN Equity Research Desk | Source Filing: FY2025 & FY2026 Form 10-K (Ended September 30, 2025 & September 30, 2026)
HDIN Executive Takeaways
1. Margin & Backlog Inflection: FY26 continuing sales rose 8.77% to $25,666M, lifting Segment EBITA margin 144 bps to 18.42% ($4,728M) as data center orders pushed backlog up 43% to $23.0B.
2. Capex & Footprint Pivot: Management is doubling FY27 CapEx to ~$900M across 24M sq ft globally, integrating $291M liquid cooling M&A and expanding restructuring to $750M ($1.1B run-rate savings).
3. Institutional Verdict: Contract liabilities surged 30.54% to $3,894M, cutting CCC 9 days to 48.0 days and fueling 118.30% FCF conversion, despite ~$150M–$200M lingering corporate stranded costs.
Figure Johnson Controls International (JCl) FY2025-FY2026 Strategic Pivot & Executive Financial Audit
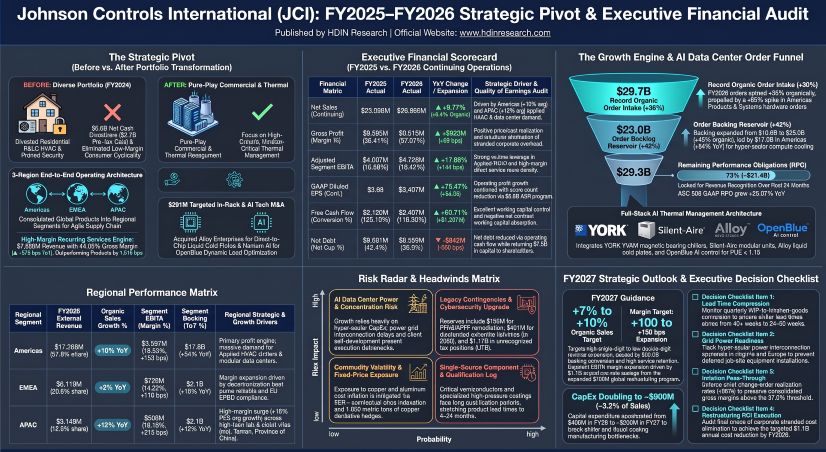 Johnson Controls FY26 Segmental Revenue, Margin Expansion, and Quality of Earnings
Johnson Controls International plc [NYSE: JCI] generated $25,666 million in continuing operations net sales in FY26, up 8.77% reported (+8.42% organic) from $23,596 million in FY25, while continuing net income attributable to JCI shareholders rose 67.34% to $2,880 million (11.22% net margin, +393 bps) and continuing diluted EPS expanded 79.47% to $4.72. Following the July 31, 2025 divestiture of its Residential and Light Commercial HVAC (R&LC HVAC) business to Robert Bosch GmbH for $5,600 million in net cash proceeds and the earlier divestiture of Air Distribution Technologies (ADTi, releasing ~$345 million cash in FY25), Johnson Controls completed its operational transition into a pure-play commercial building solutions and mission-critical thermal management company.
Table Johnson Controls FY2025 vs. FY2026 Consolidated Continuing Operations Performance ($ Millions, except EPS)
Top-line variance from FY25 to FY26 (+$2,070 million) decomposed into +$1,988 million (+8.42%) organic expansion, +$215 million (+0.91%) foreign currency translation tailwinds, and -$133 million (-0.56%) net portfolio divestitures. Effective April 1, 2025, JCI eliminated its Global Products matrix structure and reorganized into three end-to-end regional segments: Americas (led by Todd Grabowski), EMEA, and APAC (led by Susan Hughes).
Table Johnson Controls FY2025 vs. FY2026 Regional Segment Revenue, EBITA, Orders, and Backlog ($ Millions / Billions)
*Note: FY25 ending backlog totaled $16.6B enterprise-wide ($14.9B across segment systems and services). Americas accounted for 67.8% of FY26 sales, 71.8% of Segment EBITA, and 77.39% of ending backlog (EMEA 13.48%, APAC 9.13%). Americas Products & Systems orders surged +69% (backlog +63%; Services orders +5%), EMEA P&S orders rose +15% (Services +2%; backlog P&S +18%, Services +16%), and APAC P&S sales rose +16% organic (orders P&S +12%, Services +4%; backlog P&S +13%, Services +10%).
By revenue stream, Services represented 31.03% of FY26 sales ($7,965 million vs. $7,472 million or 31.67% in FY25) while delivering a 44.08% gross margin (+379 bps YoY from 40.29%) as service cost of sales fell $7 million from $4,461 million to $4,454 million. Products and Systems revenue grew 9.78% to $17,701 million (68.97% of sales vs. 68.33% in FY25), with cost of sales rising from $10,543 million to $11,697 million and gross margin compressing 69 bps from 34.61% to 33.92%, leaving a 1,016 bps gross margin spread in favor of Services.
Table Johnson Controls FY2025 vs. FY2026 GAAP Pre-Tax Income to Non-GAAP Segment EBITA Reconciliation ($ Millions)
Non-cash impairment charges declined 68.32% from $382 million in FY25 ($206 million goodwill/intangibles and $176 million long-lived assets, including $156 million in Americas Retail and $184 million in EMEA Subscriber) to $121 million in FY26 ($38 million goodwill/intangibles and $83 million long-lived assets, including a $50 million impairment on ADT Spain prior to its $98 million closing).
Unallocated corporate expenses peaked at $767 million in FY25 (3.25% of sales, +112 bps from FY24) due to Transition Services Agreement (TSA) and dual-system carve-out friction, before falling 14.86% ($114 million) to $653 million in FY26 (2.54% of sales, -71 bps). Against the FY23 ($429 million, 1.92% of $22,331 million sales) and FY24 ($490 million, 2.13% of $22,952 million sales) pre-divestiture baselines, FY26 corporate overhead remains $163 million above FY24 levels, indicating ~$150 million to $200 million of residual stranded costs. Consequently, management expanded its Q4 FY24 $400 million restructuring program (originally targeting $500 million in annual savings) by $350 million in Q4 FY26 to $750 million through FY28, targeting $1,100 million ($1.1 billion) in run-rate annual savings (+120%).
Working capital dynamics further confirm commercial pricing leverage. Under ASC 606 over-time cost-to-cost accounting, JCI expanded contract liabilities by 30.54% (+$911 million) to $3,894 million while limiting contract asset growth to 5.32% (+$79 million), widening net customer funding to $2,329 million (+55.58%) through 20%–40% non-refundable production slot deposits. Simultaneously, the Cash Conversion Cycle (CCC) improved by 9.0 days from 57.0 days to 48.0 days, while remaining performance obligations (RPO) rose 29.07% to $29.3 billion (73% or ~$21.39 billion convertible within 24 months, up from 63% or ~$14.3 billion of $22.7 billion RPO in FY25; 27% or ~$7.91 billion spanning 25–35 year lifecycle contracts).
Balance sheet leverage contracted alongside capital returns. Gross debt declined 6.10% from $9,880 million to $9,277 million ($678 million short-term debt, $1,066 million current long-term debt, $7,533 million long-term debt vs. $723 million, $566 million, $8,591 million in FY25), while cash rose 63.06% from $379 million to $618 million, lowering net debt 8.86% from $9,501 million to $8,659 million. Net debt-to-net capitalization improved 350 bps from 42.4% to 38.9% (total debt-to-total capitalization fell 280 bps from 43.3% to 40.5% on $13,611 million JCI equity / $13,646 million total equity). Principal debt maturities ($8,631 million total) are well laddered: $1,066 million in FY27 (EURIBOR+0.75% $283M, €500M 0.375% $567M, TORF+0.40% Yen $191M), $681 million in FY28 (€600M 3.000%), $700 million in FY29 (5.500%), $625 million in FY30 (1.750%), $500 million in FY31 (2.000% SLN), and $5,059 million maturing through 2064, backed by an undrawn $2.5 billion revolver (maturing December 2028) and BBB+ (S&P) / Baa1 (Moody's) ratings.
On global tax and treasury risk, JCI's GAAP effective tax rate increased from 12.44% in FY25 to 15.65% in FY26 (Adjusted ETR ~13.0% to ~14.5%) against Ireland's 12.5% statutory corporate rate, while cash taxes paid rose 8.09% from $606 million to $655 million (following $1,400 million paid in FY25 for R&LC operations and divestiture). Under OECD Pillar Two (enacted via Ireland's Finance (No. 2) Bill 2023 on December 18, 2023, effective FY25; Schaffhausen, Switzerland's 15% IMTM rate effective January 1, 2024 yielded an $80 million discrete FY24 deferred tax benefit), FY25–FY26 impacts were immaterial, though management indefinitely reinvests $23.9 billion of foreign outside basis differences (up from $22.7 billion in FY25). Corporate Treasury hedges 70%–90% of net FX transaction exposures and maintains €2.9 billion in EUR net investment hedges ($3.3 billion fair value in FY26, yielding $129 million CTA pre-tax gain after settling ¥30 billion JPY hedges post-Hitachi).
Global Thermal Infrastructure Footprint, FY27 CapEx Doubling, and Regional Moats
To convert its record $23.0 billion backlog and address hyperscale AI rack power densities shifting from 5–10 kW (15–20 kW air-cooling ceiling) to 40–100 kW+, Johnson Controls operates approximately 24 million square feet of real estate across nearly 60 countries (7 million sq ft owned, 17 million sq ft leased in FY26, up 1 million sq ft from 23 million sq ft—6 million owned, 17 million leased—in FY25), anchored by its statutory headquarters at One Albert Quay, Cork, Ireland (T12 X8N6) and North American operational headquarters in Milwaukee, Wisconsin. Management is doubling FY27 capital expenditures from $465 million (1.81% of sales) in FY26 to approximately $900 million (~3.2% of projected sales) to expand global thermal management chiller test stands, compressor lines, and liquid cooling capacity under an "In-Region, For-Region" manufacturing model.
- Americas Manufacturing & Liquid Cooling Core: Large-tonnage YORK® centrifugal and screw chillers are built in York, Pennsylvania, alongside specialty fire suppression systems at Marinette, Wisconsin (including the Stanton Street site), additional plants in Texas, California, and Mexico, Silent-Aire® prefabricated modular data center integration in Edmonton, Alberta, Canada (cutting construction timelines by 30%–50%), and Alloy Enterprises microchannel direct-to-chip cold plate and Coolant Distribution Unit (CDU) production following the $291 million Q3 FY26 acquisition of Alloy Enterprises and Nantum AI ($181 million goodwill, $127 million technology intangibles).
- EMEA Industrial Heat Pump & Decarbonization Network: Anchored by Sabroe® industrial refrigeration and high-temperature heat pump facilities in Hornslet, Denmark, plus commercial HVAC, controls, and valve R&D hubs in Germany, the United Kingdom, Italy, and France serving FLAP-D data center corridors and EU Energy Efficiency Directive (EED), EU Heat Transition, and Energy Performance of Buildings Directive (EPBD) mandates.
- APAC High-Elasticity Production Hub: Centered on Wuxi, China—one of the company's largest global centrifugal chiller manufacturing and test centers—and the Shanghai APAC headquarters and R&D center, supported by direct operations in Japan, Singapore, Australia, South Korea, and a Greater China commercial network spanning the Chinese Mainland, Hong Kong SAR, Macao SAR, and Taiwan, Province of China.
Research and development expenditure totaled $265 million in FY26 (1.03% of sales, 4.81% of SG&A) versus $273 million in FY25 (1.16% of sales, 4.74% of SG&A) and $267 million in FY24 (1.16% of sales, 4.72% of SG&A). Rather than incurring material standalone regulatory CapEx for low-GWP refrigerant mandates (U.S. EPA AIM Act requiring a 70% HFC phase-down by 2029 and GWP <700, alongside EU F-Gas rules), JCI embeds R-454B and R-1234ze (A2L) thermal redesigns directly into ongoing R&D, supporting structural ASP premiums on YORK® YVAM oil-free magnetic-bearing chillers (delivering PUE <1.15) and retrofit demand across its installed base. Paired with Metasys® building automation, PENN® controls, OpenBlue® cloud AI optimization (enhanced by Nantum AI), and non-fluorinated Ansul® / Simplex® / Grinnell® fire suppression (SAPPHIRE and Inergen clean agents), JCI maintains an end-to-end integration moat against single-domain rivals including Trane Technologies, Carrier Global, Daikin Industries, Siemens, Schneider Electric, Honeywell, Vertiv Holdings, and API Group. This technical integration is reinforced by ~84,000 employees (31,000 U.S., 53,000 international) operating a direct service channel that lowers OSHA Total Recordable Incident Rate (TRIR) to 0.31 (from 0.34 in FY25) and Lost Time Incident Rate (LTIR) to 0.13 (from 0.15), with internal management promotions exceeding 50% (>66% in FY25), high-potential leadership program application rates above 80%, and an employee Net Promoter Score (NPS) rising from 70 to 74.
HDIN Institutional Verdict: Strategic Narrative vs. Operational and Risk Reality
Management characterizes FY27 guidance as a high-visibility inflection—projecting +7% to +10% organic sales growth, +100 to +150 bps of Segment EBITA margin expansion, $5.30 to $5.60 in Adjusted Diluted EPS (on 600–610 million diluted shares), >100% FCF conversion, and ~$900 million in CapEx—underpinned by $23.0 billion in backlog and $29.3 billion in RPO (73% converting within 24 months). Cross-referencing this trajectory against Item 1A risk upgrades, restructuring footnotes, and contingent liabilities exposes three structural execution tests:
- Stranded Overhead & Workforce Friction vs. Margin Guidance: Achieving +100 to +150 bps of FY27 EBITA margin expansion requires eliminating the ~$150 million to $200 million in residual stranded corporate costs keeping FY26 Corporate Expense at 2.54% of sales (vs. 1.5%–1.8% at Trane Technologies and Carrier Global). Roughly $400 million of cash and non-cash restructuring execution remains across FY27–FY28; plant consolidations carry labor disruption risk given that ~24% of JCI's workforce is unionized.
- Lead-Time Compression, Hyperscaler Concentration, and Tariff Reconfiguration: Although no single customer exceeds 10% of sales, FY26 Item 1A introduced heightened warnings on hyperscale AI customer CapEx cyclicality, power interconnection and zoning delays (e.g., Northern Virginia and Ohio grid queues), emerging neocloud creditworthiness, potential insourcing of proprietary liquid cooling by tech giants, and long-qualification single-supplier bottlenecks for castings and semiconductors. Sustaining >37.0% gross margins requires compressing chiller lead times from 40+ weeks toward 24–30 weeks (tracked via WIP-to-finished-goods conversion), maintaining >85% change-order inflation pass-through (80%–90% metal recovery via indexation vs. 30–50 bps spot squeeze risk), and navigating post-February 2026 U.S. Supreme Court replacement tariffs and local-content manufacturing mandates alongside PwC's Critical Audit Matter focus on over-time cost-to-cost contract estimation.
- Long-Tail Contingencies & Pillar Two Cash Tax Drift: While JCI retired its $750 million water-systems AFFF settlement with a final $415 million payment in December 2024 and booked $149 million in FY26 insurance recoveries, the company still faces 51 AFFF class actions and 12,400+ personal injury lawsuits in the South Carolina MDL without reliable loss accruals, alongside a $163 million environmental remediation reserve (Marinette FTC and Stanton Street GETS over up to 20 years, down $24 million from $187 million), $401 million in discounted asbestos liabilities through 2068 ($341 million restricted trust assets, $60 million net exposure vs. $48 million in FY25), and $1,169 million in unrecognized tax benefit principal plus $476 million in accrued interest (~$1.8 billion total vs. ~$1.9 billion in FY25) under active IRS (FY17–FY20) and European/Mexican audits. Combined with OECD Pillar Two safe-harbor expirations over the next 2–3 years and cyber/agentic AI governance risks, medium-term cash conversion faces structural tax and litigation headwinds even as core industrial operations accelerate.
Key Financial Questions From the FY2026 Filing
What drove Johnson Controls' margin expansion and working capital efficiency in FY2026?
Segment EBITA margin expanded 144 bps to 18.42% ($4,728 million) as Services gross margin surged 379 bps to 44.08% ($7,965 million revenue) and SG&A dropped 296 bps to 21.47% of sales ($5,510 million) on $350 million in realized restructuring savings. Simultaneously, contract liabilities jumped 30.54% to $3,894 million on 20%–40% customer advance deposits, compressing the cash conversion cycle by 9.0 days to 48.0 days and lifting continuing operating cash flow 51.61% to $3,872 million.
How is Johnson Controls allocating capital across share buybacks, M&A, and FY2027 thermal capacity?
Across FY25–FY26, JCI deployed $7,496 million in share repurchases (130.37% of $5,750 million net divestiture proceeds, reducing diluted shares 9.62% to 611 million), paid $1,952 million in dividends, and reduced net debt 8.86% to $8,659 million while acquiring Alloy Enterprises and Nantum AI for $291 million in Q3 FY26. For FY27, management is doubling CapEx from $465 million to approximately $900 million (~3.2% of revenue) to expand chiller test stands and direct liquid cooling production lines to convert its $23.0 billion backlog.
What are the primary financial risks and residual stranded costs identified in the FY2026 10-K?
Unallocated corporate expenses declined 14.86% to $653 million (2.54% of sales) in FY26 but remain $163 million above the FY24 baseline ($490 million), prompting management to expand its restructuring plan from $400 million to $750 million to capture $1.1 billion in run-rate savings by FY28. Key off-balance-sheet and operational risks include 51 pending AFFF class actions and 12,400+ personal injury claims, $1,169 million in unrecognized tax benefit principal ($476 million interest), hyperscaler power-interconnection delays, and single-supplier lead-time bottlenecks.
Presentation Download & Analyst Briefing Access:
- Institutional Presentation: Download the full "Johnson_Controls_Strategic_Execution_Audit" PDF under the 'Related Topics' section.
- Analyst Video Briefing: Watch the "Johnson Controls (JCI) FY2026 10-K Audit: Can a 900M USD CapEx Bet Clear Its 23.0B USD AI Cooling Backlog?" on the HDIN Research YouTube Channel.
About HDIN Research:
HDIN Research is a premier global market intelligence and strategic advisory firm specializing in institutional-grade financial analysis, supply chain audits, and macroeconomic forecasting. Our dedicated sector analysts deliver actionable, data-driven insights tailored for private equity, hedge funds, and corporate strategy teams. Visit us at https://www.hdinresearch.com.
Editorial & Methodology Disclosure:
"This market intelligence brief was researched, modeled, and audited by the HDIN Research Equity Desk based on official primary corporate filings (Johnson Controls International plc FY2025 and FY2026 Form 10-K). Proprietary quantitative extraction tools were utilized to ensure 100% fidelity to reported financial line items and footnotes. All forensic interpretations, segmental benchmarks, and institutional verdicts were independently written and verified by HDIN senior sector analysts in accordance with institutional research standards."
HDIN Executive Takeaways
1. Margin & Backlog Inflection: FY26 continuing sales rose 8.77% to $25,666M, lifting Segment EBITA margin 144 bps to 18.42% ($4,728M) as data center orders pushed backlog up 43% to $23.0B.
2. Capex & Footprint Pivot: Management is doubling FY27 CapEx to ~$900M across 24M sq ft globally, integrating $291M liquid cooling M&A and expanding restructuring to $750M ($1.1B run-rate savings).
3. Institutional Verdict: Contract liabilities surged 30.54% to $3,894M, cutting CCC 9 days to 48.0 days and fueling 118.30% FCF conversion, despite ~$150M–$200M lingering corporate stranded costs.
Figure Johnson Controls International (JCl) FY2025-FY2026 Strategic Pivot & Executive Financial Audit
Johnson Controls FY26 Segmental Revenue, Margin Expansion, and Quality of EarningsJohnson Controls International plc [NYSE: JCI] generated $25,666 million in continuing operations net sales in FY26, up 8.77% reported (+8.42% organic) from $23,596 million in FY25, while continuing net income attributable to JCI shareholders rose 67.34% to $2,880 million (11.22% net margin, +393 bps) and continuing diluted EPS expanded 79.47% to $4.72. Following the July 31, 2025 divestiture of its Residential and Light Commercial HVAC (R&LC HVAC) business to Robert Bosch GmbH for $5,600 million in net cash proceeds and the earlier divestiture of Air Distribution Technologies (ADTi, releasing ~$345 million cash in FY25), Johnson Controls completed its operational transition into a pure-play commercial building solutions and mission-critical thermal management company.
Table Johnson Controls FY2025 vs. FY2026 Consolidated Continuing Operations Performance ($ Millions, except EPS)
| Financial Metric | FY2025 | FY2026 | YoY Change ($) | YoY Change (% / bps) | Filing Reference |
| Products and Systems Revenue | $16,124 | $17,701 | +$1,577 | +9.78% (+9% org) | FY26 10-K Item 8 |
| Services Revenue | $7,472 | $7,965 | +$493 | +6.60% (+8% org) | FY26 10-K Item 8 |
| Total Net Sales (Continuing Ops) | $23,596 | $25,666 | +$2,070 | +8.77% (+8.4% org) | FY26 10-K Item 7 |
| Cost of Sales | $15,004 | $16,151 | +$1,147 | +7.64% | FY26 10-K Item 8 |
| Gross Profit | $8,592 | $9,515 | +$923 | +10.74% | FY26 10-K Item 7 |
| Gross Margin (%) | 36.41% | 37.07% | — | +66 bps (+70 bps rep.) | FY26 10-K Item 7 |
| Selling, General & Administrative (SG&A) | $5,764 | $5,510 | -$254 | -4.41% | FY26 10-K Item 7 |
| SG&A as % of Sales | 24.43% | 21.47% | — | -296 bps (-290 bps rep.) | FY26 10-K Item 7 |
| Research & Development (Included in SG&A) | $273 | $265 | -$8 | -2.93% (-13 bps to 1.03%) | FY26 10-K Note 1 |
| Restructuring and Impairment Charges | $546 | $311 | -$235 | -43.04% | FY26 10-K Note 15 |
| Operating Income (GAAP EBIT) | $2,282 | $3,694 | +$1,412 | +61.88% (+472 bps) | Computed, Item 8 |
| Net Financing Charges | $319 | $279 | -$40 | -12.54% | FY26 10-K Note 9 |
| Equity Income | $6 | $11 | +$5 | +83.33% | FY26 10-K Item 8 |
| Pre-Tax Income (Continuing Ops) | $1,969 | $3,426 | +$1,457 | +74.00% | FY26 10-K Item 7 |
| Income Tax Provision | $245 | $536 | +$291 | +118.78% | FY26 10-K Note 16 |
| Effective Tax Rate (GAAP) | 12.44% | 15.65% | — | +321 bps (+400 bps rep.) | FY26 10-K Item 7 |
| Continuing Net Income (Total / JCI Share) | $1,724 / $1,721 | $2,890 / $2,880 | +
1,159 |
+67.63% / +67.34% | FY26 10-K Item 8 |
| Noncontrolling Interests (Continuing) | $3 | $10 | +$7 | +233.33% | FY26 10-K Item 8 |
| Discontinued Operations, Net of Tax | $1,570 | $(27) | -$1,597 | -101.72% | FY26 10-K Note 2 |
| Total Net Income Attributable to JCI | $3,291 | $2,853 | -$438 | -13.31% | FY26 10-K Item 8 |
| Diluted EPS — Continuing Ops | $2.63 | $4.72 | +$2.09 | +79.47% | FY26 10-K Item 8 |
| Diluted EPS — Discontinued Ops / Total | $2.40 / $5.03 | $(0.04) / $4.68 | -
0.35 |
-101.67% / -6.96% | FY26 10-K Item 8 |
Table Johnson Controls FY2025 vs. FY2026 Regional Segment Revenue, EBITA, Orders, and Backlog ($ Millions / Billions)
| Regional Segment | Net Sales FY25 ($M) | Net Sales FY26 ($M) | YoY Rep. / Org. | Segment EBITA FY25 ($M) | Segment EBITA FY26 ($M) | EBITA Margin FY25 / FY26 (bps Δ) | Orders FY25 / FY26 ($B, Org %) | Ending Backlog FY25 / FY26 ($B, Org %) |
| Americas | $15,831 | $17,398 | +9.90% / +10% | $2,882 | $3,397 | 18.20% / 19.53% (+133 bps) | $13.7B / $21.6B (+48%) | $10.6B / $17.8B (+54%) |
| EMEA | $4,968 | $5,119 | +3.04% / +2% | $649 | $728 | 13.06% / 14.22% (+116 bps) | $4.4B / $5.1B (+9%) | $2.5B / $3.1B (+18%) |
| APAC | $2,797 | $3,149 | +12.58% / +12% | $476 | $603 | 17.02% / 19.15% (+213 bps) | $2.6B / $3.0B (+10%) | $1.8B / $2.1B (+12%) |
| Total Segments | $23,596 | $25,666 | +8.77% / +8% | $4,007 | $4,728 | 16.98% / 18.42% (+144 bps) | $20.7B / $29.7B (+35%) | $16.6B* / $23.0B (+43%) |
By revenue stream, Services represented 31.03% of FY26 sales ($7,965 million vs. $7,472 million or 31.67% in FY25) while delivering a 44.08% gross margin (+379 bps YoY from 40.29%) as service cost of sales fell $7 million from $4,461 million to $4,454 million. Products and Systems revenue grew 9.78% to $17,701 million (68.97% of sales vs. 68.33% in FY25), with cost of sales rising from $10,543 million to $11,697 million and gross margin compressing 69 bps from 34.61% to 33.92%, leaving a 1,016 bps gross margin spread in favor of Services.
Table Johnson Controls FY2025 vs. FY2026 GAAP Pre-Tax Income to Non-GAAP Segment EBITA Reconciliation ($ Millions)
| Reconciliation Line Item | FY2025 | FY2026 | YoY Variance ($) | Quality of Earnings (QoE) Audit Assessment |
| Pre-Tax Income from Continuing Operations (GAAP) | $1,969 | $3,426 | +$1,457 | Baseline US GAAP continuing pre-tax profit |
| (+) Unallocated Corporate Expenses | $767 | $653 | -$114 | Stranded overhead reduced 14.86% YoY |
| (+) Restructuring & Impairment Costs | $546 | $311 | -$235 | FY26: $190M restructuring + $121M impairment |
| (-) Water Systems AFFF Insurance Recoveries | $(39) | $(149) | -$110 | Non-operating environmental insurance recoveries in SG&A |
| (+) Net Financing Charges | $319 | $279 | -$40 | Lower net debt; short-term rate fell from 4.5% to 3.9% |
| (-)/(+) Net Gain / (Loss) on Divestitures | $0 | $(70) | -$70 | Pre-tax gain on ADT Mexico sale recorded in SG&A |
| (+)/(-) Net Mark-to-Market Adjustments | $6 | $(73) | -$79 | Non-operating pension and asbestos trust MTM gains |
| Segment EBIT (Subtotal) | $3,568 | $4,377 | +$809 | Operating income including acquisition amortization |
| (+) Amortization of Intangible Assets | $439 | $351 | -$88 | Definite-lived acquisition intangibles |
| Segment EBITA (Non-GAAP) | $4,007 | $4,728 | +$721 | +17.99% YoY core operating cash-earnings proxy |
Non-cash impairment charges declined 68.32% from $382 million in FY25 ($206 million goodwill/intangibles and $176 million long-lived assets, including $156 million in Americas Retail and $184 million in EMEA Subscriber) to $121 million in FY26 ($38 million goodwill/intangibles and $83 million long-lived assets, including a $50 million impairment on ADT Spain prior to its $98 million closing).
Unallocated corporate expenses peaked at $767 million in FY25 (3.25% of sales, +112 bps from FY24) due to Transition Services Agreement (TSA) and dual-system carve-out friction, before falling 14.86% ($114 million) to $653 million in FY26 (2.54% of sales, -71 bps). Against the FY23 ($429 million, 1.92% of $22,331 million sales) and FY24 ($490 million, 2.13% of $22,952 million sales) pre-divestiture baselines, FY26 corporate overhead remains $163 million above FY24 levels, indicating ~$150 million to $200 million of residual stranded costs. Consequently, management expanded its Q4 FY24 $400 million restructuring program (originally targeting $500 million in annual savings) by $350 million in Q4 FY26 to $750 million through FY28, targeting $1,100 million ($1.1 billion) in run-rate annual savings (+120%).
Working capital dynamics further confirm commercial pricing leverage. Under ASC 606 over-time cost-to-cost accounting, JCI expanded contract liabilities by 30.54% (+$911 million) to $3,894 million while limiting contract asset growth to 5.32% (+$79 million), widening net customer funding to $2,329 million (+55.58%) through 20%–40% non-refundable production slot deposits. Simultaneously, the Cash Conversion Cycle (CCC) improved by 9.0 days from 57.0 days to 48.0 days, while remaining performance obligations (RPO) rose 29.07% to $29.3 billion (73% or ~$21.39 billion convertible within 24 months, up from 63% or ~$14.3 billion of $22.7 billion RPO in FY25; 27% or ~$7.91 billion spanning 25–35 year lifecycle contracts).
Balance sheet leverage contracted alongside capital returns. Gross debt declined 6.10% from $9,880 million to $9,277 million ($678 million short-term debt, $1,066 million current long-term debt, $7,533 million long-term debt vs. $723 million, $566 million, $8,591 million in FY25), while cash rose 63.06% from $379 million to $618 million, lowering net debt 8.86% from $9,501 million to $8,659 million. Net debt-to-net capitalization improved 350 bps from 42.4% to 38.9% (total debt-to-total capitalization fell 280 bps from 43.3% to 40.5% on $13,611 million JCI equity / $13,646 million total equity). Principal debt maturities ($8,631 million total) are well laddered: $1,066 million in FY27 (EURIBOR+0.75% $283M, €500M 0.375% $567M, TORF+0.40% Yen $191M), $681 million in FY28 (€600M 3.000%), $700 million in FY29 (5.500%), $625 million in FY30 (1.750%), $500 million in FY31 (2.000% SLN), and $5,059 million maturing through 2064, backed by an undrawn $2.5 billion revolver (maturing December 2028) and BBB+ (S&P) / Baa1 (Moody's) ratings.
On global tax and treasury risk, JCI's GAAP effective tax rate increased from 12.44% in FY25 to 15.65% in FY26 (Adjusted ETR ~13.0% to ~14.5%) against Ireland's 12.5% statutory corporate rate, while cash taxes paid rose 8.09% from $606 million to $655 million (following $1,400 million paid in FY25 for R&LC operations and divestiture). Under OECD Pillar Two (enacted via Ireland's Finance (No. 2) Bill 2023 on December 18, 2023, effective FY25; Schaffhausen, Switzerland's 15% IMTM rate effective January 1, 2024 yielded an $80 million discrete FY24 deferred tax benefit), FY25–FY26 impacts were immaterial, though management indefinitely reinvests $23.9 billion of foreign outside basis differences (up from $22.7 billion in FY25). Corporate Treasury hedges 70%–90% of net FX transaction exposures and maintains €2.9 billion in EUR net investment hedges ($3.3 billion fair value in FY26, yielding $129 million CTA pre-tax gain after settling ¥30 billion JPY hedges post-Hitachi).
Global Thermal Infrastructure Footprint, FY27 CapEx Doubling, and Regional Moats
To convert its record $23.0 billion backlog and address hyperscale AI rack power densities shifting from 5–10 kW (15–20 kW air-cooling ceiling) to 40–100 kW+, Johnson Controls operates approximately 24 million square feet of real estate across nearly 60 countries (7 million sq ft owned, 17 million sq ft leased in FY26, up 1 million sq ft from 23 million sq ft—6 million owned, 17 million leased—in FY25), anchored by its statutory headquarters at One Albert Quay, Cork, Ireland (T12 X8N6) and North American operational headquarters in Milwaukee, Wisconsin. Management is doubling FY27 capital expenditures from $465 million (1.81% of sales) in FY26 to approximately $900 million (~3.2% of projected sales) to expand global thermal management chiller test stands, compressor lines, and liquid cooling capacity under an "In-Region, For-Region" manufacturing model.
- Americas Manufacturing & Liquid Cooling Core: Large-tonnage YORK® centrifugal and screw chillers are built in York, Pennsylvania, alongside specialty fire suppression systems at Marinette, Wisconsin (including the Stanton Street site), additional plants in Texas, California, and Mexico, Silent-Aire® prefabricated modular data center integration in Edmonton, Alberta, Canada (cutting construction timelines by 30%–50%), and Alloy Enterprises microchannel direct-to-chip cold plate and Coolant Distribution Unit (CDU) production following the $291 million Q3 FY26 acquisition of Alloy Enterprises and Nantum AI ($181 million goodwill, $127 million technology intangibles).
- EMEA Industrial Heat Pump & Decarbonization Network: Anchored by Sabroe® industrial refrigeration and high-temperature heat pump facilities in Hornslet, Denmark, plus commercial HVAC, controls, and valve R&D hubs in Germany, the United Kingdom, Italy, and France serving FLAP-D data center corridors and EU Energy Efficiency Directive (EED), EU Heat Transition, and Energy Performance of Buildings Directive (EPBD) mandates.
- APAC High-Elasticity Production Hub: Centered on Wuxi, China—one of the company's largest global centrifugal chiller manufacturing and test centers—and the Shanghai APAC headquarters and R&D center, supported by direct operations in Japan, Singapore, Australia, South Korea, and a Greater China commercial network spanning the Chinese Mainland, Hong Kong SAR, Macao SAR, and Taiwan, Province of China.
Research and development expenditure totaled $265 million in FY26 (1.03% of sales, 4.81% of SG&A) versus $273 million in FY25 (1.16% of sales, 4.74% of SG&A) and $267 million in FY24 (1.16% of sales, 4.72% of SG&A). Rather than incurring material standalone regulatory CapEx for low-GWP refrigerant mandates (U.S. EPA AIM Act requiring a 70% HFC phase-down by 2029 and GWP <700, alongside EU F-Gas rules), JCI embeds R-454B and R-1234ze (A2L) thermal redesigns directly into ongoing R&D, supporting structural ASP premiums on YORK® YVAM oil-free magnetic-bearing chillers (delivering PUE <1.15) and retrofit demand across its installed base. Paired with Metasys® building automation, PENN® controls, OpenBlue® cloud AI optimization (enhanced by Nantum AI), and non-fluorinated Ansul® / Simplex® / Grinnell® fire suppression (SAPPHIRE and Inergen clean agents), JCI maintains an end-to-end integration moat against single-domain rivals including Trane Technologies, Carrier Global, Daikin Industries, Siemens, Schneider Electric, Honeywell, Vertiv Holdings, and API Group. This technical integration is reinforced by ~84,000 employees (31,000 U.S., 53,000 international) operating a direct service channel that lowers OSHA Total Recordable Incident Rate (TRIR) to 0.31 (from 0.34 in FY25) and Lost Time Incident Rate (LTIR) to 0.13 (from 0.15), with internal management promotions exceeding 50% (>66% in FY25), high-potential leadership program application rates above 80%, and an employee Net Promoter Score (NPS) rising from 70 to 74.
HDIN Institutional Verdict: Strategic Narrative vs. Operational and Risk Reality
Management characterizes FY27 guidance as a high-visibility inflection—projecting +7% to +10% organic sales growth, +100 to +150 bps of Segment EBITA margin expansion, $5.30 to $5.60 in Adjusted Diluted EPS (on 600–610 million diluted shares), >100% FCF conversion, and ~$900 million in CapEx—underpinned by $23.0 billion in backlog and $29.3 billion in RPO (73% converting within 24 months). Cross-referencing this trajectory against Item 1A risk upgrades, restructuring footnotes, and contingent liabilities exposes three structural execution tests:
- Stranded Overhead & Workforce Friction vs. Margin Guidance: Achieving +100 to +150 bps of FY27 EBITA margin expansion requires eliminating the ~$150 million to $200 million in residual stranded corporate costs keeping FY26 Corporate Expense at 2.54% of sales (vs. 1.5%–1.8% at Trane Technologies and Carrier Global). Roughly $400 million of cash and non-cash restructuring execution remains across FY27–FY28; plant consolidations carry labor disruption risk given that ~24% of JCI's workforce is unionized.
- Lead-Time Compression, Hyperscaler Concentration, and Tariff Reconfiguration: Although no single customer exceeds 10% of sales, FY26 Item 1A introduced heightened warnings on hyperscale AI customer CapEx cyclicality, power interconnection and zoning delays (e.g., Northern Virginia and Ohio grid queues), emerging neocloud creditworthiness, potential insourcing of proprietary liquid cooling by tech giants, and long-qualification single-supplier bottlenecks for castings and semiconductors. Sustaining >37.0% gross margins requires compressing chiller lead times from 40+ weeks toward 24–30 weeks (tracked via WIP-to-finished-goods conversion), maintaining >85% change-order inflation pass-through (80%–90% metal recovery via indexation vs. 30–50 bps spot squeeze risk), and navigating post-February 2026 U.S. Supreme Court replacement tariffs and local-content manufacturing mandates alongside PwC's Critical Audit Matter focus on over-time cost-to-cost contract estimation.
- Long-Tail Contingencies & Pillar Two Cash Tax Drift: While JCI retired its $750 million water-systems AFFF settlement with a final $415 million payment in December 2024 and booked $149 million in FY26 insurance recoveries, the company still faces 51 AFFF class actions and 12,400+ personal injury lawsuits in the South Carolina MDL without reliable loss accruals, alongside a $163 million environmental remediation reserve (Marinette FTC and Stanton Street GETS over up to 20 years, down $24 million from $187 million), $401 million in discounted asbestos liabilities through 2068 ($341 million restricted trust assets, $60 million net exposure vs. $48 million in FY25), and $1,169 million in unrecognized tax benefit principal plus $476 million in accrued interest (~$1.8 billion total vs. ~$1.9 billion in FY25) under active IRS (FY17–FY20) and European/Mexican audits. Combined with OECD Pillar Two safe-harbor expirations over the next 2–3 years and cyber/agentic AI governance risks, medium-term cash conversion faces structural tax and litigation headwinds even as core industrial operations accelerate.
Key Financial Questions From the FY2026 Filing
What drove Johnson Controls' margin expansion and working capital efficiency in FY2026?
Segment EBITA margin expanded 144 bps to 18.42% ($4,728 million) as Services gross margin surged 379 bps to 44.08% ($7,965 million revenue) and SG&A dropped 296 bps to 21.47% of sales ($5,510 million) on $350 million in realized restructuring savings. Simultaneously, contract liabilities jumped 30.54% to $3,894 million on 20%–40% customer advance deposits, compressing the cash conversion cycle by 9.0 days to 48.0 days and lifting continuing operating cash flow 51.61% to $3,872 million.
How is Johnson Controls allocating capital across share buybacks, M&A, and FY2027 thermal capacity?
Across FY25–FY26, JCI deployed $7,496 million in share repurchases (130.37% of $5,750 million net divestiture proceeds, reducing diluted shares 9.62% to 611 million), paid $1,952 million in dividends, and reduced net debt 8.86% to $8,659 million while acquiring Alloy Enterprises and Nantum AI for $291 million in Q3 FY26. For FY27, management is doubling CapEx from $465 million to approximately $900 million (~3.2% of revenue) to expand chiller test stands and direct liquid cooling production lines to convert its $23.0 billion backlog.
What are the primary financial risks and residual stranded costs identified in the FY2026 10-K?
Unallocated corporate expenses declined 14.86% to $653 million (2.54% of sales) in FY26 but remain $163 million above the FY24 baseline ($490 million), prompting management to expand its restructuring plan from $400 million to $750 million to capture $1.1 billion in run-rate savings by FY28. Key off-balance-sheet and operational risks include 51 pending AFFF class actions and 12,400+ personal injury claims, $1,169 million in unrecognized tax benefit principal ($476 million interest), hyperscaler power-interconnection delays, and single-supplier lead-time bottlenecks.
Presentation Download & Analyst Briefing Access:
- Institutional Presentation: Download the full "Johnson_Controls_Strategic_Execution_Audit" PDF under the 'Related Topics' section.
- Analyst Video Briefing: Watch the "Johnson Controls (JCI) FY2026 10-K Audit: Can a 900M USD CapEx Bet Clear Its 23.0B USD AI Cooling Backlog?" on the HDIN Research YouTube Channel.
About HDIN Research:
HDIN Research is a premier global market intelligence and strategic advisory firm specializing in institutional-grade financial analysis, supply chain audits, and macroeconomic forecasting. Our dedicated sector analysts deliver actionable, data-driven insights tailored for private equity, hedge funds, and corporate strategy teams. Visit us at https://www.hdinresearch.com.
Editorial & Methodology Disclosure:
"This market intelligence brief was researched, modeled, and audited by the HDIN Research Equity Desk based on official primary corporate filings (Johnson Controls International plc FY2025 and FY2026 Form 10-K). Proprietary quantitative extraction tools were utilized to ensure 100% fidelity to reported financial line items and footnotes. All forensic interpretations, segmental benchmarks, and institutional verdicts were independently written and verified by HDIN senior sector analysts in accordance with institutional research standards."