Berry Inc. FY26 IPO Analysis: 75.2% Margin & 53% Share | HDIN
Date : 2026-11-16
Reading : 133
BEIJING — HDIN Market Intelligence Brief | Audited by HDIN Equity Research Desk | Source Filing: Tokyo Stock Exchange Growth Market IPO Prospectus (Securities Registration Statement Part I / FY2022–Q1 FY2027)
HDIN Executive Takeaways
1. Margin & Volume Expansion: Berry Inc. [TSE Growth: 7360 / IPO Filing] expanded FY26 revenue 57.0% YoY to JPY 1,369,588 thousand and operating profit 97.0% YoY to JPY 310,381 thousand (22.7% margin), driven by 6,774 `baby band` shipments (53% domestic share) and a +3,470 bps four-year gross margin expansion to 75.2% (78.0% in Q1 FY27).
2. Capital Efficiency & Footprint: Operating from a single leased facility in Taito-ku, Tokyo (CapEx/Revenue at 3.71%), Berry achieved a 44.8% ROE, 1.22-month clinic payback across 327 Japanese medical facilities, and July 2026 regulatory clearance in the Republic of Korea.
3. Institutional Verdict: Exceptional unit economics (80.4% contribution margin) and 85.02% insider voting control are tempered by a 99.2% single-product reliance, Japan’s 671,000 birth-rate ceiling, and an unresolved competitor patent and trade-secret claim.
Figure Berry Inc IPO Executive Analysis 5-Year Trajectory & Strategic Milestone Blueprint
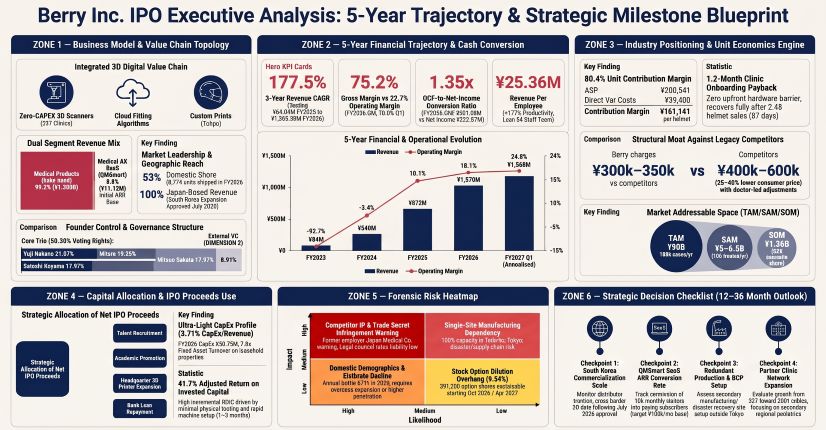
Berry Inc. FY26 Financial Performance, Segmental Unit Economics, and Forensic Audit
Berry Inc. [TSE Growth: 7360 / IPO Filing] reported top-line revenue of JPY 1,369,588 thousand (+57.0% YoY; 3-year CAGR of 177.5%) and bottom-line net income of JPY 223,566 thousand (16.3% net margin, +60.1% YoY) in its 5th fiscal term ended May 31, 2026 (FY26), followed by Q1 FY27 (ended August 31, 2026) revenue of JPY 391,876 thousand and net income of JPY 67,911 thousand (17.3% net margin). Prepared under Japanese GAAP (J-GAAP) on a standalone basis—as the company maintains zero subsidiaries, parent entities, or affiliates—the financial statements for FY25 (4th Term) and FY26 (5th Term) received unqualified audit opinions from Izumi Audit Corporation under Article 193-2, Paragraph 1 of the Financial Instruments and Exchange Act, while Q1 FY27 (6th Term Q1) received an unqualified interim review and FY22–FY24 (Terms 1–3) were compiled under the Companies Act Calculation Rules.
Table Multi-Year Financial Evolution and DuPont Working Capital Metrics
DuPont decomposition confirms that Berry’s 44.8% ROE in FY26 is generated organically through a 16.3% net profit margin and a 1.75x total asset turnover rather than financial leverage (equity multiplier of 1.52x). At FY26 year-end, cash and deposits stood at JPY 492,640 thousand against total interest-bearing debt of JPY 72,624 thousand (comprising JPY 70,176 thousand in long-term borrowings—of which JPY 6,996 thousand is due within one year—sourced primarily from Japan Finance Corporation at ~JPY 50,000 thousand with a 0.8% weighted average interest rate and Mizuho Bank at ~JPY 13,180 thousand, alongside JPY 2,448 thousand in lease obligations, of which JPY 580 thousand is current), yielding a net cash position of JPY 420,016 thousand (net debt of -JPY 420 million) and covering current liabilities (~JPY 254 million) by 2.51x on a quick ratio basis. After executing a JPY 177,435 thousand (94.7%) capital reduction in May 2024 to eliminate FY24 accumulated deficits of JPY 17,369 thousand, retained earnings accumulated to JPY 346 million by the end of FY26.
Segmental Operations, Price-Volume Mix, and Unit Economics
Berry operates under a single reporting segment, the Medical Innovation Business, divided into two operational domains: the Medical Product Domain (custom 3D-printed infant cranial remolding orthoses under the `baby band` series: `baby band` 1st generation, `baby band 2`, and `baby band 3`, alongside 3D head-scanning hardware, a hospital treatment management platform, and a patient follow-up recording app) and the Medical AX Domain (the `QMSmart` cloud electronic quality management system [eQMS] launched commercially in July 2025, supported by the `Yakuji Joho Navi` regulatory portal launched in October 2024).
Table Revenue Growth, Product Sales, Distribution Network, and Market Penetration by Fiscal Period (FY2025–Q1 FY2027)
Because `baby band` helmets are custom-manufactured per infant 3D scan, production volume and order volume match sales volume at nearly 100%, resulting in zero order backlog and an inventory turnover cycle (DIO) of 18.9 days in FY26. Total FY26 ending inventory was JPY 20,822 thousand, consisting of JPY 13,962 thousand in raw materials (JPY 3,450 thousand in 3D printing resin filament and JPY 10,511 thousand in natural fiber skin-friendly interior cushions, accounted for via FIFO), JPY 3,680 thousand in work-in-progress (individual cost method), and JPY 3,180 thousand in supplies.
Within SG&A (JPY 719,742 thousand in FY26), total personnel costs of JPY 232,545 thousand comprised JPY 83,895 thousand in directors' compensation, JPY 137,266 thousand in employee salaries and allowances, and JPY 11,384 thousand in bonus provisions. With total fixed costs of ~JPY 756 million (JPY 137.4 million in fixed manufacturing overhead plus JPY 619.0 million in non-advertising SG&A) and a company-wide contribution margin ratio of 75.2%, Berry’s FY26 static break-even point (BEP) is JPY 1,005 million in revenue (~5,012 helmets), providing a 26.6% safety margin against actual FY26 revenue. At the clinic level, Berry provides its proprietary portable 3D scanner (~JPY 250,000 hardware cost) and onboarding/training (~JPY 150,000) free of charge to partner clinics; this JPY 400,000 upfront customer acquisition cost (CAC) is recovered after 2.48 helmet shipments, equating to a payback period of 1.22 months (~37 days) at the FY26 average clinic shipment rate of 2.04 units per month.
Forensic Accounting Audit and Core Operating Profit Walk
A forensic audit of Berry’s financial footnotes confirms Tier-1 earnings quality with zero off-balance-sheet liabilities, zero capitalized software or R&D expenses, zero goodwill (のれん), and zero fixed-asset impairment losses. Under Accounting Standard for Revenue Recognition (ASBJ Statement No. 29), hardware revenue is recognized strictly upon hospital inspection and acceptance rather than upon shipment, preventing channel stuffing, while `QMSmart` SaaS revenue is recognized ratably over the contract period. In FY26, accounts receivable increased 56.9% YoY (from JPY 91,945 thousand to JPY 144,222 thousand, and JPY 151,643 thousand in Q1 FY27), matching the +57.0% YoY revenue growth within 10 bps. Gross receivable billings (including consumption tax) totaled JPY 1,525,662 thousand in FY26 with cash collections of JPY 1,473,385 thousand (a 91.1% collection rate and a 28.0-day statutory collection period), with zero allowance for doubtful accounts required.
R&D expenses—totaling JPY 20,363 thousand in FY25 (2.3% of revenue), JPY 14,084 thousand in FY26 (1.0% of revenue), and JPY 3,038 thousand in Q1 FY27—were 100% expensed within SG&A. COGS in FY26 included a routine JPY 5,391 thousand inventory valuation loss. Depreciation methods remained unchanged across all vijf fiscal terms: straight-line method for buildings (8–15 years) and declining-balance method for machinery/equipment (3–8 years) and tools/fixtures (3–15 years). Operating cash flow in FY26 (JPY 301,001 thousand, 1.35x net income) was derived from pre-tax profit of JPY 314,347 thousand plus JPY 60,550 thousand in D&A (subtotal JPY 347,731 thousand), adjusted for working capital shifts (AR increase of -JPY 52,277 thousand, inventory increase of -JPY 3,642 thousand, unpaid corporate tax increase of +JPY 55,563 thousand, and contract liabilities increase of +JPY 8,796 thousand) less JPY 46,326 thousand in income taxes paid. Related-party disclosures confirm zero officer loans, zero related-party property leases, and zero related-party trade; the sole related-party transaction is a personal joint debt guarantee provided by founder and CEO Yuji Nakano on bank borrowings (outstanding balance of JPY 27,172 thousand in FY25 and JPY 20,176 thousand in FY26, with JPY 0 guarantee fee paid).
Motoasakusa Single-Site Infrastructure, Capex Intensity, and 90 Billion Yen TAM Moat
Berry operates an all-in-one, single-site headquarters, R&D center, 3D data processing hub, and additive manufacturing factory at 2-7-1 Motoasakusa, Taito-ku, Tokyo (Sumitomo Realty Motoasakusa Building), leased from independent third party Sumitomo Realty & Development Co., Ltd.. Following initial relocation from Jinnan, Shibuya-ku in May 2024 and an in-building floor expansion in May 2025, annual rent totaled JPY 57,458 thousand in FY26, with lease deposits rising from JPY 58,763 thousand at the end of FY26 to JPY 93,995 thousand (+JPY 35,232 thousand) in Q1 FY27. The facility holds a Type 2 Medical Device Marketing License from the Governor of Tokyo (valid through January 5, 2027) and a Medical Device Manufacturing Registration (valid through December 6, 2028), alongside ISO 13485 (acquired December 2024) and ISO/IEC 27001:2022 (acquired March 2025) certifications.
Historical capital expenditure demonstrates an asset-light trajectory: after spending JPY 124,036 thousand (cash basis; 14.22% of revenue, 1.96x D&A) in FY25 for the Motoasakusa HQ build-out, CapEx declined to JPY 50,745 thousand on an accrual basis (JPY 64,294 thousand cash basis) in FY26—representing 3.71% of revenue (4.70% cash basis) and 0.84x D&A (1.06x cash basis)—and JPY 12,187 thousand in Q1 FY27 (3.11% of revenue, 0.92x D&A). In FY26, Berry generated JPY 220,681 thousand in NOPAT (operating profit of JPY 310,381 thousand taxed at the 28.9% effective rate); against total invested capital of JPY 683,919 thousand (net assets of JPY 611,295 thousand plus interest-bearing debt of JPY 72,624 thousand), static ROIC reached 32.3% (41.7% terminal standard), and 115.4% when excluding JPY 492,640 thousand in excess cash (operating invested capital of JPY 191,279 thousand). Because industrial 3D printers require only 1–3 months from procurement to cloud integration, IPO proceeds—earmarked for (1) recruiting R&D, regulatory, and `QMSmart` sales personnel, (2) medical academic advertising, (3) Motoasakusa factory expansion and 3D printer/scanner CapEx, and (4) repaying the JPY 72,624 thousand in debt—will add less than 150 bps in incremental depreciation burden even if annual equipment CapEx doubles to JPY 100 million.
Supply Chain Concentration, Customer Dispersion, and Geographic Footprint
Berry’s upstream supply chain exhibits minimal concentration risk. Total raw material purchases of JPY 30,794 thousand in FY26 represented 2.25% of revenue (a 50% raw material price spike would compress gross margin by only 110 bps, from 75.2% to 74.1%). Key suppliers include Softpren Industry Corporation (cushion materials), Seiko Packing Co., Ltd., and IT engineering dispatch firm Levtech Co., Ltd. (ending accounts payable of JPY 2,176 thousand out of total company accounts payable of JPY 6,431 thousand).
On the downstream side, no single customer accounted for 10% or more of revenue across FY25, FY26, or Q1 FY27, with the largest single medical institution estimated at less than 2.5%–3.0% of total sales (~150–200 helmets or JPY 30–40 million annually).
Geographically, in strict accordance with United Nations geographic naming standards and statutory footnote disclosures, 100.0% of Berry’s revenue and 100.0% of its tangible fixed assets in FY25 (JPY 872,476 thousand), FY26 (JPY 1,369,588 thousand), and Q1 FY27 (JPY 391,876 thousand) were located in Japan. Overseas revenue was 0.0% (JPY 0), including 0.0% in the Republic of Korea (where `baby band 3` obtained medical device certification in July 2026 ahead of commercial launch), 0.0% in Mainland China, 0.0% in Hong Kong, China, and 0.0% in Taiwan, Province of China / Taiwan, China.
Table Market Sizing (TAM/SAM/SOM) and Competitive Benchmarking
HDIN Institutional Verdict: Japan Medical Company Spin-Out DNA vs. Litigation and Demographic Realities
Berry’s operational velocity—achieving three generations of Class II medical device approvals between April 2022 and March 2023 and capturing 53% domestic market share within five years of its July 2021 founding—is directly attributable to its founding team’s prior executive tenure at domestic cranial helmet pioneer Japan Medical Company. However, this exact organizational pedigree is the catalyst for Berry’s most acute legal overhang.
Executive Leadership, Governance Matrix, and Shareholding Structure
Berry’s corporate governance comprises a 6-member Board of Directors (4 internal executive directors and 2 independent outside directors = 33.3% independence; convened 14 times in FY26 with 100% attendance), a 3-member Audit & Supervisory Board (100% independent outside auditors; convened 16 times in FY26 with 100% attendance), and a Voluntary Compensation Committee chaired by CEO Yuji Nakano alongside outside directors Hiroyuki Saeki and Soshi Matsumoto. In FY26, 100% of officer compensation was fixed base pay (zero performance-linked cash bonuses and zero retirement benefit provisions): 4 internal directors received a combined JPY 64,479 thousand (average ~JPY 16.12 million), 2 outside directors received JPY 8,100 thousand, and 3 outside auditors received JPY 11,316 thousand.
Beyond the founding trio (58.30% combined diluted voting power) and Soshi Matsumoto’s bloc (26.72%), who together lock up 85.02% of total voting rights, external shareholders consist of lead venture capital fund DIMENSION No. 2 Investment LPS (400,000 common shares; 8.91% diluted / 9.76% issued common; invested JPY 200,000 thousand at JPY 500/share), angel advisor Tsuyoshi Nishimoto (80,000 common shares; 1.78% diluted / 1.95% issued common; invested JPY 20,000 thousand at JPY 250/share), and 28 core employees/advisors holding 116,200–117,200 option shares (2.59%–2.61%), bringing total fully diluted shares to 4,491,200 (4,100,000 issued common shares plus 391,200 option shares).
Berry has issued two series of stock options under Articles 236, 238, and 239 of the Companies Act, totaling 391,200 shares (9.54% dilution relative to 4,100,000 issued shares; 8.71% of 4,491,200 fully diluted shares). Both series carry a split-adjusted exercise price of JPY 500 per share (valued via weighted DCF and Net Asset methods), require the company’s stock to be listed on a Japanese exchange prior to exercise, require continuous employment/board service at exercise, and prohibit transfer or partial exercise:
* 1st Series Stock Options: Resolved at the September 27, 2024 EGM and October 15, 2024 Board meeting (granted November 15, 2024). Comprises 581 active units (583 initial, 2 forfeited) representing 232,400 common shares (240,000 initial), exercisable from October 16, 2026 to October 15, 2034. Allocated to 3 internal directors (86,400 shares: Nakano 86,400, Sakata 44,800) and 20/29 employees (146,000 shares, including Masahiko Furukado 8,000 and other staff 93,200).
* 2nd Series Stock Options: Authorized under the September 27, 2021 EGM framework and resolved at the April 14, 2025 Board meeting (granted May 15, 2025). Comprises 397 active units (400 initial, 3 forfeited) representing 158,800 common shares (162,000 initial), exercisable from April 15, 2027 to April 14, 2035. Allocated to 4 internal directors (89,600 shares: Nakano 60,000 [total Nakano options adjusted to 146,100], Sakata 20,000, Koyama 7,200, Nagoshi 45,200 including early portion) and 28/33 employees (69,200 shares, including Masahiko Furukado 2,400 and other staff 24,000).
* Lock-Up Compliance: Part IV confirms zero abnormal share transfers during the reporting period, with all third-party allottees and option holders executing statutory continuous-holding confirmation letters under TSE Listing Regulations Enforcement Rules Articles 268, 270, and 272 (90-to-180-day post-IPO lock-up for DIMENSION No. 2’s 400,000 shares).
Forensic Risk Synthesis: Narrative vs. Operational Reality
While management guides toward sustained capital efficiency by tracking revenue growth rate, ordinary profit margin, equity ratio, ROE, partner facility count, and helmet sales volume as core KPIs, institutional investors must weigh four structural constraints:
1. Competitor Patent & Trade-Secret Litigation Overhang (Medium Probability / High Impact): Berry disclosed in its statutory risk factors that a competitor sent a written notice alleging patent infringement and misappropriation of trade secrets under Japan’s Unfair Competition Prevention Act—a direct byproduct of CEO Nakano, Director Sakata, CFO Koyama, and CTO Nagoshi migrating from Japan Medical Company. Although multiple external law and patent firms issued formal legal opinions concluding that infringement or illegality is unlikely, a formal lawsuit during or after the IPO could disrupt hospital channel confidence.
2. Tokyo Single-Site Disaster Vulnerability (Low Probability / High Impact): With 100% of 3D printing capacity housed in a single building in Motoasakusa, Taito-ku, Tokyo, a major metropolitan earthquake, fire, or prolonged power outage would halt production entirely, as Berry currently relies only on AWS cloud data backups and raw material buffer stocks without a secondary manufacturing site in Kansai or western Japan.
3. Demographic Ceiling, Seasonality, and NHI Pricing Risk (Medium Probability / Medium Impact): With 99.2% of FY26 revenue tied to `baby band` and Japan’s annual births falling to 671,000, Berry’s 53% market share means domestic growth depends on lifting Japan’s 5.5% clinical treatment rate and expanding into regional "bed-town" clinics. Demand is also vulnerable to summer heatwaves (reducing infant wear compliance), winter influenza outbreaks, holiday clinic closures (New Year, Golden Week, Obon), and potential long-term price compression if the Ministry of Health, Labour and Welfare (MHLW) ever brings cranial helmets under National Health Insurance (NHI) reimbursement.
4. Cross-Border & Second-Curve Execution Hurdles: Shipping custom 3D-printed helmets from Tokyo to the Republic of Korea faces customs clearance latency and local clinical adoption hurdles, while `QMSmart` (JPY 11,120 thousand in FY26; ~JPY 30 million annualized in Q1 FY27) represents less than 2% of revenue and must scale rapidly to justify a SaaS-adjusted valuation multiple.
Key Financial Questions From the FY26 IPO Filing
What drove Berry Inc.'s revenue and margin performance in FY26?
Berry Inc.'s FY26 revenue grew 57.0% YoY to JPY 1,369,588 thousand strictly through volume expansion, as partner medical institutions increased 69.3% YoY from 163 to 276 (reaching 327 by September 2026) and `baby band` helmet shipments rose 55.8% YoY from 4,349 to 6,774 units at a stable factory ASP of JPY 200,541. Gross margin expanded +170 bps YoY to 75.2% in FY26 (and +3,750 bps since FY23 to 78.0% in Q1 FY27) while operating margin rose +460 bps YoY to 22.7% (JPY 310,381 thousand), as direct raw material costs accounted for just 2.25% of revenue (JPY 4,546 per unit) and high shipment volumes diluted fixed 3D printer depreciation (JPY 53,075 thousand) and SG&A expenses (down from 133.1% of revenue in FY23 to 52.6% in FY26).
How is Berry Inc. allocating capital and expanding its regional infrastructure?
Operating an asset-light model from a single leased headquarters and 3D printing factory in Motoasakusa, Taito-ku, Tokyo (carrying JPY 174,890 thousand in net PP&E and spending JPY 50,745 thousand or 3.71% of revenue on FY26 CapEx), Berry deploys free portable 3D scanners and cloud software to clinics at an upfront onboarding cost of ~JPY 400,000 per site, achieving full cash payback in 1.22 months (2.48 helmets). IPO proceeds will fund engineering and sales recruitment, medical academic promotion, Motoasakusa 3D printer capacity expansion, and repayment of JPY 72,624 thousand in debt to support domestic clinic penetration, `QMSmart` eQMS scaling, and commercial entry into the Republic of Korea following July 2026 regulatory approval.
How does Berry Inc.'s governance structure and pre-IPO capitalization impact public float?
Berry’s three internal co-founders—CEO Yuji Nakano (21.07%), Mitsuo Sakata (19.26%), and CFO Satoshi Koyama (17.97%)—control 58.30% of fully diluted voting rights (85.02% when combined with Outside Director Soshi Matsumoto’s 26.72% stake via SK Management and personal holdings), insulating the company from hostile takeovers. Secondary market supply pressure after the 90-to-180-day statutory lock-up is concentrated in sole venture capital investor DIMENSION No. 2 Investment LPS (400,000 shares or 8.91% diluted, acquired at a split-adjusted JPY 500 per share) and two employee/director stock option pools totaling 391,200 shares (9.54% dilution at a JPY 500 exercise price, opening in October 2026 and April 2027).
Presentation Download & Analyst Briefing Access:
- Institutional Presentation: Download the full "Berry_Inc._IPO_Due_Diligence" PDF under the 'Related Topics' section.
- Analyst Video Briefing: Watch the "Berry Inc. (7360) IPO Audit: Can a 78% Gross Margin 3D Helmet Platform Beat Japan's 671k Birth Crisis?" on the HDIN Research YouTube Channel.
About HDIN Research:
HDIN Research is a premier global market intelligence and strategic advisory firm specializing in institutional-grade financial analysis, supply chain audits, and macroeconomic forecasting. Our dedicated sector analysts deliver actionable, data-driven insights tailored for private equity, hedge funds, and corporate strategy teams. Visit us at https://www.hdinresearch.com.
Editorial & Methodology Disclosure:
"This market intelligence brief was researched, modeled, and audited by the HDIN Research Equity Desk based on official primary corporate filings (Berry Inc. Tokyo Stock Exchange Growth Market Securities Registration Statement Part I covering FY2022 through Q1 FY2027). Proprietary quantitative extraction tools were utilized to ensure 100% fidelity to reported financial line items and footnotes. All forensic interpretations, segmental benchmarks, and institutional verdicts were independently written and verified by HDIN senior sector analysts in accordance with institutional research standards."
HDIN Executive Takeaways
1. Margin & Volume Expansion: Berry Inc. [TSE Growth: 7360 / IPO Filing] expanded FY26 revenue 57.0% YoY to JPY 1,369,588 thousand and operating profit 97.0% YoY to JPY 310,381 thousand (22.7% margin), driven by 6,774 `baby band` shipments (53% domestic share) and a +3,470 bps four-year gross margin expansion to 75.2% (78.0% in Q1 FY27).
2. Capital Efficiency & Footprint: Operating from a single leased facility in Taito-ku, Tokyo (CapEx/Revenue at 3.71%), Berry achieved a 44.8% ROE, 1.22-month clinic payback across 327 Japanese medical facilities, and July 2026 regulatory clearance in the Republic of Korea.
3. Institutional Verdict: Exceptional unit economics (80.4% contribution margin) and 85.02% insider voting control are tempered by a 99.2% single-product reliance, Japan’s 671,000 birth-rate ceiling, and an unresolved competitor patent and trade-secret claim.
Figure Berry Inc IPO Executive Analysis 5-Year Trajectory & Strategic Milestone Blueprint
Berry Inc. FY26 Financial Performance, Segmental Unit Economics, and Forensic Audit
Berry Inc. [TSE Growth: 7360 / IPO Filing] reported top-line revenue of JPY 1,369,588 thousand (+57.0% YoY; 3-year CAGR of 177.5%) and bottom-line net income of JPY 223,566 thousand (16.3% net margin, +60.1% YoY) in its 5th fiscal term ended May 31, 2026 (FY26), followed by Q1 FY27 (ended August 31, 2026) revenue of JPY 391,876 thousand and net income of JPY 67,911 thousand (17.3% net margin). Prepared under Japanese GAAP (J-GAAP) on a standalone basis—as the company maintains zero subsidiaries, parent entities, or affiliates—the financial statements for FY25 (4th Term) and FY26 (5th Term) received unqualified audit opinions from Izumi Audit Corporation under Article 193-2, Paragraph 1 of the Financial Instruments and Exchange Act, while Q1 FY27 (6th Term Q1) received an unqualified interim review and FY22–FY24 (Terms 1–3) were compiled under the Companies Act Calculation Rules.
Table Multi-Year Financial Evolution and DuPont Working Capital Metrics
| Financial Metric / Ratio (Unit: JPY Thousand, except % and ratios) | FY22 (Term 1: 2022/05) | FY23 (Term 2: 2023/05) | FY24 (Term 3: 2024/05) | FY25 (Term 4: 2025/05) | FY26 (Term 5: 2026/05) | Q1 FY27 (Term 6 Q1: 2026/08) | Multi-Year CAGR / Basis Point Shift |
| Revenue | — | 64,036 | 340,452 | 872,476 | 1,369,588 | 391,876 | 177.5% (3-Yr CAGR) |
| Revenue YoY Growth (%) | — | — | +431.7% | +156.3% | +57.0% | — (Annualized: ~1,567,504) | — |
| Cost of Goods Sold | — | 38,126 | 134,809 | 231,411 | 339,464 | 86,155 | — |
| Gross Profit | — | 25,910 | 205,642 | 641,065 | 1,030,124 | 305,721 | 241.3% (3-Yr CAGR) |
| Gross Margin (%) | — | 40.5% | 60.4% | 73.5% | 75.2% | 78.0% | +3,750 bps (T2 to T6 Q1) |
| SG&A Expenses | 49,495 | 85,263 | 217,119 | 483,528 | 719,742 | 208,507 | +48.9% YoY in FY26 |
| SG&A-to-Revenue Ratio (%) | — | 133.1% | 63.8% | 55.4% | 52.6% | 53.2% | -8,050 bps (T2 to T5) |
| Operating Profit | -49,495 | -59,353 | -11,477 | 157,537 | 310,381 | 97,213 | Turnaround in FY25 (+97.0% YoY FY26) |
| Operating Margin (%) | — | -92.7% | -3.4% | 18.1% | 22.7% | 24.8% | +460 bps YoY in FY26 |
| Ordinary Profit | -49,495 | -59,353 | -11,477 | 159,930 | 314,423 | 98,756 | +96.6% YoY in FY26 |
| Ordinary Profit Margin (%) | — | -92.7% | -3.4% | 18.3% | 23.0% | 25.2% | +470 bps YoY in FY26 |
| Net Income | -49,737 | -59,643 | -17,369 | 139,609 | 223,566 | 67,911 | +60.1% YoY in FY26 |
| Net Profit Margin (%) | — | -93.1% | -5.1% | 16.0% | 16.3% | 17.3% | +30 bps YoY in FY26 |
| Depreciation & Amortization (D&A) | — | — | — | 63,422 | 60,550 | 13,299 | -4.5% YoY in FY26 |
| EBITDA (Operating Profit + D&A) | — | — | — | 220,959 | 370,931 | 110,512 | +67.9% YoY in FY26 |
| EBITDA Margin (%) | — | — | — | 25.3% | 27.1% | 28.2% | +180 bps YoY in FY26 |
| Total Assets | 122,865 | 89,399 | 351,323 | 638,677 | 930,209 | 918,879 | +65.8% (4-Yr CAGR) |
| Net Assets / Equity | 114,262 | 54,619 | 248,119 | 387,728 | 611,295 | 679,206 | +52.1% (4-Yr CAGR) |
| Return on Equity (ROE, %) | — | — | — | 43.9% | 44.8% | — | +90 bps YoY in FY26 |
| Return on Assets (ROA, %) | -40.5% | -56.2% | -7.9% | 28.2% | 28.5% | — | +30 bps YoY in FY26 |
| Total Asset Turnover (Times/Yr) | — | 0.60x | 1.55x | 1.76x | 1.75x | 1.70x (Annualized) | Equity Multiplier: 1.52x (FY26) |
| Days Inventory Outstanding (DIO, Days) | — | — | — | 22.2 | 18.9 | 28.9 | -3.3 days YoY in FY26 |
| Days Sales Outstanding (DSO, Days) | — | — | — | 38.5 | 38.4 (Statutory: 28.0) | 35.3 | -0.1 days YoY in FY26 |
| Days Payable Outstanding (DPO, Days) | — | — | — | 6.9 | 6.9 | 7.1 | 0.0 days YoY in FY26 |
| Cash Conversion Cycle (CCC, Days) | — | — | — | 53.8 | 50.4 | 57.1 | -3.4 days YoY in FY26 |
| Operating Cash Flow (OCF) | — | — | — | 246,607 | 301,001 | — | +22.1% YoY in FY26 |
| Investing Cash Flow (ICF) | — | — | — | -157,640 | -64,294 | — | — |
| Free Cash Flow (FCF = OCF + ICF) | — | — | — | 88,967 | 236,707 | — | +166.1% YoY in FY26 |
| OCF-to-Net Income Ratio (Times) | — | — | — | 1.77x | 1.35x | — | High cash earnings quality |
| Debt-to-Asset Ratio (%) | 7.0% | 38.9% | 29.4% | 39.3% | 34.3% | 26.1% | -500 bps YoY in FY26 |
| Equity Ratio (%) | 93.0% | 61.1% | 70.6% | 60.7% | 65.7% | 73.9% | +500 bps YoY in FY26 |
| Current Ratio (%) | 1,425.2% | 257.3% | 340.5% | 214.1% | 265.7% | 360.6% | +5,160 bps YoY in FY26 |
| Quick Ratio (%) | 1,425.2% | 257.3% | 335.7% | 200.7% | 250.7% | 339.4% | +5,000 bps YoY in FY26 |
| Interest-Bearing Debt | — | — | — | 80,164 | 72,624 | 70,144 | -9.4% YoY in FY26 |
| Interest Coverage Ratio (Times) | — | — | — | 193.6x | 319.4x | 444.9x | — |
DuPont decomposition confirms that Berry’s 44.8% ROE in FY26 is generated organically through a 16.3% net profit margin and a 1.75x total asset turnover rather than financial leverage (equity multiplier of 1.52x). At FY26 year-end, cash and deposits stood at JPY 492,640 thousand against total interest-bearing debt of JPY 72,624 thousand (comprising JPY 70,176 thousand in long-term borrowings—of which JPY 6,996 thousand is due within one year—sourced primarily from Japan Finance Corporation at ~JPY 50,000 thousand with a 0.8% weighted average interest rate and Mizuho Bank at ~JPY 13,180 thousand, alongside JPY 2,448 thousand in lease obligations, of which JPY 580 thousand is current), yielding a net cash position of JPY 420,016 thousand (net debt of -JPY 420 million) and covering current liabilities (~JPY 254 million) by 2.51x on a quick ratio basis. After executing a JPY 177,435 thousand (94.7%) capital reduction in May 2024 to eliminate FY24 accumulated deficits of JPY 17,369 thousand, retained earnings accumulated to JPY 346 million by the end of FY26.
Segmental Operations, Price-Volume Mix, and Unit Economics
Berry operates under a single reporting segment, the Medical Innovation Business, divided into two operational domains: the Medical Product Domain (custom 3D-printed infant cranial remolding orthoses under the `baby band` series: `baby band` 1st generation, `baby band 2`, and `baby band 3`, alongside 3D head-scanning hardware, a hospital treatment management platform, and a patient follow-up recording app) and the Medical AX Domain (the `QMSmart` cloud electronic quality management system [eQMS] launched commercially in July 2025, supported by the `Yakuji Joho Navi` regulatory portal launched in October 2024).
Table Revenue Growth, Product Sales, Distribution Network, and Market Penetration by Fiscal Period (FY2025–Q1 FY2027)
| Segment / Operational Metric | FY25 (Term 4: 2025/05) | FY26 (Term 5: 2026/05) | YoY Change (%) | Q1 FY27 (Term 6 Q1: 2026/08) | Operational Attribution & Notes |
| Medical Product Revenue (JPY Thousand) | 872,476 (100.0%) | 1,358,468 (99.2%) | +55.70% | 384,362 (98.1%) | Core cash cow; 99.9% volume-driven growth |
| Medical AX Revenue (JPY Thousand) | — (0.0%) | 11,120 (0.8%) | New Launch | 7,513 (1.9%) | Annualized ~JPY 30,000k; FY26 contract liabilities: JPY 8,796k |
| Total Company Revenue (JPY Thousand) | 872,476 (100.0%) | 1,369,588 (100.0%) | +57.0% | 391,876 (100.0%) | 100.0% derived from domestic Japanese market |
| baby band Sales Volume (Units) | 4,349 | 6,774 | +55.76% | ~1,917 (Est.) | Cumulative >16,000 units as of Sept 2026; 0 order backlog |
| Factory Average Selling Price (ASP, Ex-Tax JPY) | 200,615 | 200,541 | -0.04% | 200,502 (-0.02%) | End-patient out-of-pocket price: JPY 300,000–350,000 (incl. tax) |
| Partner Medical Institutions (Facilities) | 163 | 276 | +69.3% (+113 net) | 318 (Aug) / 327 (Sept) | Sept 2026: 245 clinics + 82 hospitals across all 47 prefectures |
| Annual Shipment Density per Facility (Units) | 26.7 | 24.5 (2.04/mo) | -8.2% | 24.1 (Annualized) | Natural dilution as network expands into regional clinics |
| Domestic Helmet Market Share (%) | ~35% (Est.) | 53.0% | +1,800 bps | >60% (Monthly Peak) | 6,774 of 12,797 total Japan shipments (MHLW FY26 survey) |
Because `baby band` helmets are custom-manufactured per infant 3D scan, production volume and order volume match sales volume at nearly 100%, resulting in zero order backlog and an inventory turnover cycle (DIO) of 18.9 days in FY26. Total FY26 ending inventory was JPY 20,822 thousand, consisting of JPY 13,962 thousand in raw materials (JPY 3,450 thousand in 3D printing resin filament and JPY 10,511 thousand in natural fiber skin-friendly interior cushions, accounted for via FIFO), JPY 3,680 thousand in work-in-progress (individual cost method), and JPY 3,180 thousand in supplies.
Within SG&A (JPY 719,742 thousand in FY26), total personnel costs of JPY 232,545 thousand comprised JPY 83,895 thousand in directors' compensation, JPY 137,266 thousand in employee salaries and allowances, and JPY 11,384 thousand in bonus provisions. With total fixed costs of ~JPY 756 million (JPY 137.4 million in fixed manufacturing overhead plus JPY 619.0 million in non-advertising SG&A) and a company-wide contribution margin ratio of 75.2%, Berry’s FY26 static break-even point (BEP) is JPY 1,005 million in revenue (~5,012 helmets), providing a 26.6% safety margin against actual FY26 revenue. At the clinic level, Berry provides its proprietary portable 3D scanner (~JPY 250,000 hardware cost) and onboarding/training (~JPY 150,000) free of charge to partner clinics; this JPY 400,000 upfront customer acquisition cost (CAC) is recovered after 2.48 helmet shipments, equating to a payback period of 1.22 months (~37 days) at the FY26 average clinic shipment rate of 2.04 units per month.
Forensic Accounting Audit and Core Operating Profit Walk
A forensic audit of Berry’s financial footnotes confirms Tier-1 earnings quality with zero off-balance-sheet liabilities, zero capitalized software or R&D expenses, zero goodwill (のれん), and zero fixed-asset impairment losses. Under Accounting Standard for Revenue Recognition (ASBJ Statement No. 29), hardware revenue is recognized strictly upon hospital inspection and acceptance rather than upon shipment, preventing channel stuffing, while `QMSmart` SaaS revenue is recognized ratably over the contract period. In FY26, accounts receivable increased 56.9% YoY (from JPY 91,945 thousand to JPY 144,222 thousand, and JPY 151,643 thousand in Q1 FY27), matching the +57.0% YoY revenue growth within 10 bps. Gross receivable billings (including consumption tax) totaled JPY 1,525,662 thousand in FY26 with cash collections of JPY 1,473,385 thousand (a 91.1% collection rate and a 28.0-day statutory collection period), with zero allowance for doubtful accounts required.
R&D expenses—totaling JPY 20,363 thousand in FY25 (2.3% of revenue), JPY 14,084 thousand in FY26 (1.0% of revenue), and JPY 3,038 thousand in Q1 FY27—were 100% expensed within SG&A. COGS in FY26 included a routine JPY 5,391 thousand inventory valuation loss. Depreciation methods remained unchanged across all vijf fiscal terms: straight-line method for buildings (8–15 years) and declining-balance method for machinery/equipment (3–8 years) and tools/fixtures (3–15 years). Operating cash flow in FY26 (JPY 301,001 thousand, 1.35x net income) was derived from pre-tax profit of JPY 314,347 thousand plus JPY 60,550 thousand in D&A (subtotal JPY 347,731 thousand), adjusted for working capital shifts (AR increase of -JPY 52,277 thousand, inventory increase of -JPY 3,642 thousand, unpaid corporate tax increase of +JPY 55,563 thousand, and contract liabilities increase of +JPY 8,796 thousand) less JPY 46,326 thousand in income taxes paid. Related-party disclosures confirm zero officer loans, zero related-party property leases, and zero related-party trade; the sole related-party transaction is a personal joint debt guarantee provided by founder and CEO Yuji Nakano on bank borrowings (outstanding balance of JPY 27,172 thousand in FY25 and JPY 20,176 thousand in FY26, with JPY 0 guarantee fee paid).
Motoasakusa Single-Site Infrastructure, Capex Intensity, and 90 Billion Yen TAM Moat
Berry operates an all-in-one, single-site headquarters, R&D center, 3D data processing hub, and additive manufacturing factory at 2-7-1 Motoasakusa, Taito-ku, Tokyo (Sumitomo Realty Motoasakusa Building), leased from independent third party Sumitomo Realty & Development Co., Ltd.. Following initial relocation from Jinnan, Shibuya-ku in May 2024 and an in-building floor expansion in May 2025, annual rent totaled JPY 57,458 thousand in FY26, with lease deposits rising from JPY 58,763 thousand at the end of FY26 to JPY 93,995 thousand (+JPY 35,232 thousand) in Q1 FY27. The facility holds a Type 2 Medical Device Marketing License from the Governor of Tokyo (valid through January 5, 2027) and a Medical Device Manufacturing Registration (valid through December 6, 2028), alongside ISO 13485 (acquired December 2024) and ISO/IEC 27001:2022 (acquired March 2025) certifications.
Historical capital expenditure demonstrates an asset-light trajectory: after spending JPY 124,036 thousand (cash basis; 14.22% of revenue, 1.96x D&A) in FY25 for the Motoasakusa HQ build-out, CapEx declined to JPY 50,745 thousand on an accrual basis (JPY 64,294 thousand cash basis) in FY26—representing 3.71% of revenue (4.70% cash basis) and 0.84x D&A (1.06x cash basis)—and JPY 12,187 thousand in Q1 FY27 (3.11% of revenue, 0.92x D&A). In FY26, Berry generated JPY 220,681 thousand in NOPAT (operating profit of JPY 310,381 thousand taxed at the 28.9% effective rate); against total invested capital of JPY 683,919 thousand (net assets of JPY 611,295 thousand plus interest-bearing debt of JPY 72,624 thousand), static ROIC reached 32.3% (41.7% terminal standard), and 115.4% when excluding JPY 492,640 thousand in excess cash (operating invested capital of JPY 191,279 thousand). Because industrial 3D printers require only 1–3 months from procurement to cloud integration, IPO proceeds—earmarked for (1) recruiting R&D, regulatory, and `QMSmart` sales personnel, (2) medical academic advertising, (3) Motoasakusa factory expansion and 3D printer/scanner CapEx, and (4) repaying the JPY 72,624 thousand in debt—will add less than 150 bps in incremental depreciation burden even if annual equipment CapEx doubles to JPY 100 million.
Supply Chain Concentration, Customer Dispersion, and Geographic Footprint
Berry’s upstream supply chain exhibits minimal concentration risk. Total raw material purchases of JPY 30,794 thousand in FY26 represented 2.25% of revenue (a 50% raw material price spike would compress gross margin by only 110 bps, from 75.2% to 74.1%). Key suppliers include Softpren Industry Corporation (cushion materials), Seiko Packing Co., Ltd., and IT engineering dispatch firm Levtech Co., Ltd. (ending accounts payable of JPY 2,176 thousand out of total company accounts payable of JPY 6,431 thousand).
On the downstream side, no single customer accounted for 10% or more of revenue across FY25, FY26, or Q1 FY27, with the largest single medical institution estimated at less than 2.5%–3.0% of total sales (~150–200 helmets or JPY 30–40 million annually).
Geographically, in strict accordance with United Nations geographic naming standards and statutory footnote disclosures, 100.0% of Berry’s revenue and 100.0% of its tangible fixed assets in FY25 (JPY 872,476 thousand), FY26 (JPY 1,369,588 thousand), and Q1 FY27 (JPY 391,876 thousand) were located in Japan. Overseas revenue was 0.0% (JPY 0), including 0.0% in the Republic of Korea (where `baby band 3` obtained medical device certification in July 2026 ahead of commercial launch), 0.0% in Mainland China, 0.0% in Hong Kong, China, and 0.0% in Taiwan, Province of China / Taiwan, China.
Table Market Sizing (TAM/SAM/SOM) and Competitive Benchmarking
| Market / Competitive Dimension | Berry Inc. (baby band & QMSmart) | Traditional Competitors (Imported Western Brands / Local Prosthetics: e.g., Aimet, Qurum) | Strategic Moat & Industry Benchmark Source |
| Infant Helmet TAM / SAM / SOM | SOM: JPY 1.358B (6,774 units, 53% share; >60% peak) | Industry Total: 12,797 units (~JPY 5.0B–6.5B SAM across ~10,000 treated infants/yr) | TAM: JPY 90.0B (671,000 Japan births in 2025 × 26.2% moderate/severe prevalence = ~180,000 infants [40k severe, 140k moderate] × JPY 500k; actual treatment penetration: 5.5%) |
| Manufacturing & Adjustment Workflow | Parametric 3D printing + algorithm pre-fitting; doctors adjust in-clinic without prosthetists | Plaster casting / manual grinding by certified prosthetists and orthotists | Eliminates prosthetist labor bottleneck; co-hosts Cranial Shape Clinical Practice Study Group (170+ doctors) |
| Hospital CapEx & Onboarding | JPY 0 hospital CapEx: Free portable 3D scanner + cloud management platform | Requires hospitals to purchase fixed 3D scanning rigs costing several million JPY | High switching costs once embedded in clinical workflow |
| End-Patient Out-of-Pocket Price | JPY 300,000–350,000 (incl. tax) | JPY 400,000–600,000 (incl. tax) | 25%–40% price advantage; 15+ shell designs & IP collaborations; 19th Kids Design & 14th MedTec Awards |
| Medical Institution Network | 327 facilities (245 clinics, 82 hospitals across all 47 prefectures; 72.3% of active sites) | 50–70 facilities per competitor, concentrated in major metropolitan university hospitals | Only 452 of Japan's 30,000 target clinics/hospitals (6,000 hospitals) currently offer therapy (1.5% penetration) |
| eQMS (QMSmart) TAM & Positioning | From JPY 100,000/month (~JPY 1.2M/yr); generative AI SOP/CAPA review & training test generation | Western enterprise eQMS (Veeva, MasterControl) costing tens of millions of JPY; or paper/Excel | TAM: JPY 84.0B across 14,000 Japanese pharma/medtech firms (22.1% software penetration). Driven by May 2025 Revised PMD Act (Act No. 37 of Reiwa 7); <1/2 cost of JPY 8M+ QA hire. Clients: Kyocera, FRONTEO, Solasia Pharma, CMIC, JFE Technos. Funnel: Yakuji Joho Navi (10,000+ MAU, 300+ webinar attendees) |
HDIN Institutional Verdict: Japan Medical Company Spin-Out DNA vs. Litigation and Demographic Realities
Berry’s operational velocity—achieving three generations of Class II medical device approvals between April 2022 and March 2023 and capturing 53% domestic market share within five years of its July 2021 founding—is directly attributable to its founding team’s prior executive tenure at domestic cranial helmet pioneer Japan Medical Company. However, this exact organizational pedigree is the catalyst for Berry’s most acute legal overhang.
Executive Leadership, Governance Matrix, and Shareholding Structure
Berry’s corporate governance comprises a 6-member Board of Directors (4 internal executive directors and 2 independent outside directors = 33.3% independence; convened 14 times in FY26 with 100% attendance), a 3-member Audit & Supervisory Board (100% independent outside auditors; convened 16 times in FY26 with 100% attendance), and a Voluntary Compensation Committee chaired by CEO Yuji Nakano alongside outside directors Hiroyuki Saeki and Soshi Matsumoto. In FY26, 100% of officer compensation was fixed base pay (zero performance-linked cash bonuses and zero retirement benefit provisions): 4 internal directors received a combined JPY 64,479 thousand (average ~JPY 16.12 million), 2 outside directors received JPY 8,100 thousand, and 3 outside auditors received JPY 11,316 thousand.
Beyond the founding trio (58.30% combined diluted voting power) and Soshi Matsumoto’s bloc (26.72%), who together lock up 85.02% of total voting rights, external shareholders consist of lead venture capital fund DIMENSION No. 2 Investment LPS (400,000 common shares; 8.91% diluted / 9.76% issued common; invested JPY 200,000 thousand at JPY 500/share), angel advisor Tsuyoshi Nishimoto (80,000 common shares; 1.78% diluted / 1.95% issued common; invested JPY 20,000 thousand at JPY 250/share), and 28 core employees/advisors holding 116,200–117,200 option shares (2.59%–2.61%), bringing total fully diluted shares to 4,491,200 (4,100,000 issued common shares plus 391,200 option shares).
Berry has issued two series of stock options under Articles 236, 238, and 239 of the Companies Act, totaling 391,200 shares (9.54% dilution relative to 4,100,000 issued shares; 8.71% of 4,491,200 fully diluted shares). Both series carry a split-adjusted exercise price of JPY 500 per share (valued via weighted DCF and Net Asset methods), require the company’s stock to be listed on a Japanese exchange prior to exercise, require continuous employment/board service at exercise, and prohibit transfer or partial exercise:
* 1st Series Stock Options: Resolved at the September 27, 2024 EGM and October 15, 2024 Board meeting (granted November 15, 2024). Comprises 581 active units (583 initial, 2 forfeited) representing 232,400 common shares (240,000 initial), exercisable from October 16, 2026 to October 15, 2034. Allocated to 3 internal directors (86,400 shares: Nakano 86,400, Sakata 44,800) and 20/29 employees (146,000 shares, including Masahiko Furukado 8,000 and other staff 93,200).
* 2nd Series Stock Options: Authorized under the September 27, 2021 EGM framework and resolved at the April 14, 2025 Board meeting (granted May 15, 2025). Comprises 397 active units (400 initial, 3 forfeited) representing 158,800 common shares (162,000 initial), exercisable from April 15, 2027 to April 14, 2035. Allocated to 4 internal directors (89,600 shares: Nakano 60,000 [total Nakano options adjusted to 146,100], Sakata 20,000, Koyama 7,200, Nagoshi 45,200 including early portion) and 28/33 employees (69,200 shares, including Masahiko Furukado 2,400 and other staff 24,000).
* Lock-Up Compliance: Part IV confirms zero abnormal share transfers during the reporting period, with all third-party allottees and option holders executing statutory continuous-holding confirmation letters under TSE Listing Regulations Enforcement Rules Articles 268, 270, and 272 (90-to-180-day post-IPO lock-up for DIMENSION No. 2’s 400,000 shares).
Forensic Risk Synthesis: Narrative vs. Operational Reality
While management guides toward sustained capital efficiency by tracking revenue growth rate, ordinary profit margin, equity ratio, ROE, partner facility count, and helmet sales volume as core KPIs, institutional investors must weigh four structural constraints:
1. Competitor Patent & Trade-Secret Litigation Overhang (Medium Probability / High Impact): Berry disclosed in its statutory risk factors that a competitor sent a written notice alleging patent infringement and misappropriation of trade secrets under Japan’s Unfair Competition Prevention Act—a direct byproduct of CEO Nakano, Director Sakata, CFO Koyama, and CTO Nagoshi migrating from Japan Medical Company. Although multiple external law and patent firms issued formal legal opinions concluding that infringement or illegality is unlikely, a formal lawsuit during or after the IPO could disrupt hospital channel confidence.
2. Tokyo Single-Site Disaster Vulnerability (Low Probability / High Impact): With 100% of 3D printing capacity housed in a single building in Motoasakusa, Taito-ku, Tokyo, a major metropolitan earthquake, fire, or prolonged power outage would halt production entirely, as Berry currently relies only on AWS cloud data backups and raw material buffer stocks without a secondary manufacturing site in Kansai or western Japan.
3. Demographic Ceiling, Seasonality, and NHI Pricing Risk (Medium Probability / Medium Impact): With 99.2% of FY26 revenue tied to `baby band` and Japan’s annual births falling to 671,000, Berry’s 53% market share means domestic growth depends on lifting Japan’s 5.5% clinical treatment rate and expanding into regional "bed-town" clinics. Demand is also vulnerable to summer heatwaves (reducing infant wear compliance), winter influenza outbreaks, holiday clinic closures (New Year, Golden Week, Obon), and potential long-term price compression if the Ministry of Health, Labour and Welfare (MHLW) ever brings cranial helmets under National Health Insurance (NHI) reimbursement.
4. Cross-Border & Second-Curve Execution Hurdles: Shipping custom 3D-printed helmets from Tokyo to the Republic of Korea faces customs clearance latency and local clinical adoption hurdles, while `QMSmart` (JPY 11,120 thousand in FY26; ~JPY 30 million annualized in Q1 FY27) represents less than 2% of revenue and must scale rapidly to justify a SaaS-adjusted valuation multiple.
Key Financial Questions From the FY26 IPO Filing
What drove Berry Inc.'s revenue and margin performance in FY26?
Berry Inc.'s FY26 revenue grew 57.0% YoY to JPY 1,369,588 thousand strictly through volume expansion, as partner medical institutions increased 69.3% YoY from 163 to 276 (reaching 327 by September 2026) and `baby band` helmet shipments rose 55.8% YoY from 4,349 to 6,774 units at a stable factory ASP of JPY 200,541. Gross margin expanded +170 bps YoY to 75.2% in FY26 (and +3,750 bps since FY23 to 78.0% in Q1 FY27) while operating margin rose +460 bps YoY to 22.7% (JPY 310,381 thousand), as direct raw material costs accounted for just 2.25% of revenue (JPY 4,546 per unit) and high shipment volumes diluted fixed 3D printer depreciation (JPY 53,075 thousand) and SG&A expenses (down from 133.1% of revenue in FY23 to 52.6% in FY26).
How is Berry Inc. allocating capital and expanding its regional infrastructure?
Operating an asset-light model from a single leased headquarters and 3D printing factory in Motoasakusa, Taito-ku, Tokyo (carrying JPY 174,890 thousand in net PP&E and spending JPY 50,745 thousand or 3.71% of revenue on FY26 CapEx), Berry deploys free portable 3D scanners and cloud software to clinics at an upfront onboarding cost of ~JPY 400,000 per site, achieving full cash payback in 1.22 months (2.48 helmets). IPO proceeds will fund engineering and sales recruitment, medical academic promotion, Motoasakusa 3D printer capacity expansion, and repayment of JPY 72,624 thousand in debt to support domestic clinic penetration, `QMSmart` eQMS scaling, and commercial entry into the Republic of Korea following July 2026 regulatory approval.
How does Berry Inc.'s governance structure and pre-IPO capitalization impact public float?
Berry’s three internal co-founders—CEO Yuji Nakano (21.07%), Mitsuo Sakata (19.26%), and CFO Satoshi Koyama (17.97%)—control 58.30% of fully diluted voting rights (85.02% when combined with Outside Director Soshi Matsumoto’s 26.72% stake via SK Management and personal holdings), insulating the company from hostile takeovers. Secondary market supply pressure after the 90-to-180-day statutory lock-up is concentrated in sole venture capital investor DIMENSION No. 2 Investment LPS (400,000 shares or 8.91% diluted, acquired at a split-adjusted JPY 500 per share) and two employee/director stock option pools totaling 391,200 shares (9.54% dilution at a JPY 500 exercise price, opening in October 2026 and April 2027).
Presentation Download & Analyst Briefing Access:
- Institutional Presentation: Download the full "Berry_Inc._IPO_Due_Diligence" PDF under the 'Related Topics' section.
- Analyst Video Briefing: Watch the "Berry Inc. (7360) IPO Audit: Can a 78% Gross Margin 3D Helmet Platform Beat Japan's 671k Birth Crisis?" on the HDIN Research YouTube Channel.
About HDIN Research:
HDIN Research is a premier global market intelligence and strategic advisory firm specializing in institutional-grade financial analysis, supply chain audits, and macroeconomic forecasting. Our dedicated sector analysts deliver actionable, data-driven insights tailored for private equity, hedge funds, and corporate strategy teams. Visit us at https://www.hdinresearch.com.
Editorial & Methodology Disclosure:
"This market intelligence brief was researched, modeled, and audited by the HDIN Research Equity Desk based on official primary corporate filings (Berry Inc. Tokyo Stock Exchange Growth Market Securities Registration Statement Part I covering FY2022 through Q1 FY2027). Proprietary quantitative extraction tools were utilized to ensure 100% fidelity to reported financial line items and footnotes. All forensic interpretations, segmental benchmarks, and institutional verdicts were independently written and verified by HDIN senior sector analysts in accordance with institutional research standards."