Rockwell Automation FY26 Analysis: 23.4% Margin | HDIN
Date : 2026-11-18
Reading : 515
BEIJING — HDIN Market Intelligence Brief | Audited by HDIN Equity Research Desk | Source Filing: FY2025 & FY2026 Form 10-K (Ended September 30, 2026)
HDIN Executive Takeaways
1. Structural Margin Inflection: Consolidated sales grew 7.76% (+8.0% organic) to $8,989.0 million in FY2026, lifting Total Segment Operating Margin 299 bps to 23.40% and GAAP Diluted EPS 63.50% to $12.54.
2. Reshoring Capex and Portfolio Exit: Rockwell accelerated capital expenditures 38.17% to $257.0 million across Wisconsin manufacturing campuses while dissolving the Sensia joint venture for $40.0 million in cash.
3. Capital Velocity and Balance Sheet Discipline: Record Free Cash Flow of $1,701.0 million funded $1,872.0 million in shareholder returns as Net Debt-to-EBITDA improved to 1.37x.
Figure ROCKWELL AUTOMATTON FY2025-FY2026 NAVIGATING INDUSTRIAL CYCLICALITY & THE SOFTWARE-DEFINED AUTOMATION SHIFT
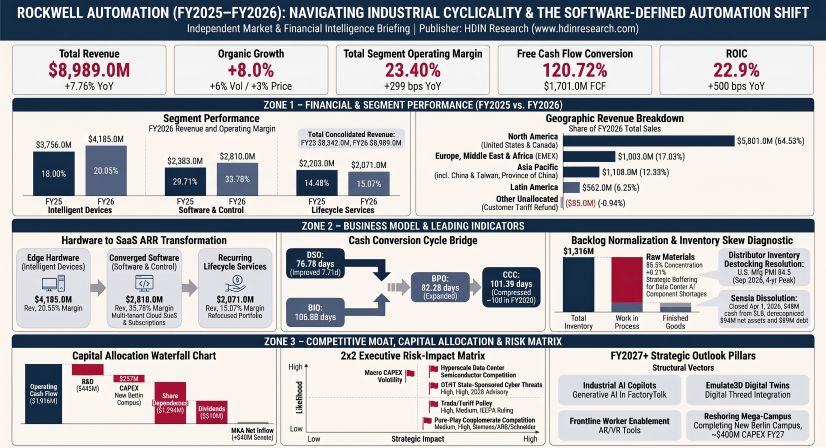
Rockwell Automation FY26 Segmental Revenue, Operating Margins, and Earnings Quality
Rockwell Automation, Inc. [NYSE: ROK] expanded consolidated top-line revenue by 7.76% reported (+8.0% organic) from $8,342.0 million in FY2025 to $8,989.0 million in FY2026, while GAAP Net Income attributable to Rockwell surged 62.14% from $869.0 million to $1,409.0 million. Total Consolidated Net Income increased 87.85% from $749.0 million to $1,407.0 million, lifting GAAP Diluted EPS by 63.50% from $7.67 to $12.54 and Non-GAAP Adjusted EPS by 27.45% from $10.53 to $13.42. The narrowing spread between GAAP and Adjusted EPS—down from $2.86 in FY2025 to $0.88 in FY2026—reflects the elimination of $360.0 million in prior-year pre-tax non-operating charges alongside structural operating leverage across high-margin automation platforms.
Table Consolidated Financial Performance, Margin Walk, and DuPont ROE Matrix (FY2025–FY2026)
Top-line acceleration in FY2026 (from FY2024 revenue of $8,264.0 million) shifted from price-only defensive growth in FY2025 (+1% reported and organic, comprising +3 percentage points of enterprise price realization and -2 percentage points of organic volume, with 0% impact from acquisitions, divestitures, and FX) to balanced volume and pricing expansion in FY2026. In FY2026, organic sales growth of +8% (+8.00%) was anchored by +6 percentage points of organic volume recovery and +3 percentage points of enterprise price realization, while foreign currency translation (+2 percentage points, or +$131.0 million), the Sensia joint-venture divestiture (-2 percentage points, or -$128.0 million), and a customer tariff refund accrual (-1 percentage point, or -$85.0 million) netted to +7.76% reported growth.
Segment profitability pivoted decisively toward software and automation control. Software & Control revenue climbed 18.25% (+17.0% organic, +1.0% FX) to $2,818.0 million, driving segment operating earnings up 34.46% to $952.0 million and expanding segment operating margin by 407 bps from 29.71% to 33.78%. Despite generating $1,367.0 million less revenue than Intelligent Devices, Software & Control surpassed Intelligent Devices ($839.0 million) as the largest profit contributor, propelled by ControlLogix and CompactLogix controllers alongside SaaS subscriptions (Plex Systems, Fiix) and FactoryTalk Design Hub. Intelligent Devices reversed a 1% organic decline in FY2025 to grow 11.42% reported (+10.0% organic, +1.0% FX) to $4,185.0 million on volume recovery in PowerFlex drives, servo motors, sensors, and Clearpath / OTTO Motors Autonomous Mobile Robots (AMRs), raising operating margin 205 bps to 20.05%. Conversely, Lifecycle Services contracted 5.99% reported (-$132.0 million) to $2,071.0 million due to a -6.0% divestiture impact (-$128.0 million) from the April 1, 2026 dissolution of the Sensia joint venture with SLB; excluding Sensia, organic sales declined 2.0% (+2.0% FX) while operating margin expanded 59 bps to 15.07% ($312.0 million) as oilfield project execution gave way to recurring OT cybersecurity (Verve Industrial Protection) and managed support contracts.
Table Segmental Revenue Decomposition, Operating Earnings, and Goodwill Allocation (FY2025–FY2026)
Note that Enterprise Operating Profit ($1,997.0 million, 22.22% margin in FY2026) is a Non-GAAP metric introduced in Item 7 of the FY2026 Form 10-K that deducts Corporate and other expenses ($116.0 million) and includes net unallocated items ($10.0 million). Across end-market clusters, discrete industries (automotive including EV and battery gigafactories, semiconductor capex, e-commerce and warehouse automation) and hybrid industries (food & beverage, life sciences, household & personal care added in FY2026, tire cited in FY2025) underpinned volume growth, while process industries (energy, mining & metals, chemicals) underwent strategic repositioning via the Sensia exit.
Table GAAP Diluted EPS to Non-GAAP Adjusted EPS Reconciliation and Pre-Tax Adjustments (FY2025–FY2026)
Three structural drivers—rather than temporary expense freezes—accounted for the 299 bps segment margin expansion. First, software mix drop-through contributed roughly 50% of the margin delta as Software & Control hit 33.78% operating margins. Second, enterprise pricing realization of +3 percentage points (achieved entirely within Intelligent Devices and Software & Control) contributed roughly 30% of the delta, fully offsetting the September 2026 U.S. Producer Price Index surge to 6.3% and data-center-driven component inflation, lifting gross margin 187 bps to 50.01%. Third, dissolving Sensia contributed roughly 20% of the delta by removing dilutive oilfield operations. Crucially, these gains absorbed a transitory cost headwind: in FY2025, SG&A was cushioned by zero annual incentive compensation payouts for FY2024 performance, whereas normalized incentive accruals resumed across SG&A in FY2026 alongside normalized restructuring ($21.0 million vs. $42.0 million in FY2025). Additional audited disclosures show environmental remediation accruals declined from $26.0 million to $23.0 million, purchase accounting adjustments dropped from $11.0 million to $0.0 million, and legacy gross asbestos accruals totaled $418.0 million at September 30, 2026 (against $273.0 million of probable insurance receivables, yielding $145.0 million in net asbestos liabilities modeled through a 2060 terminal year, with Other income/expense shifting from a $154.0 million asbestos charge in FY2025 to a $2.0 million net credit in FY2026).
DuPont decomposition confirms that ROE expansion from 23.78% to 39.67% (+1,589 bps on ending attributable equity; +1,481 bps from 24.30% to 39.11% on average balance sheet basis using average assets of $11,225.5 million in FY2025 and $11,243.5 million in FY2026 and average equity of $3,576.0 million and $3,603.0 million) was driven ~85% by Net Profit Margin (+525 bps to 15.67%), ~10% by Asset Turnover (+7.28% to 0.7977x as Sensia derecognition kept total assets nearly flat at $11,268.0 million), and ~5% by Equity Multiplier (+3.32% to 3.1723x due to $1,260.0 million in share repurchases and $617.0 million in declared dividends).
Global Manufacturing Footprint, $2.0 Billion Capex Plan, and Regional Moats
Rockwell Automation operates an owned global headquarters campus in Milwaukee, Wisconsin (1201 S. 2nd St.), approximately 10 principal manufacturing facilities across the United States, Mexico, Poland, India, Canada, and Singapore, two principal global distribution hubs (one in the United States and one in the Netherlands), and over 200 sales and administrative offices across more than 50 countries. While Item 2 omits individual property square footages, Note 20 discloses that total net property, plant, and equipment plus operating lease right-of-use (ROU) assets rose 1.75% from $1,200.0 million in FY2025 to $1,221.0 million in FY2026, anchored by a 6.22% expansion in North America to $700.0 million.
In FY2026, Rockwell initiated a structural shift from a lease-heavy assembly network toward owned, vertically integrated domestic campuses under its five-year $2.0 billion investment plan. Capital expenditures rose 38.17% from $186.0 million in FY2025 to $257.0 million in FY2026 (against prior FY2026 guidance of approximately $270.0 million) and are projected to accelerate to approximately $400.0 million in FY2027. Capital deployment is centered on constructing a greenfield mega-campus in New Berlin, Wisconsin—slated to become Rockwell's largest global manufacturing facility—and completing the January 2026 outright purchase of its previously leased manufacturing and engineering site in Mequon, Wisconsin for drives and motion control.
To mitigate trade barriers and electronic component allocation friction caused by hyperscale AI data center demand for microcontrollers, power semiconductors, and memory modules, Rockwell maintains a dual-sourcing manufacturing architecture qualifying parallel production lines for ControlLogix and PowerFlex lines across the United States, Poland, Mexico, and Singapore. Following the February 2026 U.S. Supreme Court ruling invalidating International Emergency Economic Powers Act (IEEPA) tariffs, Rockwell secured $103.0 million in approved U.S. Customs and Border Protection (CBP) refunds (credited to Cost of Sales) plus $5.0 million in interest income, while establishing an $85.0 million commercial customer refund accrual (deducted from Sales) and incurring $8.0 million in advisory costs, yielding a net pre-tax unallocated benefit of $10.0 million.
Geographically, North America (64.53% of sales; $5,801.0 million, +11.0% organic) operates as a fortified moat protected by decades of Studio 5000 / ControlLogix plant-floor entrenchment (Allen-Bradley carries a $44.0 million unamortized trademark asset), U.S. Manufacturing PMI recovery to 54.5 in September 2026, and the PartnerNetwork ecosystem. Independent authorized distributors transact 65% of total global sales in FY2025 and 70% in FY2026 (70% to 75% of hardware and software products), with channel concentration stepping up from ~20% across the top two distributors in FY2025 to ~30% across the top three distributors (~10% each) in FY2026. Conversely, EMEA (17.8% of sales; $1,603.0 million, +7.0% organic) remains contested against Siemens AG, Schneider Electric, and ABB Ltd. under DIN/IEC standards, while Asia Pacific (12.3% of sales; $1,108.0 million, +8.0% organic) pits Rockwell against lower-cost Japanese (Mitsubishi Electric, OMRON, Fanuc, Yaskawa, Yokogawa) and domestic Chinese vendors, concentrating Rockwell's share in high-reliability semiconductor and multinational export lines. Latin America (6.3% of sales; $562.0 million, +0.36% reported, -7.0% organic) contracted on Mexican automotive supplier and regional capex weakness, masked by a +$43.0 million (+8.0%) FX tailwind. As a pure-play automation provider versus diversified conglomerates (including Emerson Electric and Honeywell), Rockwell gains unified tag-database convergence and rapid portfolio agility—evidenced by the Sensia exit—but lacks counter-cyclical grid/HVAC buffers and Tier-1 semiconductor procurement scale.
HDIN Institutional Verdict: Operational Execution vs. $114 Million Working Capital Compression
A forensic cross-check of management's FY2026 operational narrative against balance sheet mechanics confirms high underlying earnings quality paired with deliberate short-term liquidity compression to fund aggressive shareholder capital returns. On April 1, 2026 (following a December 2025 separation agreement), Rockwell finalized the dissolution of its 53%-owned Sensia joint venture with SLB, receiving $40.0 million in cash and derecognizing $94.0 million in net assets—comprising $47.0 million in cash, $60.0 million in receivables, $54.0 million in inventories, $56.0 million in other intangibles, $32.0 million in goodwill, $20.0 million in contract liabilities, and $89.0 million in short-term debt (while $56.0 million of SLB loans, split into $14.0 million short-term and $42.0 million long-term, were extinguished or assumed without recourse). The transaction booked a $15.0 million pre-tax gain in Other income offset by $11.0 million in SG&A costs ($4.0 million net pre-tax gain).
Although working capital contracted 75.54% to $114.0 million (lowering the Current Ratio to 1.030x) as commercial paper rose 35.44% to $707.0 million (4.06% average rate, 19-day maturity vs. 4.24% and 16 days in FY2025) to bridge $1,872.0 million in share repurchases and dividends (110.05% of FCF, reducing diluted shares from 113.3 million to 112.4 million), solvency metrics strengthened materially. Gross interest expense fell from $156.0 million to $134.0 million (net interest $143.0 million to $118.0 million), D&A stood at $314.0 million (vs. $325.0 million), and interest coverage roughly doubled to 13.57x EBIT/Gross Interest (15.92x EBITDA/Gross Interest), providing wide headroom above the 3.0x minimum EBITDA-to-interest covenant on Rockwell's undrawn November 2025 five-year $1.5 billion unsecured revolving credit facility (maturing November 2030, with a $2.25 billion accordion).
Cash Conversion Cycle efficiency improved by 9.84 days on an ending basis (to 101.39 days) and 10.53 days on an average basis (to 102.77 days; DSO down 4.07 days to 77.60, DIO down 3.07 days to 104.08, DPO up 3.39 days to 78.90), supported by an $18.0 million expansion in Voluntary Supplier Financing ($86.0 million vs. $68.0 million). Inventory rose $69.0 million reported (+$123.0 million ex-Sensia's $54.0 million derecognition, reflecting $122.0 million cash invested on the Statement of Cash Flows versus a $55.0 million cash source in FY2025), with 85.5% of the gross increase concentrated in Raw Materials (+8.21%) and WIP (+7.55%) rather than Finished Goods (+1.99%)—confirming proactive component buffering against AI data center supply competition rather than stagnant sell-through. Meanwhile, accrued distributor rebates reached $403.0 million (where a 10% shift in rebate processing time alters the liability by $33.0 million vs. $24.0 million in FY2025).
Strategically, management refined its long-term top-line growth framework from "continue double-digit growth in annual recurring revenue" plus 1% M&A in FY2025 to "add 1% average annual growth from annual recurring revenue" plus 1% M&A in FY2026. R&D scaled to $504.0 million in FY2026 (up from $482.0 million in FY2025 and $477.0 million in FY2024) within $714.0 million of total Engineering & Development expenses ($443.0 million standalone P&L E&D line item, or 4.93% of sales vs. $445.0 million or 5.33% in FY2025), backed by technology alliances with Microsoft (Azure OpenAI), NVIDIA (Omniverse APIs with Emulate3D), PTC (ThingWorx / Vuforia; equity stake liquidated September 30, 2023), and Cisco (EtherNet/IP), as well as prior acquisitions of Clearpath Robotics / OTTO Motors ($609.0 million consideration, $566.0 million net cash, $283.0 million goodwill, $270.0 million 12-year technology, $41.0 million trademarks) and Verve Industrial Protection ($183.0 million cash, $133.0 million goodwill, $47.0 million intangibles). Governance aligns 9 independent directors out of 10 (chaired by CEO Blake D. Moret) across Audit, Technology & Operational Risk, and Compensation committees—tying ICP payouts to Organic Sales Growth, Segment Operating Margin, and FCF Conversion and LTIP shares to 3-year rTSR against S&P 500 Industrials and ROIC (>20% threshold), while promoting former VP of AI & Autonomy Jordan C. Reynolds to SVP of Lifecycle Services on October 1, 2026. Nevertheless, Item 1A and Item 7A highlight elevated ongoing exposures: a 2026 U.S. government joint advisory warning of Iranian-affiliated threat actors targeting internet-facing OT/PLC devices (monitored by a CISSP/CISA-certified CISO with 30+ years experience, annual SDL audits, and NIST/IEC 62443 compliance), EU Cyber Resiliency Act compliance costs, goodwill and intangibles comprising 41.25% of total assets ($4,648.0 million, down 118 bps from $4,760.0 million or 42.43%; goodwill alone 32.7%), and market sensitivities where a 10% adverse FX move reduces net income by ~$60.0 million (vs. ~$50.0 million in FY2025) and a +100 bps interest rate rise adds ~$7.0 million in annual interest expense (vs. ~$5.0 million in FY2025).
Key Financial Questions From the FY2026 Filing
What drove Rockwell Automation's revenue and margin performance in FY2026?
Consolidated revenue expanded 7.76% reported (+8.0% organic) to $8,989.0 million as distributor destocking normalized, driven by +6 percentage points of organic volume growth and +3 percentage points of enterprise pricing realization led by Software & Control (+17.0% organic) and Intelligent Devices (+10.0% organic). Total Segment Operating Margin rose 299 bps to 23.40% ($2,103.0 million) and Gross Margin climbed 187 bps to 50.01% due to 33.78% margins in Software & Control (+407 bps), +3% pricing offsetting 6.3% U.S. PPI inflation, and the exit from the dilutive Sensia joint venture.
How is Rockwell Automation allocating capital and expanding its regional infrastructure?
In FY2026, Rockwell generated a record $1,701.0 million in Free Cash Flow (+25.26% YoY) and returned $1,872.0 million (110.05% of FCF) via $1,254.0 million in share repurchases (3.1 million shares) and $618.0 million in cash dividends ($5.48 per share). Concurrently, capital expenditures grew 38.17% to $257.0 million (guided to ~$400.0 million in FY2027) under a $2.0 billion investment plan to purchase its Mequon, Wisconsin facility and build its largest global manufacturing campus in New Berlin, Wisconsin, supported by dual-sourced production hubs in Poland, Mexico, and Singapore.
What balance sheet and operational risks offset Rockwell Automation's record Free Cash Flow?
Funding 110.05% of FCF in shareholder distributions alongside working capital reinvestment compressed Working Capital by 75.54% to $114.0 million (Current Ratio 1.030x) and lifted commercial paper borrowings 35.44% to $707.0 million, though an undrawn $1.5 billion credit facility and 1.37x Net Debt-to-EBITDA preserve credit headroom. Operationally, Item 1A and Item 7A cite acute semiconductor and memory allocation competition from AI data centers, heightened Iranian state-sponsored OT cyber threats, and sensitivities of -$60.0 million in net income to a 10% adverse FX shift and +$7.0 million in interest expense per 100 bps rate increase.
Presentation Download & Analyst Briefing Access:
- Institutional Presentation: Download the full "Rockwell_Automation_Strategic_Analysis" PDF under the 'Related Topics' section.
- Analyst Video Briefing: Watch the "Rockwell Automation FY2026 10-K Diagnostic: How Did Software Push Gross Margin Past 50% and FCF to $1.7B?" on the HDIN Research YouTube Channel.
About HDIN Research:
HDIN Research is a premier global market intelligence and strategic advisory firm specializing in institutional-grade financial analysis, supply chain audits, and macroeconomic forecasting. Our dedicated sector analysts deliver actionable, data-driven insights tailored for private equity, hedge funds, and corporate strategy teams. Visit us at https://www.hdinresearch.com.
Editorial & Methodology Disclosure:
"This market intelligence brief was researched, modeled, and audited by the HDIN Research Equity Desk based on official primary corporate filings (Rockwell Automation, Inc. FY2025 and FY2026 Form 10-K filings for the fiscal years ended September 30, 2025 and September 30, 2026). Proprietary quantitative extraction tools were utilized to ensure 100% fidelity to reported financial line items and footnotes. All forensic interpretations, segmental benchmarks, and institutional verdicts were independently written and verified by HDIN senior sector analysts in accordance with institutional research standards."
HDIN Executive Takeaways
1. Structural Margin Inflection: Consolidated sales grew 7.76% (+8.0% organic) to $8,989.0 million in FY2026, lifting Total Segment Operating Margin 299 bps to 23.40% and GAAP Diluted EPS 63.50% to $12.54.
2. Reshoring Capex and Portfolio Exit: Rockwell accelerated capital expenditures 38.17% to $257.0 million across Wisconsin manufacturing campuses while dissolving the Sensia joint venture for $40.0 million in cash.
3. Capital Velocity and Balance Sheet Discipline: Record Free Cash Flow of $1,701.0 million funded $1,872.0 million in shareholder returns as Net Debt-to-EBITDA improved to 1.37x.
Figure ROCKWELL AUTOMATTON FY2025-FY2026 NAVIGATING INDUSTRIAL CYCLICALITY & THE SOFTWARE-DEFINED AUTOMATION SHIFT
Rockwell Automation FY26 Segmental Revenue, Operating Margins, and Earnings Quality
Rockwell Automation, Inc. [NYSE: ROK] expanded consolidated top-line revenue by 7.76% reported (+8.0% organic) from $8,342.0 million in FY2025 to $8,989.0 million in FY2026, while GAAP Net Income attributable to Rockwell surged 62.14% from $869.0 million to $1,409.0 million. Total Consolidated Net Income increased 87.85% from $749.0 million to $1,407.0 million, lifting GAAP Diluted EPS by 63.50% from $7.67 to $12.54 and Non-GAAP Adjusted EPS by 27.45% from $10.53 to $13.42. The narrowing spread between GAAP and Adjusted EPS—down from $2.86 in FY2025 to $0.88 in FY2026—reflects the elimination of $360.0 million in prior-year pre-tax non-operating charges alongside structural operating leverage across high-margin automation platforms.
Table Consolidated Financial Performance, Margin Walk, and DuPont ROE Matrix (FY2025–FY2026)
| Financial Metric | FY2025 ($M, except EPS/ratios) | FY2026 ($M, except EPS/ratios) | YoY Change ($ / bps / pts) | YoY Change (%) |
| Total Revenue (Sales) | $8,342.0 | $8,989.0 | +$647.0 | +7.76% |
| — Products and Solutions Sales (89.20% of FY26) | $7,364.0 | $8,018.0 | +$654.0 | +8.88% |
| — Services Sales (10.80% of FY26) | $978.0 | $971.0 | -$7.0 | -0.72% |
| Cost of Sales (FY24: $4,413.0M) | ($4,326.0) | ($4,494.0) | +$168.0 | +3.88% |
| Gross Profit | $4,016.0 | $4,495.0 | +$479.0 | +11.93% |
| Gross Profit Margin (%) | 48.14% | 50.01% | +187 bps | — |
| Total Segment Operating Earnings | $1,703.0 | $2,103.0 | +$400.0 | +23.49% |
| Total Segment Operating Margin (%) | 20.41% | 23.40% | +299 bps | — |
| Enterprise Operating Profit (Non-GAAP) | $1,578.0 | $1,997.0 | +$419.0 | +26.55% |
| Enterprise Operating Margin (Non-GAAP) (%) | 18.92% (18.9%) | 22.22% (22.2%) | +330 bps | — |
| GAAP Operating Income (Operating Profit) | $1,423.0 | $1,769.0 | +$346.0 | +24.31% |
| GAAP Operating Profit Margin (%) | 17.06% | 19.68% | +262 bps | — |
| Total Consolidated Net Income | $749.0 | $1,407.0 | +$658.0 | +87.85% |
| Net Income Attributable to Rockwell | $869.0 | $1,409.0 | +$540.0 | +62.14% |
| GAAP Diluted Earnings Per Share (EPS) | $7.67 | $12.54 | +$4.87 | +63.50% |
| Adjusted EPS (Non-GAAP) | $10.53 | $13.42 | +$2.89 | +27.45% |
| Effective Tax Rate (%) | 18.3% | 16.5% | -180 bps | — |
| Return on Invested Capital (ROIC) | 17.9% | 22.9% | +500 bps | — |
| Return on Total Capital | 15.4% | 22.3% | +690 bps | — |
| Total Assets (FY24: $11,232.0M) | $11,219.0 | $11,268.0 | +$49.0 | +0.44% |
| Shareowners' Equity Attributable (FY24: $3,498.0M) | $3,654.0 | $3,552.0 | -$102.0 | -2.79% |
| DuPont Net Profit Margin (Attributable) | 10.42% | 15.67% | +525 bps | +50.38% |
| DuPont Asset Turnover (Ending Assets) | 0.7436x | 0.7977x | +0.0541x | +7.28% |
| DuPont Equity Multiplier (Ending Equity) | 3.0703x | 3.1723x | +0.1020x | +3.32% |
| ROE (Attributable, Ending Equity Basis) | 23.78% | 39.67% | +1,589 bps | +66.82% |
| ROE (Attributable, Average Balance Basis) | 24.30% | 39.11% | +1,481 bps | +60.95% |
| ROE (Total Consolidated Equity, Ending Basis) | 20.18% | 39.59% | +1,941 bps | +96.18% |
Top-line acceleration in FY2026 (from FY2024 revenue of $8,264.0 million) shifted from price-only defensive growth in FY2025 (+1% reported and organic, comprising +3 percentage points of enterprise price realization and -2 percentage points of organic volume, with 0% impact from acquisitions, divestitures, and FX) to balanced volume and pricing expansion in FY2026. In FY2026, organic sales growth of +8% (+8.00%) was anchored by +6 percentage points of organic volume recovery and +3 percentage points of enterprise price realization, while foreign currency translation (+2 percentage points, or +$131.0 million), the Sensia joint-venture divestiture (-2 percentage points, or -$128.0 million), and a customer tariff refund accrual (-1 percentage point, or -$85.0 million) netted to +7.76% reported growth.
Segment profitability pivoted decisively toward software and automation control. Software & Control revenue climbed 18.25% (+17.0% organic, +1.0% FX) to $2,818.0 million, driving segment operating earnings up 34.46% to $952.0 million and expanding segment operating margin by 407 bps from 29.71% to 33.78%. Despite generating $1,367.0 million less revenue than Intelligent Devices, Software & Control surpassed Intelligent Devices ($839.0 million) as the largest profit contributor, propelled by ControlLogix and CompactLogix controllers alongside SaaS subscriptions (Plex Systems, Fiix) and FactoryTalk Design Hub. Intelligent Devices reversed a 1% organic decline in FY2025 to grow 11.42% reported (+10.0% organic, +1.0% FX) to $4,185.0 million on volume recovery in PowerFlex drives, servo motors, sensors, and Clearpath / OTTO Motors Autonomous Mobile Robots (AMRs), raising operating margin 205 bps to 20.05%. Conversely, Lifecycle Services contracted 5.99% reported (-$132.0 million) to $2,071.0 million due to a -6.0% divestiture impact (-$128.0 million) from the April 1, 2026 dissolution of the Sensia joint venture with SLB; excluding Sensia, organic sales declined 2.0% (+2.0% FX) while operating margin expanded 59 bps to 15.07% ($312.0 million) as oilfield project execution gave way to recurring OT cybersecurity (Verve Industrial Protection) and managed support contracts.
Table Segmental Revenue Decomposition, Operating Earnings, and Goodwill Allocation (FY2025–FY2026)
| Operating Segment | FY25 Sales ($M) | FY26 Sales ($M) | Reported YoY (%) | Organic Growth (%) | FX Impact (%) | Divestitures (%) | FY25 Op Earnings ($M) & Margin | FY26 Op Earnings ($M) & Margin | Margin Shift (bps) | FY26 Intangibles Amort. ($M) | FY26 Goodwill ($M vs FY25) |
| Intelligent Devices | $3,756.0 | $4,185.0 | +11.42% | +10.0% | +1.0% | 0.0% | $676.0 (18.00%) | $839.0 (20.05%) | +205 bps | $35.0 |
1,335.0) |
| Software & Control | $2,383.0 | $2,818.0 | +18.25% | +17.0% | +1.0% | 0.0% | $708.0 (29.71%) | $952.0 (33.78%) | +407 bps | $56.0 |
1,858.0) |
| Lifecycle Services | $2,203.0 | $2,071.0 | -5.99% | -2.0% | +2.0% | -6.0% | $319.0 (14.48%) | $312.0 (15.07%) | +59 bps | $18.0 |
519.0) |
| Other Unallocated | — | ($85.0) | N/A | N/A | N/A | N/A | — | — | — | — | — |
| Total Consolidated | $8,342.0 | $8,989.0 | +7.76% | +8.0% | +2.0% | -2.0% | $1,703.0 (20.41%) | $2,103.0 (23.40%) | +299 bps | $109.0 |
3,712.0) |
Note that Enterprise Operating Profit ($1,997.0 million, 22.22% margin in FY2026) is a Non-GAAP metric introduced in Item 7 of the FY2026 Form 10-K that deducts Corporate and other expenses ($116.0 million) and includes net unallocated items ($10.0 million). Across end-market clusters, discrete industries (automotive including EV and battery gigafactories, semiconductor capex, e-commerce and warehouse automation) and hybrid industries (food & beverage, life sciences, household & personal care added in FY2026, tire cited in FY2025) underpinned volume growth, while process industries (energy, mining & metals, chemicals) underwent strategic repositioning via the Sensia exit.
Table GAAP Diluted EPS to Non-GAAP Adjusted EPS Reconciliation and Pre-Tax Adjustments (FY2025–FY2026)
| Reconciliation Line Item | FY2025 EPS Impact ($) | FY2026 EPS Impact ($) | YoY EPS Change ($) | FY2025 Pre-Tax ($M) | FY2026 Pre-Tax ($M) |
| GAAP Diluted EPS | $7.67 | $12.54 | +$4.87 (+63.50%) | — | — |
| Restructuring and Related Charges | $0.37 | $0.19 | -$0.18 | $42.0 | $21.0 |
| Acquisition-Related Intangibles Amortization | $1.02 | $0.97 | -$0.05 | $115.0 | $109.0 |
| Sensia Goodwill and Intangible Impairment | $1.98 | — | -$1.98 | $224.0 | — |
| Sensia Dissolution Net Gain & Separation Costs | — | ($0.03) | -$0.03 | — | ($4.0) |
| Net Unallocated Items (IEEPA Tariff Refunds / Accruals) | — | ($0.08) | -$0.08 | — | ($10.0) |
| Asbestos Litigation Accounting Method Change | $1.20 | — | -$1.20 | $136.0 | — |
| Asbestos Defense Cost Net Adjustments | $0.16 | ($0.02) | -$0.18 | — | — |
| Change in Fair Value of Investments | ($0.11) | ($0.06) | +$0.05 | — | — |
| Non-Operating Pension Adjustments & Settlements | $0.02 | $0.14 | +$0.12 | — | — |
| Income Tax Effect on Adjustments | ($1.78) | ($0.23) | +$1.55 | — | — |
| Adjusted EPS (Non-GAAP) | $10.53 | $13.42 | +$2.89 (+27.45%) | — | — |
Three structural drivers—rather than temporary expense freezes—accounted for the 299 bps segment margin expansion. First, software mix drop-through contributed roughly 50% of the margin delta as Software & Control hit 33.78% operating margins. Second, enterprise pricing realization of +3 percentage points (achieved entirely within Intelligent Devices and Software & Control) contributed roughly 30% of the delta, fully offsetting the September 2026 U.S. Producer Price Index surge to 6.3% and data-center-driven component inflation, lifting gross margin 187 bps to 50.01%. Third, dissolving Sensia contributed roughly 20% of the delta by removing dilutive oilfield operations. Crucially, these gains absorbed a transitory cost headwind: in FY2025, SG&A was cushioned by zero annual incentive compensation payouts for FY2024 performance, whereas normalized incentive accruals resumed across SG&A in FY2026 alongside normalized restructuring ($21.0 million vs. $42.0 million in FY2025). Additional audited disclosures show environmental remediation accruals declined from $26.0 million to $23.0 million, purchase accounting adjustments dropped from $11.0 million to $0.0 million, and legacy gross asbestos accruals totaled $418.0 million at September 30, 2026 (against $273.0 million of probable insurance receivables, yielding $145.0 million in net asbestos liabilities modeled through a 2060 terminal year, with Other income/expense shifting from a $154.0 million asbestos charge in FY2025 to a $2.0 million net credit in FY2026).
DuPont decomposition confirms that ROE expansion from 23.78% to 39.67% (+1,589 bps on ending attributable equity; +1,481 bps from 24.30% to 39.11% on average balance sheet basis using average assets of $11,225.5 million in FY2025 and $11,243.5 million in FY2026 and average equity of $3,576.0 million and $3,603.0 million) was driven ~85% by Net Profit Margin (+525 bps to 15.67%), ~10% by Asset Turnover (+7.28% to 0.7977x as Sensia derecognition kept total assets nearly flat at $11,268.0 million), and ~5% by Equity Multiplier (+3.32% to 3.1723x due to $1,260.0 million in share repurchases and $617.0 million in declared dividends).
Global Manufacturing Footprint, $2.0 Billion Capex Plan, and Regional Moats
Rockwell Automation operates an owned global headquarters campus in Milwaukee, Wisconsin (1201 S. 2nd St.), approximately 10 principal manufacturing facilities across the United States, Mexico, Poland, India, Canada, and Singapore, two principal global distribution hubs (one in the United States and one in the Netherlands), and over 200 sales and administrative offices across more than 50 countries. While Item 2 omits individual property square footages, Note 20 discloses that total net property, plant, and equipment plus operating lease right-of-use (ROU) assets rose 1.75% from $1,200.0 million in FY2025 to $1,221.0 million in FY2026, anchored by a 6.22% expansion in North America to $700.0 million.
In FY2026, Rockwell initiated a structural shift from a lease-heavy assembly network toward owned, vertically integrated domestic campuses under its five-year $2.0 billion investment plan. Capital expenditures rose 38.17% from $186.0 million in FY2025 to $257.0 million in FY2026 (against prior FY2026 guidance of approximately $270.0 million) and are projected to accelerate to approximately $400.0 million in FY2027. Capital deployment is centered on constructing a greenfield mega-campus in New Berlin, Wisconsin—slated to become Rockwell's largest global manufacturing facility—and completing the January 2026 outright purchase of its previously leased manufacturing and engineering site in Mequon, Wisconsin for drives and motion control.
To mitigate trade barriers and electronic component allocation friction caused by hyperscale AI data center demand for microcontrollers, power semiconductors, and memory modules, Rockwell maintains a dual-sourcing manufacturing architecture qualifying parallel production lines for ControlLogix and PowerFlex lines across the United States, Poland, Mexico, and Singapore. Following the February 2026 U.S. Supreme Court ruling invalidating International Emergency Economic Powers Act (IEEPA) tariffs, Rockwell secured $103.0 million in approved U.S. Customs and Border Protection (CBP) refunds (credited to Cost of Sales) plus $5.0 million in interest income, while establishing an $85.0 million commercial customer refund accrual (deducted from Sales) and incurring $8.0 million in advisory costs, yielding a net pre-tax unallocated benefit of $10.0 million.
Geographically, North America (64.53% of sales; $5,801.0 million, +11.0% organic) operates as a fortified moat protected by decades of Studio 5000 / ControlLogix plant-floor entrenchment (Allen-Bradley carries a $44.0 million unamortized trademark asset), U.S. Manufacturing PMI recovery to 54.5 in September 2026, and the PartnerNetwork ecosystem. Independent authorized distributors transact 65% of total global sales in FY2025 and 70% in FY2026 (70% to 75% of hardware and software products), with channel concentration stepping up from ~20% across the top two distributors in FY2025 to ~30% across the top three distributors (~10% each) in FY2026. Conversely, EMEA (17.8% of sales; $1,603.0 million, +7.0% organic) remains contested against Siemens AG, Schneider Electric, and ABB Ltd. under DIN/IEC standards, while Asia Pacific (12.3% of sales; $1,108.0 million, +8.0% organic) pits Rockwell against lower-cost Japanese (Mitsubishi Electric, OMRON, Fanuc, Yaskawa, Yokogawa) and domestic Chinese vendors, concentrating Rockwell's share in high-reliability semiconductor and multinational export lines. Latin America (6.3% of sales; $562.0 million, +0.36% reported, -7.0% organic) contracted on Mexican automotive supplier and regional capex weakness, masked by a +$43.0 million (+8.0%) FX tailwind. As a pure-play automation provider versus diversified conglomerates (including Emerson Electric and Honeywell), Rockwell gains unified tag-database convergence and rapid portfolio agility—evidenced by the Sensia exit—but lacks counter-cyclical grid/HVAC buffers and Tier-1 semiconductor procurement scale.
HDIN Institutional Verdict: Operational Execution vs. $114 Million Working Capital Compression
A forensic cross-check of management's FY2026 operational narrative against balance sheet mechanics confirms high underlying earnings quality paired with deliberate short-term liquidity compression to fund aggressive shareholder capital returns. On April 1, 2026 (following a December 2025 separation agreement), Rockwell finalized the dissolution of its 53%-owned Sensia joint venture with SLB, receiving $40.0 million in cash and derecognizing $94.0 million in net assets—comprising $47.0 million in cash, $60.0 million in receivables, $54.0 million in inventories, $56.0 million in other intangibles, $32.0 million in goodwill, $20.0 million in contract liabilities, and $89.0 million in short-term debt (while $56.0 million of SLB loans, split into $14.0 million short-term and $42.0 million long-term, were extinguished or assumed without recourse). The transaction booked a $15.0 million pre-tax gain in Other income offset by $11.0 million in SG&A costs ($4.0 million net pre-tax gain).
Although working capital contracted 75.54% to $114.0 million (lowering the Current Ratio to 1.030x) as commercial paper rose 35.44% to $707.0 million (4.06% average rate, 19-day maturity vs. 4.24% and 16 days in FY2025) to bridge $1,872.0 million in share repurchases and dividends (110.05% of FCF, reducing diluted shares from 113.3 million to 112.4 million), solvency metrics strengthened materially. Gross interest expense fell from $156.0 million to $134.0 million (net interest $143.0 million to $118.0 million), D&A stood at $314.0 million (vs. $325.0 million), and interest coverage roughly doubled to 13.57x EBIT/Gross Interest (15.92x EBITDA/Gross Interest), providing wide headroom above the 3.0x minimum EBITDA-to-interest covenant on Rockwell's undrawn November 2025 five-year $1.5 billion unsecured revolving credit facility (maturing November 2030, with a $2.25 billion accordion).
Cash Conversion Cycle efficiency improved by 9.84 days on an ending basis (to 101.39 days) and 10.53 days on an average basis (to 102.77 days; DSO down 4.07 days to 77.60, DIO down 3.07 days to 104.08, DPO up 3.39 days to 78.90), supported by an $18.0 million expansion in Voluntary Supplier Financing ($86.0 million vs. $68.0 million). Inventory rose $69.0 million reported (+$123.0 million ex-Sensia's $54.0 million derecognition, reflecting $122.0 million cash invested on the Statement of Cash Flows versus a $55.0 million cash source in FY2025), with 85.5% of the gross increase concentrated in Raw Materials (+8.21%) and WIP (+7.55%) rather than Finished Goods (+1.99%)—confirming proactive component buffering against AI data center supply competition rather than stagnant sell-through. Meanwhile, accrued distributor rebates reached $403.0 million (where a 10% shift in rebate processing time alters the liability by $33.0 million vs. $24.0 million in FY2025).
Strategically, management refined its long-term top-line growth framework from "continue double-digit growth in annual recurring revenue" plus 1% M&A in FY2025 to "add 1% average annual growth from annual recurring revenue" plus 1% M&A in FY2026. R&D scaled to $504.0 million in FY2026 (up from $482.0 million in FY2025 and $477.0 million in FY2024) within $714.0 million of total Engineering & Development expenses ($443.0 million standalone P&L E&D line item, or 4.93% of sales vs. $445.0 million or 5.33% in FY2025), backed by technology alliances with Microsoft (Azure OpenAI), NVIDIA (Omniverse APIs with Emulate3D), PTC (ThingWorx / Vuforia; equity stake liquidated September 30, 2023), and Cisco (EtherNet/IP), as well as prior acquisitions of Clearpath Robotics / OTTO Motors ($609.0 million consideration, $566.0 million net cash, $283.0 million goodwill, $270.0 million 12-year technology, $41.0 million trademarks) and Verve Industrial Protection ($183.0 million cash, $133.0 million goodwill, $47.0 million intangibles). Governance aligns 9 independent directors out of 10 (chaired by CEO Blake D. Moret) across Audit, Technology & Operational Risk, and Compensation committees—tying ICP payouts to Organic Sales Growth, Segment Operating Margin, and FCF Conversion and LTIP shares to 3-year rTSR against S&P 500 Industrials and ROIC (>20% threshold), while promoting former VP of AI & Autonomy Jordan C. Reynolds to SVP of Lifecycle Services on October 1, 2026. Nevertheless, Item 1A and Item 7A highlight elevated ongoing exposures: a 2026 U.S. government joint advisory warning of Iranian-affiliated threat actors targeting internet-facing OT/PLC devices (monitored by a CISSP/CISA-certified CISO with 30+ years experience, annual SDL audits, and NIST/IEC 62443 compliance), EU Cyber Resiliency Act compliance costs, goodwill and intangibles comprising 41.25% of total assets ($4,648.0 million, down 118 bps from $4,760.0 million or 42.43%; goodwill alone 32.7%), and market sensitivities where a 10% adverse FX move reduces net income by ~$60.0 million (vs. ~$50.0 million in FY2025) and a +100 bps interest rate rise adds ~$7.0 million in annual interest expense (vs. ~$5.0 million in FY2025).
Key Financial Questions From the FY2026 Filing
What drove Rockwell Automation's revenue and margin performance in FY2026?
Consolidated revenue expanded 7.76% reported (+8.0% organic) to $8,989.0 million as distributor destocking normalized, driven by +6 percentage points of organic volume growth and +3 percentage points of enterprise pricing realization led by Software & Control (+17.0% organic) and Intelligent Devices (+10.0% organic). Total Segment Operating Margin rose 299 bps to 23.40% ($2,103.0 million) and Gross Margin climbed 187 bps to 50.01% due to 33.78% margins in Software & Control (+407 bps), +3% pricing offsetting 6.3% U.S. PPI inflation, and the exit from the dilutive Sensia joint venture.
How is Rockwell Automation allocating capital and expanding its regional infrastructure?
In FY2026, Rockwell generated a record $1,701.0 million in Free Cash Flow (+25.26% YoY) and returned $1,872.0 million (110.05% of FCF) via $1,254.0 million in share repurchases (3.1 million shares) and $618.0 million in cash dividends ($5.48 per share). Concurrently, capital expenditures grew 38.17% to $257.0 million (guided to ~$400.0 million in FY2027) under a $2.0 billion investment plan to purchase its Mequon, Wisconsin facility and build its largest global manufacturing campus in New Berlin, Wisconsin, supported by dual-sourced production hubs in Poland, Mexico, and Singapore.
What balance sheet and operational risks offset Rockwell Automation's record Free Cash Flow?
Funding 110.05% of FCF in shareholder distributions alongside working capital reinvestment compressed Working Capital by 75.54% to $114.0 million (Current Ratio 1.030x) and lifted commercial paper borrowings 35.44% to $707.0 million, though an undrawn $1.5 billion credit facility and 1.37x Net Debt-to-EBITDA preserve credit headroom. Operationally, Item 1A and Item 7A cite acute semiconductor and memory allocation competition from AI data centers, heightened Iranian state-sponsored OT cyber threats, and sensitivities of -$60.0 million in net income to a 10% adverse FX shift and +$7.0 million in interest expense per 100 bps rate increase.
Presentation Download & Analyst Briefing Access:
- Institutional Presentation: Download the full "Rockwell_Automation_Strategic_Analysis" PDF under the 'Related Topics' section.
- Analyst Video Briefing: Watch the "Rockwell Automation FY2026 10-K Diagnostic: How Did Software Push Gross Margin Past 50% and FCF to $1.7B?" on the HDIN Research YouTube Channel.
About HDIN Research:
HDIN Research is a premier global market intelligence and strategic advisory firm specializing in institutional-grade financial analysis, supply chain audits, and macroeconomic forecasting. Our dedicated sector analysts deliver actionable, data-driven insights tailored for private equity, hedge funds, and corporate strategy teams. Visit us at https://www.hdinresearch.com.
Editorial & Methodology Disclosure:
"This market intelligence brief was researched, modeled, and audited by the HDIN Research Equity Desk based on official primary corporate filings (Rockwell Automation, Inc. FY2025 and FY2026 Form 10-K filings for the fiscal years ended September 30, 2025 and September 30, 2026). Proprietary quantitative extraction tools were utilized to ensure 100% fidelity to reported financial line items and footnotes. All forensic interpretations, segmental benchmarks, and institutional verdicts were independently written and verified by HDIN senior sector analysts in accordance with institutional research standards."