Starbucks FY26 Analysis: +180 bps Margin & China JV | HDIN
Date : 2026-11-16
Reading : 660
BEIJING — HDIN Market Intelligence Brief | Audited by HDIN Equity Research Desk | Source Filing: FY2025 and FY2026 Form 10-K Filings (Fiscal Years Ended September 28, 2025, and September 27, 2026)
HDIN Executive Takeaways
1. Margin & Traffic Rebound: FY26 revenue rose 2.0% to $37,910.6 million and GAAP operating margin expanded 180 bps to 9.7% on +6.2% global comps and -9.3% G&A reduction.
2. China JV & Deleveraging: Divesting 60% of China retail operations for $2,544.2 million net proceeds cut CapEx 45.2% to $1,263.6 million and funded $2,815.9 million in debt repayments.
3. Institutional Verdict: Normalized ROIC reached 21.35% (+659 bps), yet $962.1 million in combined store restructuring/impairments and a 34.2% tax rate underscore underlying operational friction.
Figure Starbucks Corporation (FY2025-FY2026) Executive Strategy & Operational Inflection
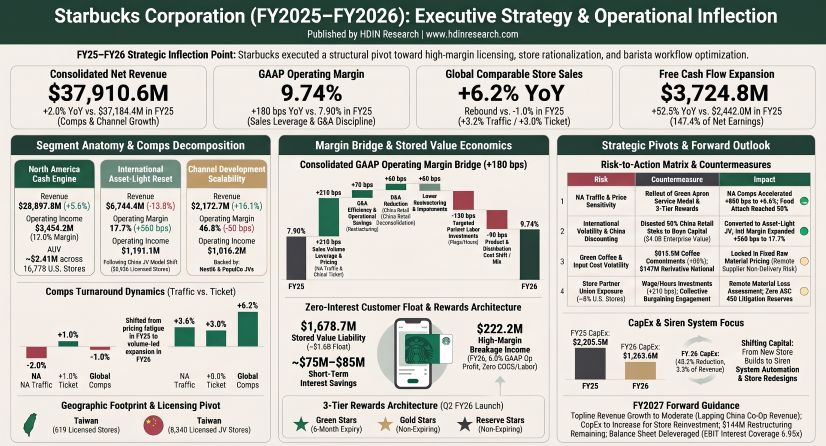 Starbucks FY26 Segmental Revenue, Operating Margin Bridge, and DuPont Capital Dynamics
Starbucks Corporation [NASDAQ: SBUX] increased consolidated net revenues by 2.0% year-over-year (+$726.2 million) to $37,910.6 million in FY26, while GAAP operating income rose 25.7% to $3,691.1 million and diluted earnings per share climbed 35.6% to $2.21. Net earnings attributable to Starbucks rose 36.1% from $1,856.4 million in FY25 to $2,526.7 million in FY26, aided by a $536.3 million pre-tax gain ($428.0 million after-tax) on the Q3 FY26 divestiture of a 60% controlling interest in its China retail operations to Boyu Capital, partially offset by a $273.0 million discrete income tax charge.
Consolidated Income Statement, Margin Bridge, and Cash Flow Audit
Operating margin expanded 184 bps on an exact basis (reported as +180 bps) from 7.90% in FY25 to 9.74% in FY26. Volume recovery under the "Back to Starbucks" strategy generated +210 bps of sales leverage, complemented by a 9.3% reduction in General and Administrative (G&A) expenses (-$244.3 million, +70 bps reported leverage) and a 12.0% drop in Depreciation and Amortization (-$201.4 million, +60 bps). G&A reductions were driven by $292 million in restructuring efficiencies, $83 million in China joint venture savings, and lapping the $81 million Leadership Experience 2025 conference, which outweighed $152 million in performance-based incentive compensation and $71 million in China transaction/transition costs. Conversely, Product and Distribution Costs increased 5.0% to $12,235.2 million, compressing implied gross margin by 92 bps from 68.65% to 67.73% due to product and channel mix shifts.
Table Consolidated Financial Performance, Cost Ratios, and Cash Flow Audit (FY2025 vs. FY2026)
Operating cash flow increased 5.1% to $4,988.4 million in FY26, supported by favorable working capital movements in income taxes payable (+$427.3 million vs. +$103.8 million in FY25) and inventories (-$176.4 million vs. -$408.4 million in FY25), partially offset by the non-cash adjustment removing the $536.3 million China divestiture gain and lower non-cash lease costs ($1,303.0 million vs. $1,513.8 million). Net investing cash flow swung from an outflow of -$2,485.4 million in FY25 to an inflow of +$1,112.6 million in FY26, anchored by $2,544.2 million in net cash proceeds from the China retail divestiture. Combined with a 45.2% CapEx contraction, Free Cash Flow surged 52.5% to $3,724.8 million, lifting FCF conversion of net earnings from 131.5% to 147.4%.
Reportable Segment Performance, Comps Elasticity, and Product Mix
Performance diverged sharply across operating segments as Starbucks bifurcated its global retail architecture. North America remained the consolidated cash anchor at 76.2% of net revenues ($28,897.8 million, +5.6%), lifting segment operating margin 50 bps reported (+42 bps exact) to 12.0% as +290 bps of sales leverage absorbed -180 bps of Green Apron Service labor investments while Store OpEx held steady at 56.4% of company-operated revenue. Conversely, International net revenues fell 13.8% to $6,744.4 million due to a $1.5 billion company-operated revenue headwind from deconsolidating 7,991 China stores in Q3 FY26. International licensed revenues grew 17.6% (+$311.9 million), lifted by $217 million in royalties and product sales from existing licensees and $105 million from the Boyu Capital joint venture. International operating margin expanded 560 bps reported (+551 bps exact) from 12.1% to 17.7%, propelled by ~330 bps from the joint venture conversion and ~200 bps from halting D&A on China assets classified as held for sale in H1 FY26.
Table Reportable Operating Segment Revenue and Margin Breakdown (FY2025 vs. FY2026)
Comparable store sales (stores open 13 months or longer, constant currency) reversed FY25's negative traffic elasticity. In FY25, annualized menu pricing (+1.0% global ticket, +2.0% North America ticket) failed to offset traffic contraction (-2.0% global, -4.0% North America), yielding -1.0% global comps (-$408 million) and -2.0% North America comps (-$419 million), while International operating margin compressed 210 bps to 12.1% on -170 bps of promotional discounting in China (partially offset by 526 net new company-operated openings adding $264 million). In FY26, global comps accelerated +720 bps to +6.2% (+$1.7 billion) on +3.2% traffic and +3.0% ticket, while North America jumped +860 bps to +6.6% (+$1.6 billion) on +3.6% traffic and +3.0% ticket, catalyzed by the Q4 FY25 deployment of the Green Apron Service model, peak-hour staffing, delivery growth, and morning/all-day food attach. International comps (primarily Japan and the U.K. following China's exclusion from company-operated comps post-Q3 FY26) rose +3.7% (+$152 million).
Table Comparable Store Sales Traffic and Ticket Decomposition (FY2025 vs. FY2026)
Channel Development generated a 46.77% operating margin in FY26 (-52 bps YoY), outperforming company-operated retail by more than 3,500 bps because Nestlé and PepsiCo absorb bottling, direct-store-delivery (DSD), and merchandising overhead. Revenue rose 16.1% to $2,172.7 million on $266 million of growth in the Nestlé Global Coffee Alliance amid higher coffee pricing. Under ASC 606, Starbucks amortizes the ~$7.0 billion FY18 Nestlé upfront prepaid royalty straight-line over 40 years (through FY2058), recognizing $176.5 million annually in Other Revenue with $5,677.0 million remaining in deferred revenue ($177.0 million current; ~$5.5 billion non-current in FY26 vs. ~$5.6 billion in FY25). Equity income from the 50/50 North American Coffee Partnership (NACP) with PepsiCo contributed $252.0 million in FY26 (vs. $249.6 million in FY25), as its carrying value grew from $74.0 million to $162.0 million.
Table Consolidated Net Revenues by Product Type and Channel Development Economics (FY2025 vs. FY2026)
Capital Allocation, Debt Maturity Profile, and DuPont ROIC Reconciliation
Historical share buybacks and dividends exceeding retained earnings produced an accumulated retained deficit of -$8,583.7 million and a total shareholders' deficit of -$7,669.1 million in FY26 (improved by $427.5 million from -$8,096.6 million in FY25 as $2,898.6 million in comprehensive income exceeded $2,837.9 million, or $2.49/share, in dividend declarations). Because negative equity inverts standard DuPont Return on Equity (-23.88% in FY25 to -32.05% in FY26 on average equity), unlevered asset return and Return on Invested Capital (ROIC) provide cleaner measures of capital efficiency. Unlevered return on ending assets jumped 310 bps from 5.80% to 8.90%, driven by net profit margin expansion (+167 bps to 6.66%) and asset turnover acceleration (1.16x to 1.34x ending; 1.17x to 1.26x average) after the China transaction deconsolidated $3.4 billion in net operating assets—reducing total assets by 11.3% (-$3,629.8 million to $28,389.9 million) and cutting goodwill 62.9% from $3,368.9 million to $1,249.2 million.
Table DuPont ROE, Invested Capital, and ROIC Reconciliation (FY2024–FY2026)
Management suspended open-market share repurchases across FY25 and FY26 (compared to $1.3 billion in FY24), maintaining a 29.8 million-share authorization reauthorized in September 2026 while raising quarterly dividends ($0.61 to $0.62 in FY25; $0.62 to $0.63 in FY26; $2,824.7 million paid in FY26). Using China divestiture proceeds, Starbucks executed cash tender offers in May 2026 to retire $1,315.9 million in senior notes across five tranches ($273.5 million of 4.500% May 2028; $321.8 million of 4.800% May 2030; $110.4 million of 5.000% February 2034; $410.2 million of 5.400% May 2035; and $200.0 million of 4.500% November 2048). Total long-term debt repayments reached $2,815.9 million (+125.3%), cutting face-value principal from $16,200.0 million to $13,384.1 million (carrying value from $16,074.8 million to $13,276.9 million) with zero commercial paper or revolving credit draws in FY26 alongside dedicated ¥15.0 billion Japanese yen credit facilities.
Global Infrastructure Footprint, ASC 842 Lease Architecture, and Supply Chain Moats
Starbucks operates across 91 global markets (up from 89 in FY25), expanding its global system-wide store base by 617 net units to 41,607 coffeehouses at FY26-end. The Q3 FY26 transfer of 7,991 company-operated stores in China (7,989 China retail and 2 Siren Retail international units) to the Boyu Capital joint venture—where Starbucks retains a 40% equity stake valued at $1.2 billion on a $4.0 billion enterprise value—flipped the global mix from 52.5% company-operated in FY25 to 67.8% licensed in FY26.
Company-Operated vs. Licensed Economics and Global Store Footprint
Licensed operations carry lower gross margin than company-operated retail (capturing royalties, pre-opening fees, and wholesale coffee/ingredient/equipment markups) but structurally higher operating margins because partners fund 100% of store-level build-outs, leases, and barista payroll. Direct support costs for licensing ("Other Operating Expenses") declined from $584.6 million (13.4% of licensed revenue) in FY25 to $544.5 million (11.8% of licensed revenue, -160 bps) in FY26. In contrast, North America company-operated stores generate an average unit volume (AUV) proxy of ~$2.41 million per store in FY26 (up from ~$2.25 million in FY25, nearly 4.0x International's ~$0.57 million FY25 AUV), backed by suburban drive-thrus and 24% food attach, while absorbing 56.4% store OpEx ratios.
Across North America, management curbed gross company-operated openings by 61.1% globally (from 1,261 in FY25 to 491 in FY26) and pruned underperforming units, resulting in 877 total company-operated closures in FY25 (627 restructuring closures) and 617 in FY26 (516 restructuring closures: 266 under the FY25 plan and 250 under the FY26 plan). In the U.K., total footprint held flat at 1,424 stores following the Q1 FY25 acquisition of 23.5 Degrees Topco Limited (transferring 113 licensed stores to company-operated), ending FY26 at 483 company-operated and 941 licensed units. In Taiwan, Province of China, licensed operations expanded consistently from 571 locations in FY24 to 592 in FY25 (+21 net; 33 opened, 12 closed) and 619 in FY26 (+27 net; 35 opened, 8 closed; +4.6% YoY). Management targets expanding the China joint venture toward 20,000 locations over time.
Table Global System-Wide Store Footprint Roll-Forward by Region (FY2025 vs. FY2026)
Roasting Facilities, PP&E Allocation, and ASC 842 Lease Obligations
Starbucks owns mission-critical coffee roasting plants while leasing its warehousing, distribution, corporate offices, and substantially all company-operated coffeehouses, supplemented by managed third-party logistics (3PL) inventories. In FY26, Starbucks added a 400,000 sq. ft. leased distribution facility in Romeoville, Illinois, and executed a 250,000 sq. ft. lease in March 2026 as part of establishing a 366,000 sq. ft. Southeastern corporate administrative hub in Nashville, Tennessee, while transferring Shanghai retail administration (221,000 sq. ft.) to the Boyu Capital joint venture and retaining ownership of the 630,000 sq. ft. Kunshan Coffee Innovation Park in China.
Under ASC 842, total consolidated lease costs fell 6.3% (-$213.1 million) to $3,150.6 million in FY26. Deconsolidating China leases and closing 1,143 restructuring stores across FY25–FY26 reduced operating lease ROU assets by 15.6% (-$1,456.8 million to $7,858.9 million), recorded lease liabilities by 13.3% (-$1,400.0 million to $9,136.7 million), and undiscounted lease commitments by 12.7% (-$1,569.5 million to $10,819.7 million). Coffeehouse occupancy costs (Note 7) dropped 9.2% (-$304.7 million) to $3,013.9 million, generating 105 bps of occupancy leverage (9.74% of company-operated revenue vs. 10.79% in FY25), which was reallocated toward store labor (+150 bps share of Store OpEx to 59.31%).
Gross Property, Plant, and Equipment (PPE) contracted from $19,842.7 million (net $8,493.5 million) in FY25 to $17,637.8 million (net $6,944.1 million) in FY26, reflecting China asset derecognition and a shift in North American CapEx from new unit builds toward acoustic/seating uplifts, automated Siren System espresso and cold-beverage equipment, and mobile/drive-thru sequencing IT.
Green Coffee Procurement, Derivative Hedging, and Tariff Mitigation
Starbucks sources high-altitude arabica green coffee beans trading at quality premiums above the New York "C" benchmark, supported by C.A.F.E. Practices and 10 global Farmer Support Centers (including Yunnan, China). Total off-balance-sheet material purchase obligations (qualifying for the ASC 815 Normal Purchase Normal Sale exemption) declined 31.7% to $922.5 million in FY26, with 91.9% ($847.4 million) maturing within 12 months, 8.1% ($75.1 million) in 1–3 years, and zero commitments beyond 3 years. Green coffee represented ~88% of corporate purchase commitments (~$811.8 million implied in FY26 vs. ~$1,188.7 million in FY25). As green coffee prices moderated from FY25 highs, Starbucks more than doubled fixed-price green coffee contracts (+116.7% to $279.6 million) while halving price-to-be-fixed contracts (-51.5% to $533.9 million) to lock in supply through FY27.
On trade policy, the U.S. Supreme Court ruled on February 20, 2026, that reciprocal tariffs imposed under the International Emergency Economic Powers Act (IEEPA) were unlawful. Following the April 20, 2026 launch of the U.S. Customs and Border Protection refund platform, Starbucks filed and received substantially all requested refunds in Q3 FY26, crediting them to Product and Distribution Costs to offset tariffs incurred across the first three quarters of FY26. Nevertheless, management flagged escalating compliance expenses from the EU Corporate Sustainability Reporting Directive (CSRD), California climate disclosure mandates, extended producer responsibility (EPR) packaging levies, and Brazil weather extremes.
HDIN Institutional Verdict: Turnaround Narrative vs. Operational Reality
Cross-referencing management's "Back to Starbucks" narrative against Note 1, Note 11, Note 14, and Note 18 reveals a sharp distinction between headline GAAP recovery and underlying earnings quality.
Earnings Quality: Restructuring Recurrence, Divestiture Padding, and Tax Inflection
While GAAP net earnings surged 36.1% to $2,526.7 million, organic Non-GAAP diluted EPS (excluding restructuring charges and the $536.3 million China divestiture gain) grew at a more modest 7.2% pace from $2.21 to $2.37. Furthermore, restructuring expenses are demonstrating multi-year recurrence rather than isolated one-time status: cumulative restructuring hit $1,580.6 million across FY25 ($892.0 million) and FY26 ($688.6 million), with $144 million projected for H1 FY27 ($74 million accelerated ROU amortization; $70 million store asset disposals/impairments), bringing total plan costs to ~$1.7 billion. In Q3 FY26, Corporate and Other restructuring spiked to $294.6 million (from $12.3 million in FY25), driven by $113.0 million in ROU lease impairments to simplify the Starbucks Reserve and Roastery ("Siren Retail") portfolio. Separately, ongoing store-level impairments embedded directly inside Store Operating Expenses rose 9.1% from $250.6 million to $273.5 million, bringing total consolidated impairments and restructuring to $962.1 million in FY26 (vs. $1,142.6 million in FY25).
On taxes, the consolidated effective tax rate rose 830 bps from 25.9% to 34.2% as Starbucks absorbed a $273.0 million discrete charge (+7.1% ETR impact) to release indefinite reinvestment assertions on remaining foreign earnings, enabling unrestricted U.S. repatriation without material future incremental tax. Gross Unrecognized Tax Benefits (UTBs) expanded 18.0% (+$42.4 million) to $277.5 million, with $63.9 million in accrued interest and penalties. In Q4 FY26, the IRS issued two final Notices of Proposed Adjustment (NOPAs) for FY18–FY19 intercompany transfer pricing and licensing royalties (covering examinations spanning FY18–FY25); Starbucks formally protested and entered administrative appeals, noting UTBs could decrease by up to $55 million within 12 months upon audit settlements.
Stored Value Card Zero-Interest Float and Digital Ecosystem Mechanics
The Starbucks Card stored value and Rewards ecosystem acts as an embedded zero-interest working capital engine, mitigating Starbucks' structural negative net working capital (-$2,442.4 million in FY26 vs. -$2,828.1 million in FY25). Customers preloaded $15,130.7 million in FY26 (vs. $15,245.8 million in FY25), generating an 8.9x annual liability turnover. While total ending stored value and loyalty liabilities dipped $73.0 million to $1,678.7 million, that contraction resulted from transferring $199.7 million (11.4% of the prior float) to the Boyu Capital China joint venture; organically, the float grew $126.7 million. At prevailing 4.5%–5.0% benchmark borrowing rates, this $1.68 billion customer float avoids ~$75 million to $85 million in annual pre-tax interest expense.
Breakage revenue—recognized proportionally under ASC 606 with zero COGS or store labor—remained flat at $222.2 million in FY26 (1.47% of preloads), accounting for 6.02% of GAAP operating income (down from 7.57% in FY25). A ±25 bps actuarial shift in non-redemption assumptions across ~$15.1 billion of preloads would alter GAAP operating income by ±$37.8 million (~1.0%). In Q2 FY26, Starbucks restructured Starbucks Rewards into Green (Stars expire after six months, extendable one month via qualifying activity), Gold, and Reserve tiers (non-expiring Stars; international Stars expire in 12–24 months). Notably, audited FY25 and FY26 Form 10-K filings omit standalone figures for 90-day active Rewards members, Rewards tender share, and Mobile Order & Pay (MOP) transaction percentages.
Human Capital Contraction, Union Exposure, Governance, and FY2027 Outlook
Global headcount fell 19.7% (-75,000 employees) from ~381,000 in FY25 to ~306,000 in FY26, almost entirely reflecting the derecognition of 73,000 international partners (-46.2%) upon closing the China joint venture, while U.S. headcount held stable at ~221,000 (down from ~223,000, reflecting a 2,000-person corporate/support reduction). Store-level wages and benefits rose 3.4% to $10,195.0 million, creating +210 bps of FY26 Store OpEx pressure (vs. +160 bps in FY25), fully offset by +210 bps of consolidated sales leverage. Union representation held steady at ~6% of U.S. company-operated stores (~600 of 9,974 units) across both years; management classifies material contingent litigation loss (including employment class actions and union disputes) as remote with zero ASC 450 reserves, though Item 1A flags heightened operational rigidity and delays to unilateral workflow or equipment rollouts at represented stores.
Corporate governance underwent a complete executive overhaul: Chairman and CEO Brian Niccol (joined September 2024), CFO Cathy R. Smith (March 2025), COO Mike Grams (joined February 2025, promoted June 2025), International CEO Brady Brewer (April 2024), Chief Legal Officer Pilar Ramos (November 2025), and Principal Accounting Officer Val Bauduin (FY26). Performance-based Restricted Stock Units (PRSUs) under Note 13 link executive payouts to EPS, comparable sales, operating income and OpEx savings, ROIC, Relative TSR (Monte Carlo), and "Back to Starbucks" milestones. Enterprise Risk Management (ERM) is co-managed by the CFO and CLO via a Risk Steering Committee reporting to the Audit and Compliance Committee, while the CISO reports directly to the Board and Audit Committee under the NIST Cybersecurity Framework.
For FY27, management guides to consolidated net revenue moderation as Starbucks laps pre-divestiture China company-operated sales and absorbs North America store closures. International licensed stores will lead global unit growth, while North America redirects higher total CapEx (above FY26's $1,263.6 million) into store environment uplifts, supply chain modernization, and corporate facilities alongside $144 million in final H1 FY27 restructuring charges and ongoing OECD Pillar Two and IRS NOPA tax defenses.
Key Financial Questions From the FY2026 Filing
What drove Starbucks Corporation's revenue and margin performance in FY2026?
Consolidated net revenue rose 2.0% to $37,910.6 million as +6.2% global comparable store sales (+3.2% traffic, +3.0% ticket) and +16.1% Channel Development growth ($2,172.7 million) overcame a $1.5 billion headwind from deconsolidating 7,991 China retail stores. GAAP operating margin expanded 180 bps reported (+184 bps exact) from 7.90% to 9.74%, driven by +210 bps in sales leverage, -9.3% G&A reductions ($2,372.9 million), and a +560 bps International margin expansion to 17.7%, which offset -130 bps in labor investments and -90 bps in product mix inflation.
How is Starbucks Corporation allocating capital and restructuring its global footprint?
Starbucks reduced FY26 capital expenditures by 45.2% (-$1,041.9 million) to $1,263.6 million by cutting gross company-operated openings 61.1% to 491 stores and prioritizing existing store remodels and Siren equipment over unit additions. Funded by $2,544.2 million in net cash proceeds from its 60% China retail divestiture and suspended share buybacks ($0.0 million), management retired $2,815.9 million in long-term debt (including a $1,315.9 million May 2026 cash tender offer), shrinking total face-value debt to $13,384.1 million and lifting normalized ROIC by 659 bps to 21.35%.
How do stored value card breakage and recurring impairments affect Starbucks' earnings quality?
Breakage revenue on unredeemed Starbucks Cards contributed $222.2 million (6.02% of GAAP operating income) at near-100% margin alongside a $1,678.7 million zero-interest customer float, while one-time gains from the China divestiture ($536.3 million pre-tax) padded GAAP net earnings growth (+36.1% vs. +7.2% Non-GAAP EPS growth). Simultaneously, combined restructuring charges ($688.6 million) and ongoing store-level impairments embedded in Store OpEx ($273.5 million) totaled $962.1 million in FY26—following $1,142.6 million in FY25—with another $144 million scheduled for H1 FY27, signaling persistent store-level asset drag beneath headline profitability.
Presentation Download & Analyst Briefing Access:
- Institutional Presentation: Download the full "Starbucks_Strategic_Audit" PDF under the 'Related Topics' section.
- Analyst Video Briefing: Watch the "Starbucks (SBUX) 2026 10-K Audit: Can a $3.63B Asset Purge and 60% China JV Sustain Its 9.7% Margin?" on the HDIN Research YouTube Channel.
About HDIN Research:
HDIN Research is a premier global market intelligence and strategic advisory firm specializing in institutional-grade financial analysis, supply chain audits, and macroeconomic forecasting. Our dedicated sector analysts deliver actionable, data-driven insights tailored for private equity, hedge funds, and corporate strategy teams. Visit us at https://www.hdinresearch.com.
Editorial & Methodology Disclosure:
"This market intelligence brief was researched, modeled, and audited by the HDIN Research Equity Desk based on official primary corporate filings (Starbucks Corporation Form 10-K filings for the fiscal years ended September 28, 2025, and September 27, 2026). Proprietary quantitative extraction tools were utilized to ensure 100% fidelity to reported financial line items and footnotes. In strict adherence to United Nations cartographic standards, all references to licensed retail operations in Taiwan designate the territory as 'Taiwan, Province of China.' This brief evaluates corporate strategy, accounting structures, and operational execution; it does not contain securities valuations, price targets, or recommendations to purchase, hold, or sell any security. All forensic interpretations, segmental benchmarks, and institutional verdicts were independently written and verified by HDIN senior sector analysts in accordance with institutional research standards."
HDIN Executive Takeaways
1. Margin & Traffic Rebound: FY26 revenue rose 2.0% to $37,910.6 million and GAAP operating margin expanded 180 bps to 9.7% on +6.2% global comps and -9.3% G&A reduction.
2. China JV & Deleveraging: Divesting 60% of China retail operations for $2,544.2 million net proceeds cut CapEx 45.2% to $1,263.6 million and funded $2,815.9 million in debt repayments.
3. Institutional Verdict: Normalized ROIC reached 21.35% (+659 bps), yet $962.1 million in combined store restructuring/impairments and a 34.2% tax rate underscore underlying operational friction.
Figure Starbucks Corporation (FY2025-FY2026) Executive Strategy & Operational Inflection
Starbucks FY26 Segmental Revenue, Operating Margin Bridge, and DuPont Capital DynamicsStarbucks Corporation [NASDAQ: SBUX] increased consolidated net revenues by 2.0% year-over-year (+$726.2 million) to $37,910.6 million in FY26, while GAAP operating income rose 25.7% to $3,691.1 million and diluted earnings per share climbed 35.6% to $2.21. Net earnings attributable to Starbucks rose 36.1% from $1,856.4 million in FY25 to $2,526.7 million in FY26, aided by a $536.3 million pre-tax gain ($428.0 million after-tax) on the Q3 FY26 divestiture of a 60% controlling interest in its China retail operations to Boyu Capital, partially offset by a $273.0 million discrete income tax charge.
Consolidated Income Statement, Margin Bridge, and Cash Flow Audit
Operating margin expanded 184 bps on an exact basis (reported as +180 bps) from 7.90% in FY25 to 9.74% in FY26. Volume recovery under the "Back to Starbucks" strategy generated +210 bps of sales leverage, complemented by a 9.3% reduction in General and Administrative (G&A) expenses (-$244.3 million, +70 bps reported leverage) and a 12.0% drop in Depreciation and Amortization (-$201.4 million, +60 bps). G&A reductions were driven by $292 million in restructuring efficiencies, $83 million in China joint venture savings, and lapping the $81 million Leadership Experience 2025 conference, which outweighed $152 million in performance-based incentive compensation and $71 million in China transaction/transition costs. Conversely, Product and Distribution Costs increased 5.0% to $12,235.2 million, compressing implied gross margin by 92 bps from 68.65% to 67.73% due to product and channel mix shifts.
Table Consolidated Financial Performance, Cost Ratios, and Cash Flow Audit (FY2025 vs. FY2026)
| Financial Metric ($ in Millions, except per share & ratios) | FY2025 (Sep 28, 2025) | FY2026 (Sep 27, 2026) | YoY Variance ($ / % / bps) |
| Consolidated Net Revenues | $37,184.4 | $37,910.6 | +$726.2 (+2.0%) |
| — Company-operated Coffeehouse Revenue | $30,744.8 (82.7%) | $30,940.2 (81.6%) | +$195.4 (+0.6%) |
| — Licensed Coffeehouse Revenue | $4,350.4 (11.7%) | $4,615.8 (12.2%) | +$265.4 (+6.1%) |
| — Other Revenue (Channel / Corporate) | $2,089.2 (5.6%) | $2,354.6 (6.2%) | +$265.4 (+12.7%) |
| Product & Distribution Costs (COGS) | $11,658.2 (31.35%) | $12,235.2 (32.27%) | +$577.0 (+5.0% / +92 bps) |
| Implied Gross Profit / Margin % | $25,526.2 (68.65%) | $25,675.4 (67.73%) | +$149.2 (+0.6% / -92 bps) |
| Store Operating Expenses | $17,058.9 | $17,189.8 | +$130.9 (+0.8%) |
| — Store OpEx % of Total Net Revenues | 45.88% | 45.34% | -54 bps (-60 bps rep) |
| — Store OpEx % of Company-Op Revenue | 55.49% (55.5%) | 55.56% (55.6%) | +7 bps (+10 bps rep) |
| General & Administrative (G&A) Expenses | $2,617.2 (7.04%) | $2,372.9 (6.26%) | -$244.3 (-9.3% / -78 bps) |
| Depreciation & Amortization (OpEx) | $1,684.7 (4.53%) | $1,483.3 (3.91%) | -$201.4 (-12.0% / -62 bps) |
| Restructuring & Impairments | $892.0 (2.40%) | $688.6 (1.82%) | -$203.4 (-22.8% / +58 bps) |
| Income from Equity Investees | $247.8 | $294.8 | +$47.0 (+19.0%) |
| GAAP Operating Income / Margin % | $2,936.6 (7.90%) | $3,691.1 (9.74%) | +$754.5 (+25.7% / +184 bps) |
| Implied Non-GAAP Operating Income (ex-Restructuring) | $3,828.6 (10.30%) | $4,379.7 (11.55%) | +$551.1 (+14.4% / +125 bps) |
| Net Gain on Business Divestiture (China JV) | $0.0 | $536.3 | +$536.3 (N/A) |
| Net Interest Expense | $(429.3) | $(386.3) | +$43.0 (-10.0%) |
| Effective Tax Rate (ETR) | 25.9% | 34.2% | +830 bps |
| Net Earnings (Consolidated incl. NCI) | $1,856.7 | $2,526.1 | +$669.4 (+36.1%) |
| Net Earnings Attributable to SBUX | $1,856.4 | $2,526.7 | +$670.3 (+36.1%) |
| Diluted Earnings Per Share (GAAP EPS) | $1.63 | $2.21 | +$0.58 (+35.6%) |
| Operating Cash Flow (OCF) | $4,747.5 | $4,988.4 | +$240.9 (+5.1%) |
| Capital Expenditures (Additions to PPE) | $2,305.5 (6.20%) | $1,263.6 (3.33%) | -$1,041.9 (-45.2% / -287 bps) |
| Free Cash Flow (FCF = OCF - CapEx) | $2,442.0 | $3,724.8 | +$1,282.8 (+52.5%) |
| — FCF Conversion of Net Earnings / OCF | 131.5% / 51.4% | 147.4% / 74.7% | +1,590 bps / +2,330 bps |
| EBIT Interest Coverage / Cash Interest Coverage | 5.41x / 9.07x | 6.95x / 9.27x | +1.54x / +0.20x |
Operating cash flow increased 5.1% to $4,988.4 million in FY26, supported by favorable working capital movements in income taxes payable (+$427.3 million vs. +$103.8 million in FY25) and inventories (-$176.4 million vs. -$408.4 million in FY25), partially offset by the non-cash adjustment removing the $536.3 million China divestiture gain and lower non-cash lease costs ($1,303.0 million vs. $1,513.8 million). Net investing cash flow swung from an outflow of -$2,485.4 million in FY25 to an inflow of +$1,112.6 million in FY26, anchored by $2,544.2 million in net cash proceeds from the China retail divestiture. Combined with a 45.2% CapEx contraction, Free Cash Flow surged 52.5% to $3,724.8 million, lifting FCF conversion of net earnings from 131.5% to 147.4%.
Reportable Segment Performance, Comps Elasticity, and Product Mix
Performance diverged sharply across operating segments as Starbucks bifurcated its global retail architecture. North America remained the consolidated cash anchor at 76.2% of net revenues ($28,897.8 million, +5.6%), lifting segment operating margin 50 bps reported (+42 bps exact) to 12.0% as +290 bps of sales leverage absorbed -180 bps of Green Apron Service labor investments while Store OpEx held steady at 56.4% of company-operated revenue. Conversely, International net revenues fell 13.8% to $6,744.4 million due to a $1.5 billion company-operated revenue headwind from deconsolidating 7,991 China stores in Q3 FY26. International licensed revenues grew 17.6% (+$311.9 million), lifted by $217 million in royalties and product sales from existing licensees and $105 million from the Boyu Capital joint venture. International operating margin expanded 560 bps reported (+551 bps exact) from 12.1% to 17.7%, propelled by ~330 bps from the joint venture conversion and ~200 bps from halting D&A on China assets classified as held for sale in H1 FY26.
Table Reportable Operating Segment Revenue and Margin Breakdown (FY2025 vs. FY2026)
| Operating Segment / Line Item ($ in Millions) | FY2025 (Sep 28, 2025) | FY2026 (Sep 27, 2026) | YoY Delta ($ / % / bps) |
| North America Total Net Revenues | $27,373.1 | $28,897.8 | +$1,524.7 (+5.6%) |
| — Company-operated / Licensed / Other | $24,793.0 / $2,575.6 / $4.5 | $26,363.9 / $2,529.1 / $4.8 | +6.3% / -1.8% / +6.7% |
| North America Operating Income / Margin % | $3,156.7 (11.53%) | $3,454.2 (11.95%) | +$297.5 (+9.4% / +42 bps) |
| International Total Net Revenues | $7,819.9 | $6,744.4 | -$1,075.5 (-13.8%) |
| — Company-operated / Licensed / Other | $5,951.8 / $1,774.8 / $93.3 | $4,576.3 / $2,086.7 / $81.4 | -23.1% / +17.6% / -12.8% |
| International Operating Income / Margin % | $950.0 (12.15%) | $1,191.1 (17.66%) | +$241.1 (+25.4% / +551 bps) |
| Channel Development Total Revenues | $1,871.7 | $2,172.7 | +$301.0 (+16.1%) |
| Channel Development Operating Income / Margin % | $885.1 (47.29%) | $1,016.2 (46.77%) | +$131.1 (+14.8% / -52 bps) |
| Corporate & Other Revenues / Operating Loss | $119.7 / $(2,055.2) | $95.7 / $(1,970.4) | -20.1% rev / -4.1% loss |
Comparable store sales (stores open 13 months or longer, constant currency) reversed FY25's negative traffic elasticity. In FY25, annualized menu pricing (+1.0% global ticket, +2.0% North America ticket) failed to offset traffic contraction (-2.0% global, -4.0% North America), yielding -1.0% global comps (-$408 million) and -2.0% North America comps (-$419 million), while International operating margin compressed 210 bps to 12.1% on -170 bps of promotional discounting in China (partially offset by 526 net new company-operated openings adding $264 million). In FY26, global comps accelerated +720 bps to +6.2% (+$1.7 billion) on +3.2% traffic and +3.0% ticket, while North America jumped +860 bps to +6.6% (+$1.6 billion) on +3.6% traffic and +3.0% ticket, catalyzed by the Q4 FY25 deployment of the Green Apron Service model, peak-hour staffing, delivery growth, and morning/all-day food attach. International comps (primarily Japan and the U.K. following China's exclusion from company-operated comps post-Q3 FY26) rose +3.7% (+$152 million).
Table Comparable Store Sales Traffic and Ticket Decomposition (FY2025 vs. FY2026)
| Geographic Scope | FY25 Comps (Tx / Ticket) | FY26 Comps (Tx / Ticket) | YoY Acceleration (Tx / Ticket) | Primary Driver |
| Global (Consolidated Retail) | -1.0% (-2.0% / +1.0%) | +6.2% (+3.2% / +3.0%) | +720 bps (+520 bps / +200 bps) | Traffic Inflection / Volume-Led |
| North America / U.S. Market | -2.0% (-4.0% / +2.0%) | +6.6% (+3.6% / +3.0%) | +860 bps (+760 bps / +100 bps) | Traffic Inflection / Food Attach |
| International Segment | N/A (Unit Expansion Led) | +3.7% (+1.6% / +2.0%) | N/A | Price/Ticket-Led (ex-China JV) |
Channel Development generated a 46.77% operating margin in FY26 (-52 bps YoY), outperforming company-operated retail by more than 3,500 bps because Nestlé and PepsiCo absorb bottling, direct-store-delivery (DSD), and merchandising overhead. Revenue rose 16.1% to $2,172.7 million on $266 million of growth in the Nestlé Global Coffee Alliance amid higher coffee pricing. Under ASC 606, Starbucks amortizes the ~$7.0 billion FY18 Nestlé upfront prepaid royalty straight-line over 40 years (through FY2058), recognizing $176.5 million annually in Other Revenue with $5,677.0 million remaining in deferred revenue ($177.0 million current; ~$5.5 billion non-current in FY26 vs. ~$5.6 billion in FY25). Equity income from the 50/50 North American Coffee Partnership (NACP) with PepsiCo contributed $252.0 million in FY26 (vs. $249.6 million in FY25), as its carrying value grew from $74.0 million to $162.0 million.
Table Consolidated Net Revenues by Product Type and Channel Development Economics (FY2025 vs. FY2026)
| Category / Channel Metric ($ in Millions) | FY2025 (Sep 28, 2025) | FY2026 (Sep 27, 2026) | YoY Variance ($ / %) |
| Consolidated Beverage Revenue (Co-Op Stores) | $22,539.9 (60.6%) | $22,413.9 (59.1%) | -$126.0 (-0.6%) |
| Consolidated Food Revenue (Co-Op Stores) | $7,049.9 (19.0%) | $7,407.7 (19.5%) | +$357.8 (+5.1%) |
| Consolidated Other Revenue (Packaged/Royalties/RTD) | $7,594.6 (20.4%) | $8,089.0 (21.3%) | +$494.4 (+6.5%) |
| Company-Op Retail Sales Mix (Bev / Food / Other) | 73% / 23% / 4% | 72% / 24% / 4% | -100 bps / +100 bps / 0 bps |
| Channel Dev: Product & Distribution Costs (COGS) | $1,168.3 (62.4%) | $1,343.4 (61.8%) | +$175.1 (+15.0%) |
| Channel Dev: Other OpEx / G&A / Restructuring | $60.2 / $5.8 / $1.9 | $61.8 / $3.4 / $(0.1) | +2.7% / -41.4% / N/A |
| Channel Dev: Equity Investee Income (PepsiCo NACP) | $249.6 (13.3%) | $252.0 (11.6%) | +$2.4 (+1.0%) |
| Nestlé Prepaid Royalty Recognized / Total Deferred |
|
|
|
Capital Allocation, Debt Maturity Profile, and DuPont ROIC Reconciliation
Historical share buybacks and dividends exceeding retained earnings produced an accumulated retained deficit of -$8,583.7 million and a total shareholders' deficit of -$7,669.1 million in FY26 (improved by $427.5 million from -$8,096.6 million in FY25 as $2,898.6 million in comprehensive income exceeded $2,837.9 million, or $2.49/share, in dividend declarations). Because negative equity inverts standard DuPont Return on Equity (-23.88% in FY25 to -32.05% in FY26 on average equity), unlevered asset return and Return on Invested Capital (ROIC) provide cleaner measures of capital efficiency. Unlevered return on ending assets jumped 310 bps from 5.80% to 8.90%, driven by net profit margin expansion (+167 bps to 6.66%) and asset turnover acceleration (1.16x to 1.34x ending; 1.17x to 1.26x average) after the China transaction deconsolidated $3.4 billion in net operating assets—reducing total assets by 11.3% (-$3,629.8 million to $28,389.9 million) and cutting goodwill 62.9% from $3,368.9 million to $1,249.2 million.
Table DuPont ROE, Invested Capital, and ROIC Reconciliation (FY2024–FY2026)
| Capital Structure & Return Metric ($ in Millions) | FY2024 (Ending) | FY2025 (Sep 28, 2025) | FY2026 (Sep 27, 2026) |
| Ending / Average Total Assets | N/A | $32,019.7 / $31,679.5 | $28,389.9 / $30,204.8 |
| Ending / Average Shareholders' Deficit | $(7,448.9) | $(8,096.6) / $(7,772.8) | $(7,669.1) / $(7,882.9) |
| DuPont: Net Profit Margin (Net Earnings / Revenue) | — | 4.99% | 6.66% (+167 bps) |
| DuPont: Asset Turnover (Ending / Average Assets) | — | 1.16x / 1.17x | 1.34x / 1.26x (+0.18x / +0.09x) |
| DuPont: Equity Multiplier (Ending / Average) | — | -3.95x / -4.08x | -3.70x / -3.83x (+0.25x / +0.25x) |
| DuPont ROE (Ending Equity / Average Equity) | — | -22.93% / -23.88% | -32.95% / -32.05% |
| Unlevered Asset Return (Ending / Average) | — | 5.80% / 5.86% | 8.90% / 8.36% (+310 bps / +250 bps) |
| Current Portion of Long-Term Debt | $1,248.9 | $1,498.9 | $1,499.0 |
| Long-Term Debt (Carrying Value) | $14,319.5 | $14,575.9 | $11,777.9 |
| Total Operating Lease Liabilities | $10,234.7 | $10,536.7 | $9,136.7 |
| Less: Cash, Equivalents & Short-Term Investments | $(3,543.2) | $(3,467.0) | $(3,864.2) |
| Total Ending / Average Invested Capital | $14,811.0 / — | $15,047.9 / $14,929.5 | $10,880.3 / $12,964.1 (-27.7% end) |
| As-Reported NOPAT / Normalized NOPAT (25% ETR) | — | $2,176.0 / — | $2,428.7 / $2,768.3 |
| Reported ROIC (Average / Ending Invested Capital) | — | 14.58% / 14.46% | 18.73% (+415 bps) / 22.32% (+786 bps) |
| Normalized ROIC (25% ETR, Average Invested Capital) | — | 14.76% | 21.35% (+659 bps) |
Management suspended open-market share repurchases across FY25 and FY26 (compared to $1.3 billion in FY24), maintaining a 29.8 million-share authorization reauthorized in September 2026 while raising quarterly dividends ($0.61 to $0.62 in FY25; $0.62 to $0.63 in FY26; $2,824.7 million paid in FY26). Using China divestiture proceeds, Starbucks executed cash tender offers in May 2026 to retire $1,315.9 million in senior notes across five tranches ($273.5 million of 4.500% May 2028; $321.8 million of 4.800% May 2030; $110.4 million of 5.000% February 2034; $410.2 million of 5.400% May 2035; and $200.0 million of 4.500% November 2048). Total long-term debt repayments reached $2,815.9 million (+125.3%), cutting face-value principal from $16,200.0 million to $13,384.1 million (carrying value from $16,074.8 million to $13,276.9 million) with zero commercial paper or revolving credit draws in FY26 alongside dedicated ¥15.0 billion Japanese yen credit facilities.
Global Infrastructure Footprint, ASC 842 Lease Architecture, and Supply Chain Moats
Starbucks operates across 91 global markets (up from 89 in FY25), expanding its global system-wide store base by 617 net units to 41,607 coffeehouses at FY26-end. The Q3 FY26 transfer of 7,991 company-operated stores in China (7,989 China retail and 2 Siren Retail international units) to the Boyu Capital joint venture—where Starbucks retains a 40% equity stake valued at $1.2 billion on a $4.0 billion enterprise value—flipped the global mix from 52.5% company-operated in FY25 to 67.8% licensed in FY26.
Company-Operated vs. Licensed Economics and Global Store Footprint
Licensed operations carry lower gross margin than company-operated retail (capturing royalties, pre-opening fees, and wholesale coffee/ingredient/equipment markups) but structurally higher operating margins because partners fund 100% of store-level build-outs, leases, and barista payroll. Direct support costs for licensing ("Other Operating Expenses") declined from $584.6 million (13.4% of licensed revenue) in FY25 to $544.5 million (11.8% of licensed revenue, -160 bps) in FY26. In contrast, North America company-operated stores generate an average unit volume (AUV) proxy of ~$2.41 million per store in FY26 (up from ~$2.25 million in FY25, nearly 4.0x International's ~$0.57 million FY25 AUV), backed by suburban drive-thrus and 24% food attach, while absorbing 56.4% store OpEx ratios.
Across North America, management curbed gross company-operated openings by 61.1% globally (from 1,261 in FY25 to 491 in FY26) and pruned underperforming units, resulting in 877 total company-operated closures in FY25 (627 restructuring closures) and 617 in FY26 (516 restructuring closures: 266 under the FY25 plan and 250 under the FY26 plan). In the U.K., total footprint held flat at 1,424 stores following the Q1 FY25 acquisition of 23.5 Degrees Topco Limited (transferring 113 licensed stores to company-operated), ending FY26 at 483 company-operated and 941 licensed units. In Taiwan, Province of China, licensed operations expanded consistently from 571 locations in FY24 to 592 in FY25 (+21 net; 33 opened, 12 closed) and 619 in FY26 (+27 net; 35 opened, 8 closed; +4.6% YoY). Management targets expanding the China joint venture toward 20,000 locations over time.
Table Global System-Wide Store Footprint Roll-Forward by Region (FY2025 vs. FY2026)
| Region / Market | FY25 Ending (Co-Op / Lic / Total) | FY26 Opened | FY26 Closed | FY26 Transfers | FY26 Ending (Co-Op / Lic / Total) | FY26 Net Delta |
| United States | 10,047 / 6,813 / 16,860 | 220 / 227 | (293) / (236) | — | 9,974 / 6,804 / 16,778 | -73 / -9 / -82 |
| Canada | 967 / 480 / 1,447 | 10 / 12 | (52) / (22) | — | 925 / 470 / 1,395 | -42 / -10 / -52 |
| Siren Retail (North America) | 4 / 0 / 4 | — | (1) / — | — | 3 / 0 / 3 | -1 / 0 / -1 |
| China | 8,009 / 0 / 8,009 | 143 / 437 | (163) / (86) | (7,989) / +7,989 | 0 / 8,340 / 8,340 | -8,009 / +8,340 / +331 |
| Japan | 1,883 / 0 / 1,883 | 78 / — | (16) / — | — | 1,945 / 0 / 1,945 | +62 / 0 / +62 |
| United Kingdom | 524 / 900 / 1,424 | 38 / 60 | (79) / (19) | — | 483 / 941 / 1,424 | -41 / +41 / 0 |
| Korea (Licensed) | 0 / 2,077 / 2,077 | — / 164 | — / (21) | — | 0 / 2,220 / 2,220 | +143 |
| Latin America (Licensed) | 0 / 1,813 / 1,813 | — / 136 | — / (8) | — | 0 / 1,941 / 1,941 | +128 |
| Turkey (Licensed) | 0 / 762 / 762 | — / 51 | — / (4) | — | 0 / 809 / 809 | +47 |
| Taiwan, Province of China (Licensed) | 0 / 592 / 592 | — / 35 | — / (8) | — | 0 / 619 / 619 | +27 |
| Indonesia / Thailand / Philippines (Lic) | 0 / 1,667 / 1,667 | — / 60 | — / (13) | — | 0 / 1,714 / 1,714 | -4 / +31 / +20 |
| All Other Int'l & Int'l Siren Retail | 80 / 4,372 / 4,452 | 2 / 229 | (13) / (251) | (2) / +2 | 67 / 4,352 / 4,419 | -13 / -20 / -33 |
| Global System-Wide Total | 21,514 / 19,476 / 40,990 | 491 / 1,411 | (617) / (668) | (7,991) / +7,991 | 13,397 / 28,210 / 41,607 | -8,117 / +8,734 / +617 |
Roasting Facilities, PP&E Allocation, and ASC 842 Lease Obligations
Starbucks owns mission-critical coffee roasting plants while leasing its warehousing, distribution, corporate offices, and substantially all company-operated coffeehouses, supplemented by managed third-party logistics (3PL) inventories. In FY26, Starbucks added a 400,000 sq. ft. leased distribution facility in Romeoville, Illinois, and executed a 250,000 sq. ft. lease in March 2026 as part of establishing a 366,000 sq. ft. Southeastern corporate administrative hub in Nashville, Tennessee, while transferring Shanghai retail administration (221,000 sq. ft.) to the Boyu Capital joint venture and retaining ownership of the 630,000 sq. ft. Kunshan Coffee Innovation Park in China.
Under ASC 842, total consolidated lease costs fell 6.3% (-$213.1 million) to $3,150.6 million in FY26. Deconsolidating China leases and closing 1,143 restructuring stores across FY25–FY26 reduced operating lease ROU assets by 15.6% (-$1,456.8 million to $7,858.9 million), recorded lease liabilities by 13.3% (-$1,400.0 million to $9,136.7 million), and undiscounted lease commitments by 12.7% (-$1,569.5 million to $10,819.7 million). Coffeehouse occupancy costs (Note 7) dropped 9.2% (-$304.7 million) to $3,013.9 million, generating 105 bps of occupancy leverage (9.74% of company-operated revenue vs. 10.79% in FY25), which was reallocated toward store labor (+150 bps share of Store OpEx to 59.31%).
Gross Property, Plant, and Equipment (PPE) contracted from $19,842.7 million (net $8,493.5 million) in FY25 to $17,637.8 million (net $6,944.1 million) in FY26, reflecting China asset derecognition and a shift in North American CapEx from new unit builds toward acoustic/seating uplifts, automated Siren System espresso and cold-beverage equipment, and mobile/drive-thru sequencing IT.
Green Coffee Procurement, Derivative Hedging, and Tariff Mitigation
Starbucks sources high-altitude arabica green coffee beans trading at quality premiums above the New York "C" benchmark, supported by C.A.F.E. Practices and 10 global Farmer Support Centers (including Yunnan, China). Total off-balance-sheet material purchase obligations (qualifying for the ASC 815 Normal Purchase Normal Sale exemption) declined 31.7% to $922.5 million in FY26, with 91.9% ($847.4 million) maturing within 12 months, 8.1% ($75.1 million) in 1–3 years, and zero commitments beyond 3 years. Green coffee represented ~88% of corporate purchase commitments (~$811.8 million implied in FY26 vs. ~$1,188.7 million in FY25). As green coffee prices moderated from FY25 highs, Starbucks more than doubled fixed-price green coffee contracts (+116.7% to $279.6 million) while halving price-to-be-fixed contracts (-51.5% to $533.9 million) to lock in supply through FY27.
On trade policy, the U.S. Supreme Court ruled on February 20, 2026, that reciprocal tariffs imposed under the International Emergency Economic Powers Act (IEEPA) were unlawful. Following the April 20, 2026 launch of the U.S. Customs and Border Protection refund platform, Starbucks filed and received substantially all requested refunds in Q3 FY26, crediting them to Product and Distribution Costs to offset tariffs incurred across the first three quarters of FY26. Nevertheless, management flagged escalating compliance expenses from the EU Corporate Sustainability Reporting Directive (CSRD), California climate disclosure mandates, extended producer responsibility (EPR) packaging levies, and Brazil weather extremes.
HDIN Institutional Verdict: Turnaround Narrative vs. Operational Reality
Cross-referencing management's "Back to Starbucks" narrative against Note 1, Note 11, Note 14, and Note 18 reveals a sharp distinction between headline GAAP recovery and underlying earnings quality.
Earnings Quality: Restructuring Recurrence, Divestiture Padding, and Tax Inflection
While GAAP net earnings surged 36.1% to $2,526.7 million, organic Non-GAAP diluted EPS (excluding restructuring charges and the $536.3 million China divestiture gain) grew at a more modest 7.2% pace from $2.21 to $2.37. Furthermore, restructuring expenses are demonstrating multi-year recurrence rather than isolated one-time status: cumulative restructuring hit $1,580.6 million across FY25 ($892.0 million) and FY26 ($688.6 million), with $144 million projected for H1 FY27 ($74 million accelerated ROU amortization; $70 million store asset disposals/impairments), bringing total plan costs to ~$1.7 billion. In Q3 FY26, Corporate and Other restructuring spiked to $294.6 million (from $12.3 million in FY25), driven by $113.0 million in ROU lease impairments to simplify the Starbucks Reserve and Roastery ("Siren Retail") portfolio. Separately, ongoing store-level impairments embedded directly inside Store Operating Expenses rose 9.1% from $250.6 million to $273.5 million, bringing total consolidated impairments and restructuring to $962.1 million in FY26 (vs. $1,142.6 million in FY25).
On taxes, the consolidated effective tax rate rose 830 bps from 25.9% to 34.2% as Starbucks absorbed a $273.0 million discrete charge (+7.1% ETR impact) to release indefinite reinvestment assertions on remaining foreign earnings, enabling unrestricted U.S. repatriation without material future incremental tax. Gross Unrecognized Tax Benefits (UTBs) expanded 18.0% (+$42.4 million) to $277.5 million, with $63.9 million in accrued interest and penalties. In Q4 FY26, the IRS issued two final Notices of Proposed Adjustment (NOPAs) for FY18–FY19 intercompany transfer pricing and licensing royalties (covering examinations spanning FY18–FY25); Starbucks formally protested and entered administrative appeals, noting UTBs could decrease by up to $55 million within 12 months upon audit settlements.
Stored Value Card Zero-Interest Float and Digital Ecosystem Mechanics
The Starbucks Card stored value and Rewards ecosystem acts as an embedded zero-interest working capital engine, mitigating Starbucks' structural negative net working capital (-$2,442.4 million in FY26 vs. -$2,828.1 million in FY25). Customers preloaded $15,130.7 million in FY26 (vs. $15,245.8 million in FY25), generating an 8.9x annual liability turnover. While total ending stored value and loyalty liabilities dipped $73.0 million to $1,678.7 million, that contraction resulted from transferring $199.7 million (11.4% of the prior float) to the Boyu Capital China joint venture; organically, the float grew $126.7 million. At prevailing 4.5%–5.0% benchmark borrowing rates, this $1.68 billion customer float avoids ~$75 million to $85 million in annual pre-tax interest expense.
Breakage revenue—recognized proportionally under ASC 606 with zero COGS or store labor—remained flat at $222.2 million in FY26 (1.47% of preloads), accounting for 6.02% of GAAP operating income (down from 7.57% in FY25). A ±25 bps actuarial shift in non-redemption assumptions across ~$15.1 billion of preloads would alter GAAP operating income by ±$37.8 million (~1.0%). In Q2 FY26, Starbucks restructured Starbucks Rewards into Green (Stars expire after six months, extendable one month via qualifying activity), Gold, and Reserve tiers (non-expiring Stars; international Stars expire in 12–24 months). Notably, audited FY25 and FY26 Form 10-K filings omit standalone figures for 90-day active Rewards members, Rewards tender share, and Mobile Order & Pay (MOP) transaction percentages.
Human Capital Contraction, Union Exposure, Governance, and FY2027 Outlook
Global headcount fell 19.7% (-75,000 employees) from ~381,000 in FY25 to ~306,000 in FY26, almost entirely reflecting the derecognition of 73,000 international partners (-46.2%) upon closing the China joint venture, while U.S. headcount held stable at ~221,000 (down from ~223,000, reflecting a 2,000-person corporate/support reduction). Store-level wages and benefits rose 3.4% to $10,195.0 million, creating +210 bps of FY26 Store OpEx pressure (vs. +160 bps in FY25), fully offset by +210 bps of consolidated sales leverage. Union representation held steady at ~6% of U.S. company-operated stores (~600 of 9,974 units) across both years; management classifies material contingent litigation loss (including employment class actions and union disputes) as remote with zero ASC 450 reserves, though Item 1A flags heightened operational rigidity and delays to unilateral workflow or equipment rollouts at represented stores.
Corporate governance underwent a complete executive overhaul: Chairman and CEO Brian Niccol (joined September 2024), CFO Cathy R. Smith (March 2025), COO Mike Grams (joined February 2025, promoted June 2025), International CEO Brady Brewer (April 2024), Chief Legal Officer Pilar Ramos (November 2025), and Principal Accounting Officer Val Bauduin (FY26). Performance-based Restricted Stock Units (PRSUs) under Note 13 link executive payouts to EPS, comparable sales, operating income and OpEx savings, ROIC, Relative TSR (Monte Carlo), and "Back to Starbucks" milestones. Enterprise Risk Management (ERM) is co-managed by the CFO and CLO via a Risk Steering Committee reporting to the Audit and Compliance Committee, while the CISO reports directly to the Board and Audit Committee under the NIST Cybersecurity Framework.
For FY27, management guides to consolidated net revenue moderation as Starbucks laps pre-divestiture China company-operated sales and absorbs North America store closures. International licensed stores will lead global unit growth, while North America redirects higher total CapEx (above FY26's $1,263.6 million) into store environment uplifts, supply chain modernization, and corporate facilities alongside $144 million in final H1 FY27 restructuring charges and ongoing OECD Pillar Two and IRS NOPA tax defenses.
Key Financial Questions From the FY2026 Filing
What drove Starbucks Corporation's revenue and margin performance in FY2026?
Consolidated net revenue rose 2.0% to $37,910.6 million as +6.2% global comparable store sales (+3.2% traffic, +3.0% ticket) and +16.1% Channel Development growth ($2,172.7 million) overcame a $1.5 billion headwind from deconsolidating 7,991 China retail stores. GAAP operating margin expanded 180 bps reported (+184 bps exact) from 7.90% to 9.74%, driven by +210 bps in sales leverage, -9.3% G&A reductions ($2,372.9 million), and a +560 bps International margin expansion to 17.7%, which offset -130 bps in labor investments and -90 bps in product mix inflation.
How is Starbucks Corporation allocating capital and restructuring its global footprint?
Starbucks reduced FY26 capital expenditures by 45.2% (-$1,041.9 million) to $1,263.6 million by cutting gross company-operated openings 61.1% to 491 stores and prioritizing existing store remodels and Siren equipment over unit additions. Funded by $2,544.2 million in net cash proceeds from its 60% China retail divestiture and suspended share buybacks ($0.0 million), management retired $2,815.9 million in long-term debt (including a $1,315.9 million May 2026 cash tender offer), shrinking total face-value debt to $13,384.1 million and lifting normalized ROIC by 659 bps to 21.35%.
How do stored value card breakage and recurring impairments affect Starbucks' earnings quality?
Breakage revenue on unredeemed Starbucks Cards contributed $222.2 million (6.02% of GAAP operating income) at near-100% margin alongside a $1,678.7 million zero-interest customer float, while one-time gains from the China divestiture ($536.3 million pre-tax) padded GAAP net earnings growth (+36.1% vs. +7.2% Non-GAAP EPS growth). Simultaneously, combined restructuring charges ($688.6 million) and ongoing store-level impairments embedded in Store OpEx ($273.5 million) totaled $962.1 million in FY26—following $1,142.6 million in FY25—with another $144 million scheduled for H1 FY27, signaling persistent store-level asset drag beneath headline profitability.
Presentation Download & Analyst Briefing Access:
- Institutional Presentation: Download the full "Starbucks_Strategic_Audit" PDF under the 'Related Topics' section.
- Analyst Video Briefing: Watch the "Starbucks (SBUX) 2026 10-K Audit: Can a $3.63B Asset Purge and 60% China JV Sustain Its 9.7% Margin?" on the HDIN Research YouTube Channel.
About HDIN Research:
HDIN Research is a premier global market intelligence and strategic advisory firm specializing in institutional-grade financial analysis, supply chain audits, and macroeconomic forecasting. Our dedicated sector analysts deliver actionable, data-driven insights tailored for private equity, hedge funds, and corporate strategy teams. Visit us at https://www.hdinresearch.com.
Editorial & Methodology Disclosure:
"This market intelligence brief was researched, modeled, and audited by the HDIN Research Equity Desk based on official primary corporate filings (Starbucks Corporation Form 10-K filings for the fiscal years ended September 28, 2025, and September 27, 2026). Proprietary quantitative extraction tools were utilized to ensure 100% fidelity to reported financial line items and footnotes. In strict adherence to United Nations cartographic standards, all references to licensed retail operations in Taiwan designate the territory as 'Taiwan, Province of China.' This brief evaluates corporate strategy, accounting structures, and operational execution; it does not contain securities valuations, price targets, or recommendations to purchase, hold, or sell any security. All forensic interpretations, segmental benchmarks, and institutional verdicts were independently written and verified by HDIN senior sector analysts in accordance with institutional research standards."