Wind Turbine Main Shaft Market: 2026-2031 Strategic Report
- Single User License (1 Users) $ 3,500
- Team License (2~5 Users) $ 4,500
- Corporate License (>5 Users) $ 5,500
The global wind turbine main shaft market size is valued between 1.5 billion and 1.8 billion USD in 2026 with a compound annual growth rate of 3.0% to 5.0% through 2031. Market concentration is driven by an elite cohort of heavy metallurgical fabricators and precision engineering houses, including SKF, Jinlei Technology, Taewoong Corporation, Tongyu Heavy Industry, Riyue Heavy Industry, Jiangsu Sinojit Wind Energy Technology, Zhangjiagang Guangda Special Material, Scot Forge, Saarstahl, and Bharat Forge Limited. These midstream manufacturers interface directly with consolidated tier-one turbine original equipment manufacturers such as Goldwind, Vestas, GE Vernova, Siemens Gamesa, Envision Energy, Mingyang Smart Energy, and Windey. Production capacity exhibits an extreme geographic skew, with coastal and industrial manufacturing corridors in China controlling upwards of 80.0% of the world's large-scale forging and casting infrastructure. Consumption dynamics diverge sharply: the Asia-Pacific region, anchored by China's colossal desert mega-bases and offshore corridors, leads volumetric demand. Meanwhile, Europe accelerates offshore grid commitments in the North Sea, and North America recalibrates capital deployment around updated federal tax frameworks and utility-scale load growth driven by artificial intelligence compute clusters.
Following a margin-eroding downstream price war across 2023 and 2024, the market entered an operational recalibration throughout 2025. Historic installation records—surpassing 169.0 GW globally—paired with direct material deflation in heavy scrap steel and foundry pig iron, allowed gross margins to recover into the 15.0% to 27.2% corridor. The 2026 to 2031 planning horizon marks the commercial inflection point where turbine platforms exceeding 10 MW become the market norm, driving casting capacity investments to industrial maturity. The underlying catalyst for this market transformation is the ruthless reduction of Levelized Cost of Energy (LCOE). As onshore turbines push past 7.0 MW average ratings and commercial offshore units target 15 MW to 30 MW architectures, traditional forged steel shafts encounter severe metallurgical, logistics, and capital equipment limits. The economic imperative to optimize top-head mass, reduce nacelle weight, damp severe multi-axis vibrational loads, and compress manufacturing cycle times has cemented ductile iron cast shafts as the indispensable design vector for next-generation platforms.
PRODUCT ARCHITECTURE AND METALLURGICAL MECHANICS
● Engineering Physics and Operating Realities
The wind turbine main shaft functions in an exceptionally hostile mechanical environment. Positioned directly within the nacelle, it acts as the primary mechanical conduit, absorbing turbulent, multi-axis aerodynamic loads from blade sweeps spanning over 200 meters in diameter. It translates low-speed, ultra-high-torque kinetic rotational energy through the powertrain while isolating downstream transmissions from damaging bending moments and asymmetric shear loads.
Operating parameters dictate an unyielding design lifespan of 20 to 25 continuous operational years without structural failure. Given that a mechanical compromise or catastrophic fatigue shear of the main shaft results in nacelle structural failure, total drivetrain collapse, and severe balance-of-plant financial losses, the component is classified as a zero-tolerance mission-critical asset. Engineering protocols require rigorous full-body non-destructive testing, including multi-angle phased array ultrasonic inspection and magnetic particle testing, to confirm zero internal microporosity, non-metallic inclusions, or microcrack propagation pathways.
● Technical Evolution Vectors
To service multi-megawatt nacelles, main shaft design has diverged from simple solid cylindrical profiles. Current engineering frameworks prioritize three design paradigms:
1. Hollow structural geometries: Advanced mandrel open-die forging and core-chilled casting processes generate deep internal hollows, shedding 15.0% to 25.0% of component deadweight without sacrificing torsional rigidity.
2. Single and double integrated bearing housing interfaces: Shafts are increasingly engineered with precision-stepped shoulders and integrated locating journals to support compact double-row tapered roller bearings (TRBs) or spherical roller bearings (SRBs), maximizing overall drivetrain torque density.
3. Near-net-shape metallurgy: Structural geometries increasingly incorporate integrally cast or forged flange rings that connect directly to the rotor hub, eliminating bolted mechanical interfaces that represent classic high-stress shear failure points.
Segment Breakdown by Manufacturing Process
1. Forged Main Shafts
Manufacturing Methodology: Forged shafts are engineered from high-purity, vacuum-degassed alloy steel ingots, predominantly utilizing 42CrMo4 and 34CrNiMo6 chemistries. Smelted in electric arc furnaces and subjected to secondary refining via ladle furnace and vacuum degassing units, the ingots undergo high-temperature open-die free forging on massive 50MN to 120MN (up to 15,000-ton) hydraulic open-die presses. Repeated cycles of upsetting and drawing align the metallurgical grain structure parallel to anticipated working stress vectors. Following forging, workpieces undergo rough CNC pre-turning, comprehensive quenching and tempering heat treatment to attain target martensitic/bainitic microstructures, finish machining on heavy-duty horizontal lathes, and anti-corrosive multi-layer epoxy coating.
Technical Characteristics: Forged shafts are distinguished by exceptional internal grain refinement, superior tensile strength, outstanding fatigue endurance limits, and high Charpy V-notch impact toughness at sub-zero operating environments down to -40 degrees Celsius.
Market Position and Structural Bottlenecks: Forging historically commanded complete market dominance across the 1.5 MW to 8.0 MW turbine spectrum. However, scaling forged shafts beyond 10 MW introduces geometric penalties. Achieving sound structural consolidation in the core of ultra-large ingots requires immense pressing forces and extended thermal cycles, causing scrap rates, trepanning/deep-hole boring waste, and machining lead times to scale non-linearly. Consequently, forging is consolidating around onshore 5.X MW to 8.X MW turbines and specialized severe-cold onshore installations.
2. Cast Main Shafts
Manufacturing Methodology: Cast shafts are manufactured from high-strength ductile cast iron, principally spheroidal graphite iron grades complying with QT500-14, QT400-18, and EN-GJS-400-18-LT specifications. Production utilizes specialized furan resin sand molding and cold-box core systems. The liquid base iron requires precise metallurgical balancing, exceptionally low sulfur and phosphorus content, and tightly controlled additions of nodularizing agents (ferrosilicon magnesium) and inoculants to achieve nodularity ratings exceeding 90.0%. Advanced metal-mold chilling plates are embedded within the sand molds to direct progressive, rapid directional solidification, effectively preventing shrinkage cavities and shrinkage porosity in heavy wall transitions. Workpieces subsequently undergo stress-relief annealing and finish CNC machining.
Technical Characteristics: Cast shafts provide remarkable internal material damping capacity, absorbing and dissipating high-frequency torsional vibrations and shock loads before they transmit into the gearbox or generator. Ductile cast iron features a lower notch sensitivity factor than alloy steels and allows single-pour casting of complex, hollow, variable-wall profiles that are unachievable via open-die forging.
Disruption Profile: Cast shafts represent the dominant technological disruption across the global wind powertrain domain. By enabling single-step near-net-shape formation, casting reduces material consumption, eliminates costly core-trepanning operations, and slashes total unit delivery costs by 15.0% to 30.0% relative to equivalent forged components. As turbine architectures cross the 8.0 MW boundary onshore and reach 15 MW to 30 MW offshore, cast iron has evolved from an experimental substitution to the primary baseline specification for global OEMs.
DOWNSTREAM APPLICATION DYNAMICS AND OPERATIONAL METRICS
1. Onshore Wind Turbine Application
Operational Landscape: The onshore wind segment remains the volumetric anchor of component demand. Mainstream newly installed onshore turbine ratings crossed an average of 7.07 MW in 2025, up from 5.X MW platforms just two years prior. Onshore commercial installations are centered on 6.X MW to 10.0 MW nameplate classes, operating with rotor diameters extending past 200 meters.
Process Split Dynamics: The onshore domain, historically exclusive to forged shafts, is experiencing structural penetration by ductile iron castings. In the sub-6 MW range, forged shafts retain high manufacturing efficiency and established qualification bases. In the 6.X MW to 10 MW categories deployed across inland mega-complexes, OEMs are increasingly migrating to cast hollow shafts to minimize top-head nacelle mass, mitigating high transportation and heavy-crane erection costs.
Market Trajectories: Global onshore capacity additions hit approximately 155.3 GW in 2025, driven overwhelmingly by China's aggressive commissioning of its "Three Norths" (North, Northwest, Northeast) renewable energy bases, which accounted for roughly 79.0% of domestic additions. Projections indicate global onshore installations will stabilize within a high-volume run-rate, approaching 160 GW annually toward 2030. Key OEM procurement centers directing component demand include Goldwind (which secured over 25 GW in domestic installations in 2025), Windey, Sany Heavy Energy, Envision Energy, CRRC, Vestas, GE Vernova, and Nordex.
2. Offshore Wind Turbine Application
Operational Landscape: The offshore turbine sector serves as the technology frontier for drivetrain engineering. Commercial installations achieved an average unit rating exceeding 10.1 MW in 2025. Industrial deployment is rapidly standardizing around 12 MW, 14 MW, 16 MW, and 18 MW platforms, with initial 20 MW to 26 MW prototypes entering field validation in coastal trial zones.
Process Split Dynamics: Cast main shafts have captured primary technical selection in offshore applications. The extreme mass penalties associated with nacelle weight at tower hub heights of 150 meters and above make the weight-to-power density of hollow ductile cast iron critical. Furthermore, the elevated vibration-damping capacity of cast iron significantly mitigates multi-axial wave-current-wind cyclic fatigue stresses encountered in marine environments, safeguarding downstream planetary gear stages and direct-drive permanent magnet generator air gaps.
Logistical Clustering and Coastal Infrastructure: The sheer dimensions of offshore main shafts—frequently exceeding 4 meters in diameter, over 6 meters in length, and weighing 60 to 120 metric tons per finished component—render long-distance inland highway transportation impossible. Consequently, manufacturing footprints have reorganized into specialized coastal industrial parks. Production facilities featuring dedicated deep-water quayside berths have been established in hubs such as Dongying, Qingdao, and Zhangjiagang, allowing direct loading of raw cast and finish-machined shafts onto specialized heavy-lift vessels for transit to OEM nacelle assembly yards.
Market Trajectories: Global offshore wind is projected to expand at an aggressive CAGR of 15.0% to 28.0% over the coming decade, with annual capacity additions forecast to reach 55.45 GW by 2034. In 2025, China installed approximately 6.59 GW of offshore capacity, propelled by provincial marine allocations and deep-sea energy development mandates. Global procurement is directed by specialized offshore OEMs, led by Goldwind, Mingyang Smart Energy, Shanghai Electric, Dongfang Electric, Siemens Gamesa, and Vestas.
VALUE CHAIN ARCHITECTURE AND VALUE MIGRATION
● Upstream Structural Economics: Direct Feedstock Dynamics
Direct raw materials constitute between 40.0% and 52.0% of the total manufacturing cost of a wind turbine main shaft. Cost performance is directly tethered to the procurement dynamics of three core materials: heavy industrial steel scrap, specialized low-titanium pig iron, and critical ferroalloys (primarily ferrochrome, ferromolybdenum, and nickel).
The midstream forging industry relies on access to scrap steel and high-purity alloy ingots, processed through electric arc furnaces (EAF), ladle refining (LF), and vacuum degassing (VD) systems to minimize hydrogen embrittlement and control non-metallic macro-inclusions. For foundries producing cast shafts, the critical constraint is the availability of high-purity pig iron with low trace elements (e.g., Ti < 0.02%, P < 0.03%, S < 0.02%), as excessive titanium disrupts graphite nodulization and degrades low-temperature impact properties.
Heavy capital equipment poses an imposing entry barrier. A market-competitive heavy forging facility requires capital investments exceeding 100 million USD to secure 80MN to 120MN free-forging hydraulic presses, 300-ton fully automated rail-bound forging manipulators, specialized horizontal deep-hole trepanning lathes, and computerized car-bottom quenching furnaces. In contrast, modern casting operations demand automated continuous resin-sand reclamation loops, 30-ton medium-frequency induction melting furnaces, heavy 500-ton bridge cranes, and advanced casting simulation platforms (e.g., MAGMAsoft) to model thermal solidification profiles and suppress shrink defect formation.
● Midstream Manufacturing and Processing Architecture
The conversion chain from raw melt to delivery follows a rigorous eight-stage workflow:
1. Smelting and Ingot Casting / Spheroidal Iron Melt Preparation: Precise thermal regulation and chemical spectrum verification via optical emission spectrometry.
2. Primary Forming: High-temperature open-die hydraulic forging with programmed reduction ratios, or resin sand mold cavity pouring under protective chilling conditions.
3. Rough Machining: Heavy-duty vertical and horizontal CNC turning to remove oxidation scale and establish initial datum planes.
4. Heat Treatment: Quenching and high-temperature tempering cycles (forged steel) or controlled stress-relief annealing (ductile iron) to achieve target grain structures.
5. High-Precision CNC Finishing: Deep-hole boring, finish turning of journal bearing interfaces to micron-scale roundness tolerances, and high-speed CNC drilling of hub-mounting flange bolt patterns.
6. Comprehensive Non-Destructive Testing (NDT): Rigorous phased array ultrasonic inspection across 100.0% of the component volume, accompanied by magnetic particle inspection to eliminate surface and near-surface microfissures.
7. Surface Treatment and Corrosion Protection: Shot blasting to Sa 2.5/Sa 3.0 purity, followed by multi-coat high-durability epoxy-polyurethane coatings certified under ISO 12944 (C5-M marine exposure ratings).
8. Factory Acceptance and Subassembly Integration: Optional shrink-fitting of main bearing inner races, installation of protective labyrinth seals, and packaging in climate-controlled transport rigs.
REGIONAL MARKET DYNAMICS
● Asia-Pacific (APAC)
Asia-Pacific represents the dominant growth engine and manufacturing core of the global wind turbine main shaft industry, commanding roughly 80.0% of total global installations in 2025. China anchors the region, having added 130.0 GW of new hoisting capacity in 2025, accounting for over 70.0% of worldwide volume. The expansion was underpinned by massive onshore developments within the "Three Norths" renewable energy complexes, which made up 79.0% of China's onshore capacity additions. Concurrently, Chinese turbine exports rose 48.9% year-on-year to 7.73 GW across 28 international markets, expanding indirect export demand for domestically forged and cast shafts.
India has reinforced its status as a high-growth production and consumption center, commissioning between 6.05 GW and 6.34 GW of onshore wind in 2025, an 85.0% year-on-year surge. Growth is underpinned by the central government's 500 GW non-fossil capacity target by 2030 and structured auctions for Firm and Dispatchable Renewable Energy (FDRE). Leading domestic turbine manufacturers, such as Suzlon Energy and Inox Wind (the latter maintaining an order book exceeding 4.4 GW), have significantly increased component procurement from domestic industrial forging platforms like Bharat Forge Limited and specialized suppliers like SE Forge.
Across the broader Asia-Pacific region, Australia delivered between 1.43 GW and 2.13 GW of new utility-scale wind capacity in 2025. Mature East Asian markets, specifically Japan, South Korea, and Taiwan, China, advanced offshore wind deployment pipelines. Developers in Taiwan, China continued the buildout of multi-megawatt offshore zones, standardizing on large European-designed turbine platforms (such as the Vestas V236-15.0 MW) that utilize massive, low-temperature ductile iron cast main shafts.
● Europe
Europe accounted for approximately 12.0% of new global turbine capacity in 2025, installing 19.1 GW (with onshore wind expanding 20.0% year-on-year to 17.4 GW), which brought total cumulative European wind operational assets beyond 300.0 GW. Germany consolidated its position as the premier European onshore market, adding between 5.2 GW and 6.9 GW in 2025—a 116.0% surge—buoyed by the issuance of over 20.0 GW of new construction permits and 14.4 GW of successful auction awards.
The United Kingdom remains the regional focal point for utility offshore deployment. The historic Allocation Round 7 (AR7) auctions awarded a record 8.44 GW of offshore wind capacity underpinned by 20-year Contracts for Difference (CfDs), re-energizing regional drivetrain demand. In peripheral markets, Sweden commissioned 1.40 GW, Spain deployed 1.20 GW, and Poland advanced its Baltic Sea buildout by completing 3.44 GW in offshore CfD awards.
However, European turbine OEMs (Vestas, Nordex, Siemens Gamesa) face relentless cost pressures, high regional energy input costs for electric arc furnace operations, and stringent environmental compliance under the EU Emissions Trading System (ETS). These factors have accelerated reliance on imported cast and forged main shafts sourced directly from coastal Chinese foundries, despite European Union industrial strategies seeking to protect local domestic component manufacturing bases.
● North America
North America accounted for approximately 4.0% of global capacity additions in 2025, adding roughly 7.0 GW in the United States and 1.09 GW in Canada. The United States market remains concentrated, with GE Vernova and Vestas commanding an estimated 88.0% of domestic turbine installations. Underlying demand fundamentals remain strong, propelled by corporate clean-energy PPAs and power requirements from hyperscale artificial intelligence data center developments and heavy industrial reshoring.
However, procurement cycles experienced near-term volatility due to shifting federal regulatory frameworks. The transition from the Inflation Reduction Act (IRA) to the One Big Beautiful Bill Act (OBBBA), enacted in July 2025, recalibrated project timelines. Under revised safe-harbor parameters, projects commencing physical construction after July 4, 2026, must enter commercial operation by December 31, 2027, to secure Production Tax Credits (PTC) or Investment Tax Credits (ITC), driving an immediate commercial rush to execute supply orders across late 2025 and early 2026.
Simultaneously, U.S. Customs and Border Protection (CBP) enforcement under the Uyghur Forced Labor Prevention Act (UFLPA), combined with Section 301 tariffs on structural Chinese steel and iron imports, has complicated cross-border supply chains. This friction has renewed interest in domestic open-die forging champions such as Scot Forge, while incentivizing global OEMs to evaluate North American and European forging partnerships for domestic supply security.
● Latin America
Latin America contributed roughly 2.0% of global new wind capacity in 2025, deploying less than 4.0 GW—representing a 27.0% year-on-year contraction. Brazil, the region's historic installation hub, experienced a sharp cyclical downturn, adding 2.36 GW (a 43.0% drop compared to 2024 additions). The contraction was caused by structural transmission bottlenecks, grid curtailment in the Northeast wind corridor, elevated local benchmark interest rates, and power market electricity price volatility. Global OEMs operating regional assembly bases, such as Vestas (which delivered 1.28 GW in Brazil in 2025), scaled down factory utilization.
Latin America will reach a cyclical trough in 2026 before entering a gradual recovery cycle, supported by new auction allocations and merchant clean-energy developments across Chile, Colombia, and Mexico. Latin American wind development remains entirely dependent on imported midstream main shaft components, primarily imported from China.
● Middle East and Africa (MEA)
The Middle East and Africa region accounted for 2.0% of global wind additions in 2025, installing 3.3 GW, a 32.0% year-on-year increase. Türkiye served as the primary base for industrial wind components in the region, installing 1.72 GW of new capacity and supporting a domestic component fabrication export hub. Growth across the Middle East is anchored in Saudi Arabia's Vision 2030 mega-projects, with the Kingdom entering an accelerated renewable capital deployment phase projected to surpass 2.20 GW of installations in 2026.
In Africa, growth was led by South Africa, which commissioned between 484 MW and 1.20 GW of utility wind projects under revived Renewable Independent Power Producer Procurement Programme (REIPPPP) bidding windows and direct corporate procurement by mining houses. Across the MEA territory, wind infrastructure procurement is tied to sovereign energy diversification mandates and industrial green hydrogen (Power-to-X) export facilities.
REGULATORY ARCHITECTURE AND POLICY DRIVERS
● China Regulatory Framework
China's policy architecture combines competitive power market reform with strategic marine expansion mandates:
1. Document No. 136 ("136 Hao Wen"): Deepened the market-oriented trading of renewable electricity, exposing wind assets to wholesale locational marginal pricing and time-of-use adjustments. This has compelled utility asset owners (e.g., CHN Energy, SPIC, China Three Gorges) to demand higher capital efficiencies and reliability from OEM turbines, accelerating the integration of cast main shafts to lower upfront capital expenditure.
2. The Deep-Water "Dan 30" Standard: The Ministry of Natural Resources enforced regulations requiring newly sanctioned offshore wind developments to be constructed at least 30 kilometers from the baseline coastline or within marine waters exceeding 30 meters in depth. This policy has pushed turbine deployment away from shallow waters directly into deep-sea wind bands, accelerating commercial selection of 15.0 MW to 20.0 MW platforms that require massive ductile iron cast main shafts.
3. Decarbonization and Capacity Targets: At COP30, China announced its NDC 3.0 commitment targeting over 3,600 GW of combined operational wind and solar capacity by 2035. Concurrently, the Beijing Wind Power Declaration 2.0 established an operational installation target of at least 120.0 GW annually throughout the 15th Five-Year Plan (2026-2030).
4. Fiscal Incentives: The Ministry of Finance extended the 50.0% immediate value-added tax (VAT) refund mechanism for self-produced offshore wind electricity from November 2025 through December 2027, preserving developer balance sheets for offshore capital equipment orders.
● European Union and United Kingdom Directives
1. Net-Zero Industry Act (NZIA) and European Wind Power Action Plan: The European Union restructured clean energy competitive auctions by mandating non-price criteria—accounting for up to 30.0% of award scoring—evaluating supply chain resilience, cybersecurity, environmental footprint, and domestic industrial contributions. The framework also enforced accelerated permitting protocols, capping offshore approval workflows at a maximum of 12 months.
2. The Hamburg Declaration: Ratified in January 2026 by nine North Sea maritime nations (including Germany, the United Kingdom, France, Denmark, and the Netherlands), this treaty coordinates cross-border marine spatial planning, standardized tender designs, and shared offshore interconnection grids to build out 100.0 GW of offshore wind by 2050.
3. United Kingdom Contract for Difference (CfD) Reforms: The UK Department for Energy Security and Net Zero adjusted Allocation Round 7 (AR7) terms, extending standard CfD indexed revenue guarantees from 15 years to 20 years, clearing 8.44 GW of offshore wind commitments.
● United States Legislative Architecture
1. The One Big Beautiful Bill Act (OBBBA): Passed in July 2025, OBBBA amended the mechanics of the Internal Revenue Code Sections 45 and 48. Crucially, the legislation established that projects starting physical construction after July 4, 2026, must achieve grid synchronization and commercial operation prior to December 31, 2027, to secure the full Production Tax Credit (PTC) or Investment Tax Credit (ITC). This compression has triggered an immediate surge in turbine component procurement across 2025 and 2026.
2. Advanced Manufacturing Production Credit (Section 45X): Provides direct domestic production tax credits for qualified wind turbine structural components manufactured inside the United States, providing localized support for domestic heavy forging and fabrication assets.
3. Trade Enforcement and Tariff Barriers: Stringent CBP enforcement of the Uyghur Forced Labor Prevention Act (UFLPA) mandates exhaustive supply chain tracing of raw steel and iron smelt feeds. Coupled with persistent Section 301 and anti-dumping tariffs on Chinese structural forged and cast parts, these barriers create friction and drive regional price spreads for finished main shaft assemblies.
STRATEGIC OPPORTUNITIES AND STRUCTURAL INHIBITORS
● Market Growth Catalysts
1. The Casting Metallurgical Paradigm Shift
The most potent technological catalyst reshaping market economics is the irreversible shift from open-die alloy steel forging to spheroidal graphite (ductile) iron casting. In the sub-5 MW era, forging reigned supreme due to predictable metallurgical properties, standard ingot sourcing, and low tooling barriers. However, as turbine nameplate capacities enter 8 MW to 10 MW onshore and 15 MW to 30 MW offshore, forging encounters severe technical and economic ceilings:
* Ingot Core Consolidation Limits: Producing a forged shaft for an 18 MW turbine requires steel ingots exceeding 150 metric tons. Achieving sound metallurgical reduction at the core of an ingot of this size requires forging presses of 150MN or greater—machinery that is globally scarce.
* Material Inefficiency: Forging a solid cylindrical shaft and then trepanning or boring out the center to generate a hollow profile wastes 20.0% to 35.0% of the raw, expensive alloy ingot as low-value turnings.
* Structural Flexibility: Cast iron enables single-step near-net-shape formation of hollow, variable-wall, complex structural geometries, including integral bearing journals and direct rotor flange connections. Ductile iron's natural graphite spheroids also provide superior mechanical damping for extreme wind shear vibrations. Foundries that master low-temperature, high-nodularity casting will capture market share from legacy open-die forge shops.
2. Offshore Deep-Water Deployment and Floating Foundations
The global offshore wind sector is expanding at a projected CAGR exceeding 20.0% through the next decade. Propelled by industrial mandates such as China's "Dan 30" regulatory framework and Europe's Hamburg Declaration, commercial arrays are moving into deep-water maritime corridors. Floating offshore wind concepts—which are transitioning from pilot validation to commercial auctions in the UK, France, Norway, Japan, and South Korea—experience complex multi-axis hydrodynamic wave and wind forces. These operational profiles require heavier, single-piece integrated cast main shafts designed to stabilize rotating masses and resist asymmetric cyclic stresses.
3. The Global Fleet Repowering Wave
An underappreciated commercial driver is the aging onshore wind fleet across mature renewable jurisdictions, notably in Germany, Denmark, Spain, and the United States. Thousands of early-generation 1.0 MW to 2.0 MW wind turbines installed in the early 2000s are reaching the end of their operational design lifespans. Asset developers are increasingly executing repowering programs—demolishing obsolete turbines and installing modern 5.0 MW to 7.0 MW platforms within existing permitted boundaries. This dynamic creates a recurring, programmatic procurement stream for high-capacity main shafts independent of greenfield site permitting constraints.
4. Hyperscale Compute and Dedicated Clean-Power PPAs
The exponential expansion of generative artificial intelligence infrastructure, large language model compute clusters, and high-density data centers is creating an unprecedented corporate thirst for around-the-clock, utility-scale clean electricity. Major technology conglomerates are bypassing public utility interconnection queues by signing direct corporate Power Purchase Agreements (PPAs) with wind developers, or directly co-locating hyperscale data center facilities adjacent to massive multi-gigawatt wind complexes. This unconstrained, balance-sheet-backed private capital infusion is expanding the forward order books of tier-1 OEMs, providing stable demand visibility for midstream main shaft manufacturers.
● Structural Market Inhibitors
1. Grid Interconnection Queues and Evacuation Bottlenecks
The single greatest bottleneck to turbine installation schedules—and by extension, midstream component procurement—is the structural inadequacy of regional high-voltage transmission networks. Across the globe, operational wind deployment is outstripping transmission capacity:
* In China, curtailment risks have re-emerged across the "Three Norths" mega-bases, prompting local energy authorities to link new project approvals directly to regional ultra-high-voltage (UHV) direct-current transmission construction schedules.
* In Europe, grid operators face multi-year wait times for substation transformers and switchgear, delaying grid connections across Germany, the United Kingdom, and the North Sea basin.
* In North America, regional transmission organization (RTO) interconnection queues represent hundreds of gigawatts of stranded clean-energy capacity, with average interconnection study timelines extending to five years. Delays in balance-of-plant electrical infrastructure push back OEM turbine delivery dates and induce cyclical volatility in component orders.
2. Geopolitical Fragmentation and Trade Fencing
The wind power value chain is caught in a web of escalating trade protectionism, geopolitical fragmentation, and industrial reshoring mandates:
1. The United States continues aggressive enforcement of the Uyghur Forced Labor Prevention Act (UFLPA), imposing complex supply chain tracing requirements on raw steel and pig iron inputs. Concurrently, Section 301 tariffs on Chinese steel and iron structural fabrications inflate delivered component costs for Western OEMs.
2. The European Union's Net-Zero Industry Act (NZIA) introduces resilience and local content scoring into national auctions, attempting to insulate European casting and forging operations from lower-cost Asian competition.
3. Emerging markets (such as India and Brazil) enforce domestic content requirements (e.g., India's Revised List of Models and Manufacturers.
1.1 Study Scope and Research Architecture 1
1.2 Research Methodology and Estimation Framework 2
1.3 Primary Data Sourcing and Verification Protocols 3
1.4 Secondary Data Mining and Cross-Validation 4
1.5 Critical Forecasting Assumptions and Model Calibration 5
1.6 Standardized Technical Units and Acronyms 6
Chapter 2 Executive Matrix and Macroeconomic Context 7
2.1 Global Wind Turbine Main Shaft Industry Synthesis (2021-2031) 7
2.2 Energy Transition Mandates and Levelized Cost of Energy (LCOE) Dynamics 8
2.3 Mega-Watt Scale Expansion and Structural Component Loading Thresholds 9
2.4 Cross-Sector Material Flow and Industrial Sourcing Bottlenecks 10
Chapter 3 Value Chain Mechanics, Cost Breakdown, and Metallurgy 11
3.1 Upstream Ingot/Scrap Sourcing and Alloy Composition (34CrNiMo6, 42CrMo4) 11
3.2 Manufacturing Metallurgy: Open-Die Forging vs. Heavy Nodular Ductile Cast Iron (EN-GJS-400-18U) 13
3.3 Critical Processing: Ingot Casting, Quenching & Tempering, Heavy-Duty CNC Machining, and Non-Destructive Testing (UT/MT) 15
3.4 Industrial Value Chain Cost Deposition Analysis 17
3.5 OEM Sourcing Architectures and Strategic Supply Agreements 19
Chapter 4 Global Wind Turbine Main Shaft Market by Manufacturing Process 21
4.1 Process Taxonomy and Mechanical Property Benchmarking 21
4.2 Forged Main Shaft Market Size and Volume Trajectory (2021-2031) 23
4.3 Cast Main Shaft Market Size and Volume Trajectory (2021-2031) 25
4.4 Price Parity, Heavy Press Capacity Availability, and Foundry Scale Shifts 27
Chapter 5 Global Wind Turbine Main Shaft Market by Application 29
5.1 Turbine Architecture and Drive Train Configuration Matrix (Geared vs. Direct Drive vs. Hybrid) 29
5.2 Onshore Wind Turbine Application Analysis (2021-2031) 31
5.3 Offshore Wind Turbine Application Analysis (2021-2031) 33
5.4 Corrosion Protection, Marine Environment Tolerance, and Dimensional Upsizing (15MW+ Platforms) 35
Chapter 6 Cross-Border Trade Flows, Tariffs, and Logistics 37
6.1 Global Trade Corridor Topology and Hub-and-Spoke Logistics 37
6.2 Specialized Heavy-Lift Sea and Land Transportation Dynamics 39
6.3 Trade Protectionism, Anti-Dumping Duties, and Carbon Border Adjustment Mechanisms (CBAM) 41
6.4 Major Exporter Hub Analysis: China, Germany, South Korea, India 43
6.5 Major Importer Hub Analysis: United States, Denmark, Spain, Netherlands, Brazil 45
Chapter 7 Global Wind Turbine Main Shaft Production Footprint and Capacity 47
7.1 Global Heavy Forging and Casting Nameplate vs. Effective Capacity 47
7.2 Heavy Press/Hammer Distribution (10,000+ Ton Hydraulic Presses) 49
7.3 Large-Scale Foundry Capacity Utilization and Environmental Permitting 51
7.4 Regional Manufacturing Capacity Forecast (2021-2031) 53
Chapter 8 Global and Regional Market Sizing: Consumption and Revenue 55
8.1 Global Installation Volumes, Turbine Deliveries, and Shaft Demand (2021-2031) 55
8.2 North America 57
8.2.1 United States 58
8.2.2 Canada 59
8.3 Europe 60
8.3.1 Germany 61
8.3.2 Denmark 62
8.3.3 Spain 63
8.3.4 United Kingdom 64
8.3.5 Netherlands & Rest of Europe 65
8.4 Asia-Pacific 66
8.4.1 China 67
8.4.2 India & Southeast Asia 68
8.4.3 South Korea & Japan 69
8.4.4 Australia and New Zealandn 70
8.5 Latin America & MEA 71
8.5.1 Brazil 72
8.5.2 South Africa 74
Chapter 9 Competitive Landscape and Tiering Structure 75
9.1 Tier-1 Supplier Dominance and Market Concentration Ratios (CR4, CR8, HHI) 75
9.2 OEM Internal Sourcing vs. Merchant Forging/Foundry Procurement 76
9.3 Technology Roadmap: Integrated Bearing-Shaft Systems and Hollow Cast Structures 77
9.4 Supplier Margin Analysis and Raw Material Pass-Through Clauses 78
Chapter 10 Corporate Intelligence and Financial Dissections 79
10.1 SKF 79
10.1.1 Corporate Structure and Heavy Engineering Footprint 79
10.1.2 Main Shaft Portfolio and Integrated Drive Train Systems 80
10.1.3 Operational Performance, Unit Cost, and Revenue Metrics (2021-2026) 81
10.1.4 Strategic Positioning and SWOT Analysis 82
10.2 Jinlei Technology 83
10.2.1 Corporate Structure and Heavy Engineering Footprint 83
10.2.2 Main Shaft Portfolio and Production Capabilities 84
10.2.3 Operational Performance, Unit Cost, and Revenue Metrics (2021-2026) 85
10.2.4 Strategic Positioning and SWOT Analysis 86
10.3 Taewoong Corporation 87
10.3.1 Corporate Structure and Heavy Engineering Footprint 87
10.3.2 Main Shaft Portfolio and Heavy Forging Lines 88
10.3.3 Operational Performance, Unit Cost, and Revenue Metrics (2021-2026) 89
10.3.4 Strategic Positioning and SWOT Analysis 90
10.4 Tongyu Heavy Industry 91
10.4.1 Corporate Structure and Heavy Engineering Footprint 91
10.4.2 Main Shaft Portfolio and Production Lines 92
10.4.3 Operational Performance, Unit Cost, and Revenue Metrics (2021-2026) 93
10.4.4 Strategic Positioning and SWOT Analysis 94
10.5 Riyue Heavy Industry 95
10.5.1 Corporate Structure and Heavy Engineering Footprint 95
10.5.2 Cast Main Shaft Portfolio and Heavy Casting Infrastructure 96
10.5.3 Operational Performance, Unit Cost, and Revenue Metrics (2021-2026) 97
10.5.4 Strategic Positioning and SWOT Analysis 98
10.6 Jiangsu Sinojit Wind Energy Technology 99
10.6.1 Corporate Structure and Heavy Engineering Footprint 99
10.6.2 Main Shaft Portfolio and Casting/Machining Assets 100
10.6.3 Operational Performance, Unit Cost, and Revenue Metrics (2021-2026) 101
10.6.4 Strategic Positioning and SWOT Analysis 102
10.7 Zhangjiagang Guangda Special Material 103
10.7.1 Corporate Structure and Heavy Engineering Footprint 103
10.7.2 Forged Main Shaft Portfolio and Ingot Metallurgical Lines 104
10.7.3 Operational Performance, Unit Cost, and Revenue Metrics (2021-2026) 105
10.7.4 Strategic Positioning and SWOT Analysis 106
10.8 Scot Forge 107
10.8.1 Corporate Structure and Heavy Engineering Footprint 107
10.8.2 Main Shaft Portfolio and Open-Die Forging Operations 108
10.8.3 Operational Performance, Unit Cost, and Revenue Metrics (2021-2026) 109
10.8.4 Strategic Positioning and SWOT Analysis 110
10.9 Saarstahl 111
10.9.1 Corporate Structure and Heavy Engineering Footprint 111
10.9.2 Main Shaft Portfolio and Forged Components 112
10.9.3 Operational Performance, Unit Cost, and Revenue Metrics (2021-2026) 113
10.9.4 Strategic Positioning and SWOT Analysis 114
10.10 Bharat Forge Limited 115
10.10.1 Corporate Structure and Heavy Engineering Footprint 115
10.10.2 Main Shaft Portfolio and Forging Infrastructure 116
10.10.3 Operational Performance, Unit Cost, and Revenue Metrics (2021-2026) 117
10.10.4 Strategic Positioning and SWOT Analysis 118
Chapter 11 Strategic Risk Assessment and Market Trajectory 119
Table 2 Wind Turbine Main Shaft Market Value and Volume Projections (2021-2031) 8
Table 3 Turbine Nameplate Capacity Class vs. Shaft Weight and Dimensional Requirements 10
Table 4 Chemical Composition and Mechanical Properties of Wind Turbine Shaft Alloys 12
Table 5 Manufacturing Cost Deposition Matrix: Forging vs. Casting (USD/Tonne and %) 18
Table 6 Global Wind Turbine Main Shaft Market by Manufacturing Process (Units), 2021-2031 22
Table 7 Global Wind Turbine Main Shaft Market by Manufacturing Process (USD Million), 2021-2031 23
Table 8 Forged Wind Turbine Main Shaft Market by Region (Units and USD Million), 2021-2031 24
Table 9 Cast Wind Turbine Main Shaft Market by Region (Units and USD Million), 2021-2031 26
Table 10 Global Wind Turbine Main Shaft Market by Application (Units), 2021-2031 30
Table 11 Global Wind Turbine Main Shaft Market by Application (USD Million), 2021-2031 30
Table 12 Onshore Wind Turbine Main Shaft Market by Region (Units and USD Million), 2021-2031 32
Table 13 Offshore Wind Turbine Main Shaft Market by Region (Units and USD Million), 2021-2031 34
Table 14 Global Wind Turbine Main Shaft Trade Balance Matrix by Key Region (2026) 38
Table 15 Main Shaft Export Volumes and Values by Primary Exporting Nation (2021-2026) 44
Table 16 Main Shaft Import Volumes and Values by Primary Importing Nation (2021-2026) 46
Table 17 Global Heavy Forging and Casting Effective Production Capacity (2021-2031) 48
Table 18 Global Operational Hydraulic Heavy Presses Dedicated to Wind Energy Shafts 50
Table 19 Regional Production Capacity Distribution (Thousand Metric Tonnes), 2021-2031 54
Table 20 Global Main Shaft Consumption Volume by Region (Units), 2021-2031 55
Table 21 Global Main Shaft Market Value by Region (USD Million), 2021-2031 56
Table 22 North America Main Shaft Market by Country (Units and USD Million), 2021-2031 57
Table 23 Europe Main Shaft Market by Country (Units and USD Million), 2021-2031 60
Table 24 Asia-Pacific Main Shaft Market by Country (Units and USD Million), 2021-2031 66
Table 25 Latin America Main Shaft Market by Country (Units and USD Million), 2021-2031 71
Table 26 Middle East & Africa Main Shaft Market by Country (Units and USD Million), 2021-2031 73
Table 27 Global Market Concentration Metrics: CR4, CR8, and Herfindahl-Hirschman Index (2021-2026) 75
Table 28 SKF Wind Turbine Main Shaft Sales, Price, Cost and Gross Profit Margin (2021-2026) 81
Table 29 Jinlei Technology Wind Turbine Main Shaft Sales, Price, Cost and Gross Profit Margin (2021-2026) 85
Table 30 Taewoong Corporation Wind Turbine Main Shaft Sales, Price, Cost and Gross Profit Margin (2021-2026) 89
Table 31 Tongyu Heavy Industry Wind Turbine Main Shaft Sales, Price, Cost and Gross Profit Margin (2021-2026) 93
Table 32 Riyue Heavy Industry Wind Turbine Main Shaft Sales, Price, Cost and Gross Profit Margin (2021-2026) 97
Table 33 Jiangsu Sinojit Wind Energy Technology Wind Turbine Main Shaft Sales, Price, Cost and Gross Profit Margin (2021-2026) 101
Table 34 Zhangjiagang Guangda Special Material Wind Turbine Main Shaft Sales, Price, Cost and Gross Profit Margin (2021-2026) 105
Table 35 Scot Forge Wind Turbine Main Shaft Sales, Price, Cost and Gross Profit Margin (2021-2026) 109
Table 36 Saarstahl Wind Turbine Main Shaft Sales, Price, Cost and Gross Profit Margin (2021-2026) 113
Table 37 Bharat Forge Limited Wind Turbine Main Shaft Sales, Price, Cost and Gross Profit Margin (2021-2026) 117
Figure 1 Global Wind Turbine Main Shaft Market Value Breakdown (2021-2031) 8
Figure 2 End-to-End Wind Turbine Main Shaft Value Chain Architecture 12
Figure 3 Manufacturing Flow Comparison: Open-Die Forging vs. Large-Section Ductile Casting 16
Figure 4 Global Wind Turbine Main Shaft Market Share by Manufacturing Process (2026 vs. 2031) 22
Figure 5 Production Cost Divergence: Forged vs. Cast Shafts by Megawatt Rating 28
Figure 6 Global Wind Turbine Main Shaft Market Share by Application (2026 vs. 2031) 31
Figure 7 Turbine Hub and Shaft Mechanical Stress Profiles (Offshore vs. Onshore) 36
Figure 8 Global Supply-Demand Balance and Logistics Corridors for Turbine Main Shafts 38
Figure 9 Main Shaft Heavy Component Sea Transport Route Complexity Index 40
Figure 10 Global Wind Turbine Main Shaft Manufacturing Capacity by Region (2026) 48
Figure 11 Global Wind Turbine Main Shaft Consumption Volume Share by Region (2026) 56
Figure 12 United States Wind Turbine Main Shaft Market Trend (2021-2031) 58
Figure 13 Germany Wind Turbine Main Shaft Sourcing and Installation Trend (2021-2031) 61
Figure 14 Denmark Wind Turbine Main Shaft Demand Profile (2021-2031) 62
Figure 15 Spain Wind Turbine Main Shaft Consumption Profile (2021-2031) 63
Figure 16 China Wind Turbine Main Shaft Production vs. Domestic Demand (2021-2031) 67
Figure 17 India Wind Turbine Main Shaft Market Trajectory (2021-2031) 68
Figure 18 South Korea Wind Turbine Main Shaft Export and Consumption Matrix (2021-2031) 69
Figure 19 Brazil Wind Turbine Main Shaft Market Trajectory (2021-2031) 72
Figure 20 Competitive Positioning Matrix: Heavy Press Capacity vs. International OEM Penetration 76
Figure 21 SKF Wind Turbine Main Shaft Market Share (2021-2026) 82
Figure 22 Jinlei Technology Wind Turbine Main Shaft Market Share (2021-2026) 86
Figure 23 Taewoong Corporation Wind Turbine Main Shaft Market Share (2021-2026) 90
Figure 24 Tongyu Heavy Industry Wind Turbine Main Shaft Market Share (2021-2026) 94
Figure 25 Riyue Heavy Industry Wind Turbine Main Shaft Market Share (2021-2026) 98
Figure 26 Jiangsu Sinojit Wind Energy Technology Wind Turbine Main Shaft Market Share (2021-2026) 102
Figure 27 Zhangjiagang Guangda Special Material Wind Turbine Main Shaft Market Share (2021-2026) 106
Figure 28 Scot Forge Wind Turbine Main Shaft Market Share (2021-2026) 110
Figure 29 Saarstahl Wind Turbine Main Shaft Market Share (2021-2026) 114
Figure 30 Bharat Forge Limited Wind Turbine Main Shaft Market Share (2021-2026) 118
Figure 31 Critical Supply Chain Vulnerability Index Across Main Shaft Metallurgical Nodes 120
Research Methodology
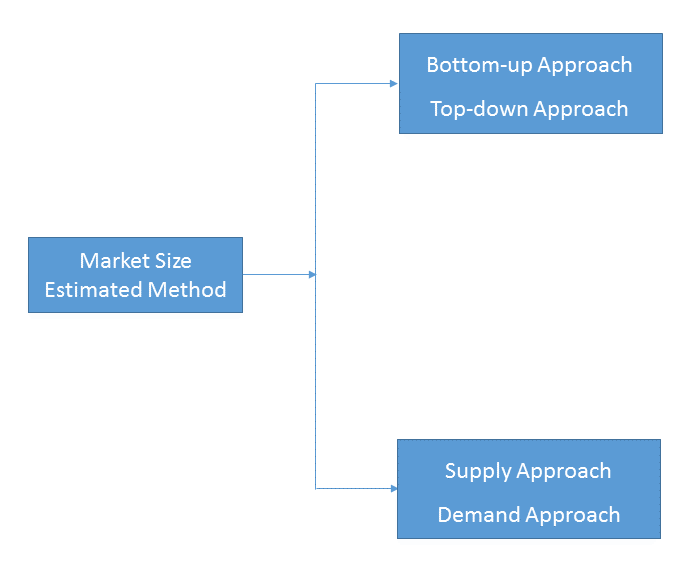
- Market Estimated Methodology:
Bottom-up & top-down approach, supply & demand approach are the most important method which is used by HDIN Research to estimate the market size.
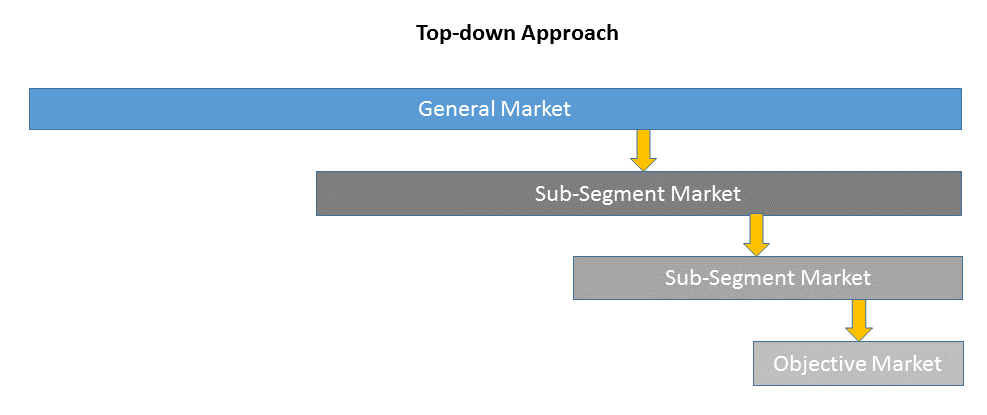
1)Top-down & Bottom-up Approach
Top-down approach uses a general market size figure and determines the percentage that the objective market represents.
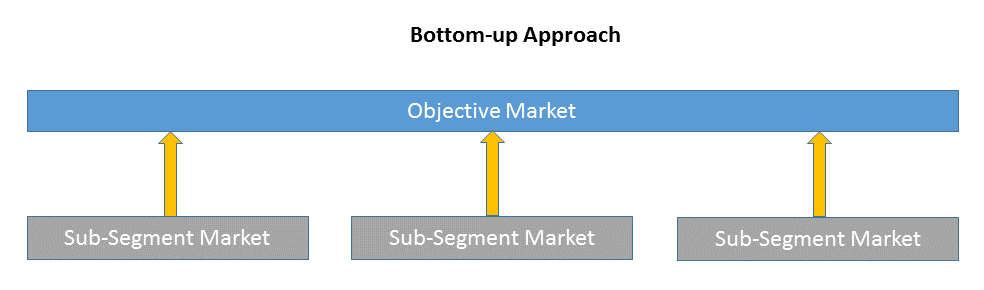
Bottom-up approach size the objective market by collecting the sub-segment information.
2)Supply & Demand Approach
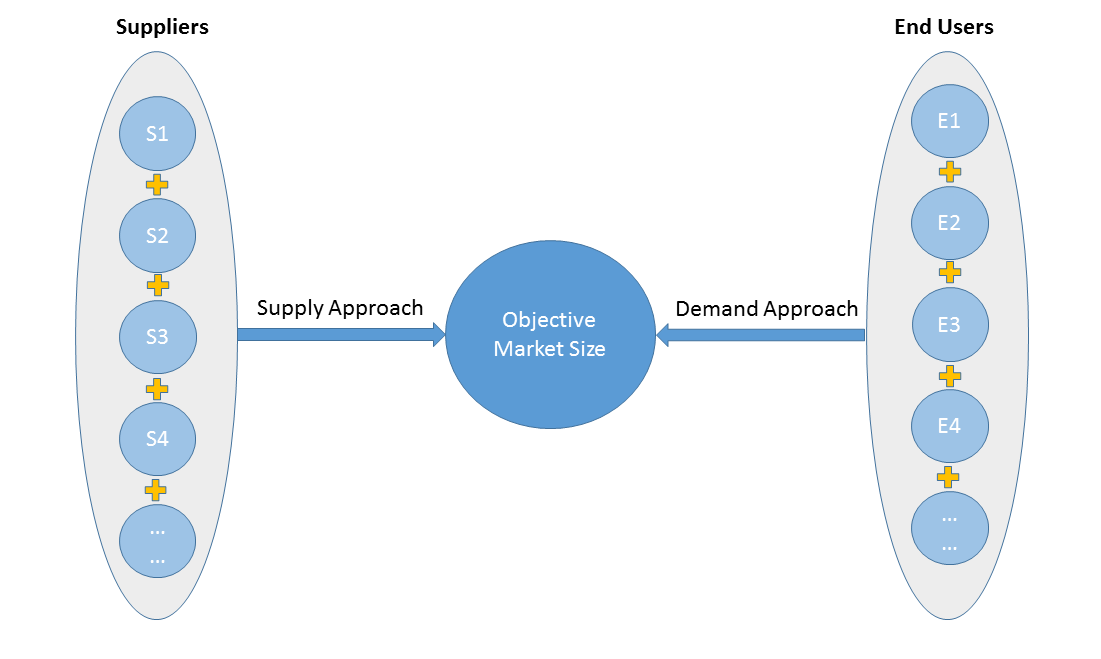
Supply approach is based on assessments of the size of each competitor supplying the objective market.
Demand approach combine end-user data within a market to estimate the objective market size. It is sometimes referred to as bottom-up approach.
- Forecasting Methodology
- Numerous factors impacting the market trend are considered for forecast model:
- New technology and application in the future;
- New project planned/under contraction;
- Global and regional underlying economic growth;
- Threatens of substitute products;
- Industry expert opinion;
- Policy and Society implication.
- Analysis Tools
1)PEST Analysis
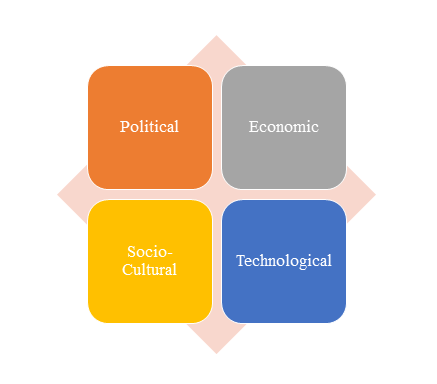
PEST Analysis is a simple and widely used tool that helps our client analyze the Political, Economic, Socio-Cultural, and Technological changes in their business environment.
- Benefits of a PEST analysis:
- It helps you to spot business opportunities, and it gives you advanced warning of significant threats.
- It reveals the direction of change within your business environment. This helps you shape what you’re doing, so that you work with change, rather than against it.
- It helps you avoid starting projects that are likely to fail, for reasons beyond your control.
- It can help you break free of unconscious assumptions when you enter a new country, region, or market; because it helps you develop an objective view of this new environment.
2)Porter’s Five Force Model Analysis
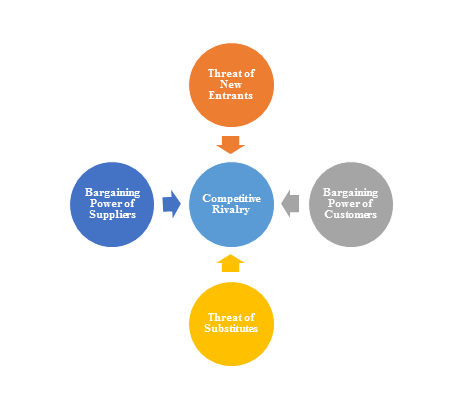
The Porter’s Five Force Model is a tool that can be used to analyze the opportunities and overall competitive advantage. The five forces that can assist in determining the competitive intensity and potential attractiveness within a specific area.
- Threat of New Entrants: Profitable industries that yield high returns will attract new firms.
- Threat of Substitutes: A substitute product uses a different technology to try to solve the same economic need.
- Bargaining Power of Customers: the ability of customers to put the firm under pressure, which also affects the customer's sensitivity to price changes.
- Bargaining Power of Suppliers: Suppliers of raw materials, components, labor, and services (such as expertise) to the firm can be a source of power over the firm when there are few substitutes.
- Competitive Rivalry: For most industries the intensity of competitive rivalry is the major determinant of the competitiveness of the industry.
3)Value Chain Analysis
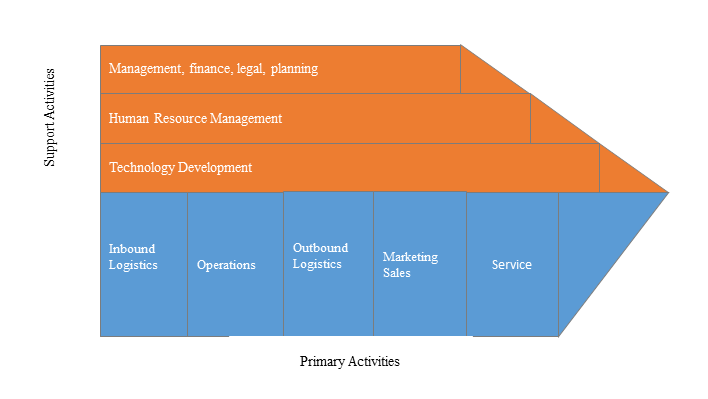
Value chain analysis is a tool to identify activities, within and around the firm and relating these activities to an assessment of competitive strength. Value chain can be analyzed by primary activities and supportive activities. Primary activities include: inbound logistics, operations, outbound logistics, marketing & sales, service. Support activities include: technology development, human resource management, management, finance, legal, planning.
4)SWOT Analysis
SWOT analysis is a tool used to evaluate a company's competitive position by identifying its strengths, weaknesses, opportunities and threats. The strengths and weakness is the inner factor; the opportunities and threats are the external factor. By analyzing the inner and external factors, the analysis can provide the detail information of the position of a player and the characteristics of the industry.
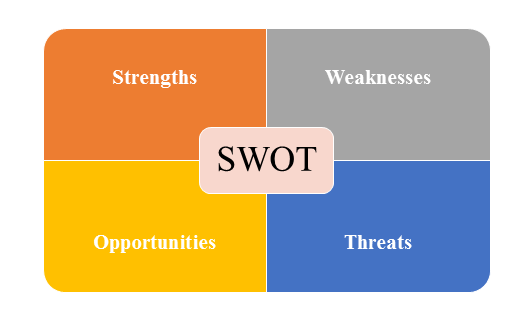
- Strengths describe what the player excels at and separates it from the competition
- Weaknesses stop the player from performing at its optimum level.
- Opportunities refer to favorable external factors that the player can use to give it a competitive advantage.
- Threats refer to factors that have the potential to harm the player.
- Data Sources
| Primary Sources | Secondary Sources |
|---|---|
| Face to face/Phone Interviews with market participants, such as: Manufactures; Distributors; End-users; Experts. Online Survey |
Government/International Organization Data: Annual Report/Presentation/Fact Book Internet Source Information Industry Association Data Free/Purchased Database Market Research Report Book/Journal/News |