Global Wind Turbine Gearbox Market Outlook & Analysis
- Single User License (1 Users) $ 3,500
- Team License (2~5 Users) $ 4,500
- Corporate License (>5 Users) $ 5,500
The global wind turbine gearboxes market size is valued between 5.9 billion USD and 6.9 billion USD in 2026 with a compound annual growth rate of 3% to 5% through 2031. This expansionary phase is anchored by historic renewable energy capacity deployments achieved in 2025, when global wind grid additions hit an unprecedented 169.00 GW, up 38.0% year over year, pushing cumulative operational wind capacity past 1,299.00 GW. Drivetrain engineering is experiencing a structural pivot away from legacy multi-stage parallel topologies toward ultra-high-torque-density, medium-speed semi-direct platforms and hydrodynamic sliding journal bearing configurations designed to withstand multi-megawatt torsional spikes.
Geographically, the Asia-Pacific region commands absolute operational scale, generating roughly 80.0% of worldwide capacity additions in 2025, anchored by 120.00 GW deployed across China and over 6.00 GW across India. Onshore infrastructure forms the baseline volume driver with 155.30 GW added globally, while the 13.70 GW offshore sector functions as the primary technological proving ground for next-generation platforms exceeding 16.0 MW to 20.0 MW.
Beneath this volumetric momentum lies an acute margin compression cycle. Independent merchant gearbox suppliers face severe margin erosion due to the extreme rigidity of upstream raw material inputs—where high-purity alloy gear steel, precision bearings, and nodular iron castings comprise over 70% of total unit manufacturing costs—juxtaposed against aggressive pricing concessions extracted by original equipment manufacturers (OEMs). Concurrently, downstream OEMs are pursuing internal vertical integration by insourcing gearbox manufacturing lines, permanently altering the traditional merchant merchant-supplier nexus and compelling independent driveline manufacturers to pivot toward export channels, multi-megawatt medium-speed conversions, and the lucrative wind fleet repowering aftermarket.
REGIONAL MARKET DYNAMICS
● Asia-Pacific (APAC)
The Asia-Pacific corridor serves as the global manufacturing core and volumetric anchor of the wind transmission sector. The regional market added over 126.00 GW of combined wind generation across China and India alone in 2025.
China remains the center of gravity for drivetrain manufacturing and deployment. Total grid connections reached 120.00 GW in 2025, reflecting a 51.0% annual increase. Onshore installations absorbed 110.00 GW, propelled by the rapid operationalization of mega-scale renewable bases across northern and western desert territories, while offshore grid connections delivered 6.59 GW. Cumulative installed wind generation crossed 640.00 GW. Public turbine procurement tenders logged 121.24 GW. Goldwind led global and domestic nacelle output with 29.30 GW installed globally, holding a 21.0% domestic market share and capturing 37.9% of the Chinese offshore nacelle market. SANY Renewable Energy expanded domestic deliveries by 61.0% year over year to 14.71 GW, capturing an 11.24% share. Market pricing mechanics began stabilizing following the industry self-disciplinary convention against predatory pricing signed by major turbine OEMs, though merchant gearbox producers continue to battle thin margins.
India has reinforced its stance as a major regional engine, adding between 6.05 GW and 6.34 GW of onshore capacity in 2025, an 85.0% surge over the previous year. Cumulative wind generation reached approximately 57.00 GW against a broader technical potential of 1,164.00 GW. Domestic industrial capacity stands near 24.00 GW annually. Indian equipment manufacturers, including Inox Wind with a backlog exceeding 4.40 GW and Suzlon Energy deploying its proprietary 5.0 MW and 6.3 MW platforms, are driving domestic subcomponent consumption. Strict content enforcement via the Approved List of Models and Manufacturers (ALMM) mandates that 75.0% to 80.0% or more of wind turbine subsystems be domestically sourced, forcing international transmission builders to form joint ventures or expand localized facilities within the domestic corridor.
Across mature APAC territories, Australia commissioned 2,125 MW in 2025, while Japan, South Korea, and Taiwan, China advanced offshore foundation trials and drivetrain field validations. Drivetrain sourcing across these satellite economies remains split between established European transmission brands and tier-one Chinese merchant suppliers navigating localized trade frameworks.
● Europe
The European market is defined by a strategic bifurcation between large-scale repowering programs in central economies and ultra-deepwater offshore deployments along the North Sea basin. The continent commissioned 19.10 GW of wind capacity in 2025, with onshore assets contributing 17.40 GW, pushing cumulative operational capacity beyond 300.00 GW.
Germany consolidated its position as the continent's dominant land-based installation hub, adding between 5.20 GW and 6.896 GW of onshore generation to surpass 68.00 GW cumulative capacity. The German federal auction framework awarded 14.40 GW in onshore capacity tenders and issued new construction permits exceeding 20.00 GW, securing sustained replacement demand for 6.0 MW to 7.0 MW+ drivetrains. In the offshore sector, the United Kingdom closed its Allocation Round 7 (AR7) Contracts for Difference auction by awarding 8.44 GW of capacity—8.20 GW fixed-bottom and 0.24 GW floating—representing the largest regional offshore procurement round recorded to date. Regional additions were further sustained by Sweden (1.4 GW), Spain (1.2 GW), Poland (992 MW), and France (474 MW).
Strategic European drivetrain operations are increasingly guided by regulatory policy. The Net-Zero Industry Act (NZIA) introduced mandatory non-price criteria—evaluating cybersecurity, component provenance, carbon footprint resilience, and local labor practices—within state renewable auctions. This framework was conceived to shield native transmission engineering specialists from ultra-low-cost Asian imports. Cross-border capital collaboration was reaffirmed via the Hamburg Declaration signed at the 3rd North Sea Summit in January 2026, establishing legal targets for 100.00 GW of cross-border offshore arrays by 2050 and 300.00 GW of total North Sea offshore wind assets.
● North America
With short-term procurement momentum tempered by regulatory cliff-effects and trade compliance friction, total North American installations stood near 8.09 GW in 2025, with the United States deploying roughly 6.999 GW and Canada contributing 1.094 GW.
The United States market experienced complex regulatory transitions. While Section 45X Advanced Manufacturing Production Credits under the Inflation Reduction Act supported local assembly lines, legislative mechanisms under the One Big Beautiful Bill Act (OBBBA) enacted in mid-2025 introduced an abrupt phase-out schedule. Projects initiating physical construction after July 4, 2026, must achieve commercial operation by December 31, 2027, to capture production tax credits, while manufacturing tax credits for mechanical nacelle components face termination after 2027. This regulatory compression is triggering a near-term capital expenditure push followed by an anticipated installation trough. Concurrently, supply chain flows encountered friction as Customs and Border Protection enforced Uyghur Forced Labor Prevention Act (UFLPA) audits against cross-border subcomponent shipments routed through Mexico, delaying nacelle deliveries and exacerbating local gearbox replacement backlogs.
● Latin America (LATAM)
The Latin American sector experienced a sharp cyclical deceleration, contracting by 27.0% year over year in 2025 to beneath 4.00 GW.
Brazil, the primary regional manufacturing and operational hub, commissioned between 2.30 GW and 2.40 GW in 2025, down 43.0% compared to 2024. Macroeconomic headwinds, high local interest rates, depressed free-market wholesale electricity tariffs, and transmission interconnect backlogs curtailed new power purchase agreement executions. Merchant gearbox suppliers operating Brazilian assembly hubs were forced to downscale run-rates and reorient production capacity toward aftermarket servicing and international export fulfillments.
● Middle East and Africa (MEA)
The MEA regional market accounts for roughly 2.0% of the worldwide volume base but demonstrates dynamic acceleration. Annual installations expanded by 32.0% year over year in 2025.
South Africa delivered 1,197 MW of onshore additions, driven by private-sector off-take agreements and utility auction rounds. Turkey advanced domestic fleet operations by adding 1.716 GW, up 17.0% year over year, underpinned by localized drivetrain content regulations. Saudi Arabia initiated heavy infrastructure spending, moving toward multi-gigawatt utility deployments to diversify its domestic generation mix, establishing large-scale procurement funnels for high-torque, desert-rated drivetrains capable of operating under extreme ambient thermal variance and airborne particulate loads.
SUPPLY CHAIN & VALUE CHAIN ARCHITECTURE
● Upstream Segment: Raw Materials and Core Subsystems
The economic baseline of the wind turbine gearbox industry is dictated by raw material input pricing. Direct materials account for approximately 70.39% of total production expenses, leaving midstream fabricators structurally exposed to metallurgical price volatility.
High-integrity alloy gear steel represents the foundational material requirement. Carburizing alloy steel grades, predominantly 18CrNiMo7-6, are required to exhibit extreme metallurgical purity, high hardenability, and zero structural inclusions to avoid fatigue delamination under cyclical multi-megawatt torque reversals. Specialized material producers, such as Guanda Special Material, have achieved ultrasonic flaw detection acceptance rates of 97.0% at 0.5 mm defect thresholds, securing the localized metallurgical feedstock required for 10 MW+ planet and sun gear forgings.
Heavy structural nodular iron castings, primarily QT700-2 and QT500-14, constitute the bulk mass of gearbox main frames, planet carriers, and outer ring housings. Sourcing is concentrated among mega-scale foundries, including Riyi Heavy Industry (controlling over 700,000 tons of specialized annual casting capacity), Tongyu Heavy Industry, and Jinlei Technology. The upstream value chain is completed by precision rolling bearings, hydrodynamic fluid film journal sleeves, and centralized forced lubrication cooling networks supplied by specialized subsystem providers like Pangu Intelligent and Hove AS.
● Midstream Segment: Manufacturing Precision and Processing Bottlenecks
Midstream engineering constitutes a capital-intensive manufacturing layer governed by tight tolerance thresholds and heavy capital expenditure cycles. The fabrication of multi-megawatt wind transmission systems requires high-tonnage open-die forging presses (up to 15,000 tons), large-envelope CNC gear hobbing and grinding machinery capable of achieving ISO 1328 Grade 4 precision classes, computer-controlled deep-pit atmosphere carburizing and quenching furnaces, and full-load dynamic test benches exceeding 20.0 MW ratings.
A critical value migration within the midstream tier is the widespread technological transition from conventional rolling-element planet bearings to hydrodynamic sliding journal bearings. Under multi-megawatt operational loadings, roller bearings suffer from white-etching cracking, micro-pitting, and edge-loading failures. Hydrodynamic plain bearings distribute load over an unbroken fluid lubrication wedge, elevating radial load-carrying limits, reducing planet carrier dimensions, eliminating catastrophic bearing-cage failure modes, and yielding up to a 20% to 30% reduction in total gearbox mass for comparable torque ratings.
● Downstream Segment: Turbine OEMs, Utilities, and Vertical Integration Tensions
Downstream distribution terminates with complete turbine nacelle assemblers (such as Goldwind, Mingyang Smart Energy, Vestas, Siemens Gamesa, GE Vernova, SANY Renewable Energy, and Windey) and end-user asset developers, which are predominantly state-backed utility conglomerates (e.g., China Three Gorges, SPIC, China Energy Group) and international independent power producers.
The most disruptive structural friction within the value chain stems from aggressive OEM vertical integration. Major wind turbine OEMs have progressively established in-house gearbox R&D and serial manufacturing subsidiaries. By fabricating speed-increasing transmissions internally, turbine assemblers capture midstream manufacturing margins and directly integrate the mechanical gearbox housing into the main turbine chassis. This insourcing compresses addressable procurement volumes for independent merchant gearbox builders, sparking direct competitive tension and accelerating an industry consolidation cycle. Independent suppliers are consequently forced to build customer relationships with non-integrated international OEMs or pivot capital toward industrial aftermarket retrofits and precision non-wind transmissions.
DETAILED PRODUCT CLASSIFICATIONS & DOWNSTREAM APPLICATIONS
● High-Speed Gearbox Segment
High-speed transmissions have historically represented the primary mechanical architecture deployed across the global onshore wind industry.
Technical Configuration and Mechanics:
A standard high-speed wind turbine gearbox employs a three-stage mechanical reduction train. The most common topologies feature two planetary reduction stages coupled to a final parallel-axis helical gear stage (2P1H), or a single planetary stage feeding into two high-speed helical stages (1P2H). This drivetrain configuration accelerates the rotor blade speed (typically 5 to 20 RPM at the main low-speed shaft) up to 1,000 to 1,800 RPM at the high-speed output shaft. This output directly drives a high-speed Double-Fed Induction Generator (DFIG) or conventional asynchronous generator.
Operational Performance and Commercial Boundaries:
High-speed architectures maintain broad commercial adoption because high-speed DFIG generators require smaller copper windings and lower capital investment compared to low-speed direct-drive generator alternatives. Furthermore, the global supply chain for high-speed components, replacement parts, and industrial gear oils is fully scaled.
During the 2025-2026 cycle, high-speed DFIG transmissions pushed into historically unprecedented multi-megawatt onshore classes. SANY Renewable Energy achieved serial commercial deployment of 8.0 MW integrated high-speed DFIG gearboxes and initiated full field testing of 10.0 MW high-speed DFIG platforms. Concurrently, Yinchuan Weili Transmission operationalized production lines for 8.0 MW double-fed gearboxes while accelerating commercialization of 10.0 MW high-speed platforms.
The high-speed architecture faces defined physical boundaries at 10.0 MW+ scales. As rotor diameters exceed 200 meters, input rotational speeds drop, producing massive input torque loads that must be magnified across three gear stages. This mechanical structure subjects the high-speed output pinion and bearings to extreme pitch-line velocities and cyclical bending stresses, raising micro-pitting risks and nacelle top-head mass.
● Medium-Speed Gearbox Segment (Semi-Direct Drive)
Medium-speed gearboxes—frequently designated as semi-direct drive, compact drive, or Medium Compact Drive (MCD) platforms—represent the fastest-growing technological segment in the multi-megawatt and offshore arenas.
Technical Configuration and Mechanics:
A medium-speed drivetrain utilizes an integrated single-stage or two-stage planetary speed increaser, completely eliminating the high-speed parallel helical gear stage. The gearbox interfaces directly with a medium-speed Permanent Magnet Synchronous Generator (PMSG) or medium-speed DFIG running at rotational speeds between 150 RPM and 500 RPM. The reduction ratio is significantly lower than that of high-speed gearboxes (typically 1:15 to 1:45, versus 1:100+ for high-speed systems).
Operational Performance and Growth Vectors:
The medium-speed segment is expanding across large onshore installations (6.25 MW to 10.0 MW) and deepwater offshore arrays (10.0 MW to 20.0 MW+). By excising the high-speed parallel stage, the system eliminates the most vibration-sensitive, failure-prone mechanical components. Medium-speed gearboxes achieve markedly superior torque densities, compact structural envelopes, lower gear tooth velocities, and superior sealing integrity against maritime corrosive environments.
The structural integration of the medium-speed gearbox and the generator rotor into a single, cohesive nacelle module reduces structural steel mass, eases transport logistics, and relieves structural strain on turbine yaw platforms. Major global players, led by Flender (with its Winergy HybridDrive platform) and ZF Wind Power, have made medium-speed architectures their primary technological vector for the next generation of 15.0 MW to 20.0 MW offshore drivetrains.
● Downstream Application: Onshore Wind Turbines
Onshore installations serve as the volume baseline of the global transmission market, absorbing 155.30 GW of new wind turbine capacity in 2025. China led this demand with 110.00 GW of onshore connections (+51.0% YoY), driven by the mobilization of state mega-bases across the Gobi Desert and inland provinces, paired with repowering installations across Europe.
A rapid escalation in individual turbine nameplate ratings characterizes the onshore sector. Chinese Renewable Energy Society Wind Energy Committee (CWEA) documentation demonstrates that the average rating for newly installed onshore turbines reached 7,160 kW (7.16 MW) in 2025, marking an 18.3% annual increase. Commercial deployment of units between 7.0 MW and 9.1 MW grew by 13.3% year over year, while onshore machines rated at 10.0 MW and above expanded by 19.6%.
Downstream procurement dynamics are focused on absolute capital efficiency. Onshore wind farm operators and balance-of-plant EPC contractors operate under grid-parity economics, transmitting severe pricing pressure downstream to nacelle integrators and gearbox fabricators. Onshore gearboxes must achieve compact dimensional envelopes to comply with road transport dimensional clearances while maintaining structural fatigue margins under extreme ambient thermal shifts and complex mountainous shear turbulence.
● Downstream Application: Offshore Wind Turbines
The offshore segment functions as the high-margin, technologically demanding frontier of the wind equipment industry. While global offshore additions reached 13.70 GW in 2025 (with China deploying 6.59 GW), cumulative global offshore assets are projected to grow from 83.00 GW in 2024 to over 441.00 GW by 2034.
The offshore application space mandates extreme engineering reliability. Offshore gearboxes must support unit nameplate ratings from 10.0 MW to 20.0 MW+, withstand dynamic wave-action loads, incorporate high-capacity pressurized internal oil lubrication and filtration circuits, and utilize C5-M marine-grade exterior barrier coatings. Downtime costs associated with offshore crane vessel mobilization can reach hundreds of thousands of dollars per day, rendering component failures catastrophic to project levelized costs of electricity. Drivetrain development is heavily concentrated on integrated medium-speed topologies utilizing multi-point plain journal bearings, which provide the high torque density and multi-decade fatigue life essential for surviving remote, deepwater offshore deployments.
COMMERCIAL DISTRIBUTION & SALES CHANNEL MECHANICS
● Direct OEM Sales Channel (B2B Strategic Supply)
Merchant wind turbine gearbox commercialization operates entirely through direct, high-barrier B2B enterprise procurement networks. Independent gearbox manufacturers do not distribute hardware via third-party distributors or merchant agent networks. Instead, sales operations rely on long-term strategic master framework agreements negotiated directly with complete nacelle integrators (e.g., Goldwind, Mingyang Smart Energy, Vestas, Siemens Gamesa, GE Vernova, SANY Renewable Energy, and Windey).
Manufacturing scheduling is carried out under a build-to-order protocol. Gearbox production schedules are tied to monthly rolling delivery forecasts and balance-of-plant construction milestones issued by OEM clients. Unit pricing mechanisms employ cost-plus structures indexed to baseline metallurgical commodity spot markets (alloy gear steel, pig iron, copper) combined with volume discounts and customer credit assessments.
Contract payment structures involve milestone billing and deferred retention clauses. OEM buyers issue an initial cash deposit upon order confirmation, deliver progress milestone payments upon factory acceptance testing and site delivery, and routinely withhold 5% to 10% of total invoice amounts as a quality performance warranty holdback. This retention pool is frozen across an operational defect-free warranty window spanning 3 to 5 years, exposing gearbox suppliers to long cash-conversion cycles and balance-sheet working capital burdens.
● Aftermarket O&M, Refurbishment, and Repowering Channels
The global maturation of the installed turbine fleet has converted aftermarket operations into a critical, high-margin revenue channel. In China alone, over 50,000 wind turbines exceeding 80.00 GW of capacity have surpassed 10 years of active field service, entering an era of elevated mechanical fatigue and component degradation.
Merchant gearbox builders maintain specialized aftermarket service arms focused on drivetrain condition monitoring, on-site endoscopic gear-tooth inspections, high-speed pinion field replacements, dynamic vibration diagnostics, and factory remanufacturing. Furthermore, asset owners across North America and Europe are pursuing repowering campaigns—dismantling older 1.5 MW to 3.0 MW turbines and utilizing existing grid interconnection rights to install 4.0 MW to 7.0 MW+ units equipped with modern, high-torque gearboxes. The specialized wind operations and maintenance aftermarket represents a recurring, counter-cyclical revenue source carrying superior gross margins compared to initial equipment serial production.
KEY MARKET PLAYERS
● Nanjing High Speed Gear Manufacturing Co., Ltd. (NGC): Headquartered in Nanjing, China, and operating under China High-Speed Transmission Equipment Group, NGC is the largest volume manufacturer of wind turbine gearboxes globally, with a field deployment footprint exceeding 100,000 main transmissions operating across global wind markets.
● Hangzhou Advance Gearbox Group Co., Ltd.: Based in Hangzhou, Zhejiang Province, China, Hangzhou Advance Gearbox Group is a historic heavy-machinery transmission builder with operations spanning marine transmissions, heavy industrial gearing, and clean energy step-up gearboxes.
● CRRC Qishuyan Institute Co., Ltd.: Located in Changzhou, Jiangsu Province, China, CRRC Qishuyan functions as the material engineering and transmission manufacturing arm of rail conglomerate CRRC Corporation.
● Dalian HHI Group (Dalian Huarui Heavy Industry): Located in Dalian, Liaoning Province, China, DHHI is a state-owned heavy equipment manufacturing conglomerate with specialized divisions dedicated to wind mechanical subassemblies, including gearboxes, large-diameter slewing rings, and casting modules.
● Chongqing Gearbox Co., Ltd.: Headquartered in Chongqing, China, and operating as a key subsidiary of China State Shipbuilding Corporation (CSSC), Chongqing Gearbox leverages marine naval propulsion expertise to build high-capacity industrial and wind turbine drivetrains.
● Flender (Winergy): Based in Bocholt, Germany, Flender is an international transmission manufacturer whose dedicated wind brand, Winergy, has supplied over 400 GW of mechanical drivetrain capacity to global markets.
● ZF Friedrichshafen AG (ZF Wind Power): Headquartered in Friedrichshafen, Germany, with wind business headquarters in Lommel, Belgium, ZF Friedrichshafen is a tier-one driveline and mobility supplier whose ZF Wind Power unit serves as a leading independent gearbox partner to global turbine builders.
● Eickhoff Antriebstechnik GmbH: Situated in Bochum, Germany, Eickhoff possesses over 150 years of mechanical engineering lineage, specializing in gearboxes built for extreme-shock industrial environments, specialized mining machines, and wind energy applications.
● Nabtesco Corporation: Headquartered in Tokyo, Japan, Nabtesco is the global pioneer in precision cycloidal reduction drives, controlling a dominant share of the worldwide industrial robotics reducer market and deploying this technology into renewable energy actuation.
Strategic Pivot: Transitioning wind turbine nacelle orientation away from conventional multi-stage planetary gear sets toward compact, zero-backlash cycloidal drives equipped with active condition monitoring.
● Hyosung Heavy Industries: Based in Seoul, South Korea, Hyosung Heavy Industries is a major heavy industrial, electrical transformer, and power machinery conglomerate with proprietary wind nacelle and transmission manufacturing capabilities.
● Elecon Engineering Company Limited: Located in Vallabh Vidyanagar, Gujarat, India, Elecon Engineering is one of the largest transmission equipment and material-handling gear manufacturers in South Asia.
● Delijia Transmission Technology (Jiangsu) Co., Ltd.: Headquartered in Changzhou, Jiangsu Province, China, Delijia Transmission Technology has rapidly expanded as a focused specialist in high-torque wind turbine transmissions.
● Yinchuan Weili Transmission Technology Co., Ltd.: Located in Yinchuan, Ningxia, China, Weili Transmission is a public high-technology enterprise specializing in the design, engineering, and manufacture of precision reducers for clean energy sectors.
OPPORTUNITIES & CRITICAL CHALLENGES
● Growth Vectors & Market Catalysts
The transition toward 10 MW+ to 20 MW+ medium-speed semi-direct drive platforms is the defining technological catalyst across the mechanical transmission ecosystem. In ultra-large onshore and offshore wind applications, conventional three-stage high-speed drivetrains are encountering mechanical torque-retention ceilings. Medium-speed drivetrains, which excise the high-speed parallel helical gear stage, substantially compress top-head nacelle mass, lower gear-pitch linear velocities, and decouple the transmission system from high-frequency dynamic vibrations. This modular topology yields high system-level reliability and provides the structural density needed for turbines deploying offshore rotor sweeps exceeding 250 meters.
Concurrently, the transition from rolling-element bearings to hydrodynamic plain sliding bearings is resolving structural reliability bottlenecks. The deployment of fluid film sliding bearings inside multi-megawatt planetary gear stages distributes radial shock loads over continuous oil films, avoiding white-structure flaking, surface micro-pitting, and roller-element skidding failures. This mechanical redesign reduces planet gear carrier dimensions and yields a 20% to 30% reduction in overall transmission weight, unlocking material cost optimizations for manufacturers.
Wind farm repowering and aftermarket technical support represent an additional high-margin market opportunity. With over 80.00 GW of global wind turbine assets exceeding 10 years of operational service, component fatigue rates are climbing rapidly. The domestic Chinese wind operations and maintenance aftermarket alone is projected to exceed 4.17 billion USD (30.00 billion CNY). Gearbox rebuilds, condition monitoring integrations, precision gear-tooth regrinding, and full-unit repowering with higher-capacity mechanical drivetrains offer independent gear fabricators recurring, high-margin cash flows that offset margin volatility in original-equipment procurement channels.
Finally, floating offshore wind infrastructure commercialization is opening long-term demand channels. Global floating installations are forecast to scale from roughly 83.20 GW in 2024 to 441.00 GW by 2034. Floating offshore foundations introduce complex hydro-mechanical and wave-motion dynamics, generating multiaxial non-linear torsional loads across nacelle drivetrains. This operating environment creates high economic barriers to entry, benefiting premium transmission manufacturers capable of engineering dynamic load-mitigating gear systems paired with advanced marine sealing and integrated cooling loops.
● Structural Bottlenecks & Operational Risks
The wind turbine gearbox sector is constrained by severe cost rigidity. Direct raw materials—primarily high-purity alloy gear steel (18CrNiMo7-6), nodular pig iron, and precision rolling components—comprise approximately 70.39% of total manufacturing costs. This concentrated cost structure leaves midstream gearbox manufacturers highly vulnerable to raw material price inflation, as their capital-intensive machining assets and high fixed overhead prevent them from absorbing sustained material cost spikes.
Compounding this raw material exposure is downstream pricing deflation and extended capital-retention terms. Fierce price competition among turbine OEMs during project tenders is transmitted directly up the value chain to component suppliers. Independent transmission fabricators face demands for structural price cuts, even as product performance and nameplate megawatt expectations rise. Commercial frameworks that mandate 5% to 10% quality warranty retainages, held by clients across 3-to-5-year warranty terms, lock up working capital, lengthen cash conversion cycles, and increase bad-debt exposure during market downturns.
Concurrently, vertical integration by wind turbine OEMs poses an existential threat to independent merchant transmission builders. Complete nacelle assemblers are increasingly internalizing gearbox design, assembly, and testing. By establishing captive in-house transmission manufacturing lines, OEMs absorb midstream margins and optimize nacelle packaging. This shift compresses procurement volumes for merchant gearbox manufacturers, resulting in underutilized capacity and prompting merchant players to accelerate international export expansion.
Finally, escalating geopolitical protectionism, cross-border tariffs, and local content rules fragment global transmission trade. Supply chain operations face increasing regulatory hurdles, including the European Union’s Net-Zero Industry Act non-price auction rules, India's Approved List of Models and Manufacturers (ALMM) content thresholds, and strict US trade policy enforcement, such as UFLPA border audits on cross-border subcomponents. These trade barriers prevent the centralized distribution of low-cost, high-volume mechanical components, forcing international transmission builders to invest heavily in decentralized, regionalized manufacturing and assembly facilities to maintain global market access.
1.1 Market Definition and Statistical Coverage 1
1.2 Research Framework and Baseline Modeling Logic 2
1.3 Primary Source Attribution and Field Interviews 3
1.4 Secondary Validation Models and Econometric Forecasting 4
1.5 Currency Conversions, Unit Standards, and Exchange Factors 5
1.6 Acronyms and Technical Nomenclature 6
Chapter 2 Executive Market Landscape and Quantitative Baselines 7
2.1 Global Wind Turbine Gearbox Market Size by Value (2021-2031) 7
2.2 Global Wind Turbine Gearbox Production and Consumption Volume (2021-2031) 8
2.3 Average Realized Selling Price Architecture and Volatility Drivers 10
2.4 Structural Industry Drivers: Megawatt Scaling and Torque Density Evolution 11
Chapter 3 Value Chain Architecture, Metallurgy, and Manufacturing Economics 13
3.1 Upstream High-Grade Alloy Steel Forging and Raw Material Economics 13
3.2 Bearing Systems, Carburizing Heat Treatment, and Precision Grinding Dynamics 14
3.3 Value Chain Margin Distribution and Value Retention Analysis 15
3.4 Direct Drive vs. Geared Drivetrain Technological Migration Realities 16
Chapter 4 Global Wind Turbine Gearbox Market Breakdown by Type 18
4.1 High-Speed Gearbox Segment 18
4.1.1 Historical and Forecast Volume (2021-2031) 18
4.1.2 Historical and Forecast Market Value (2021-2031) 19
4.1.3 Multi-Stage Planetary-Helical Structural Developments 20
4.2 Medium-Speed Gearbox (Hybrid Drivetrain) Segment 21
4.2.1 Historical and Forecast Volume (2021-2031) 21
4.2.2 Historical and Forecast Market Value (2021-2031) 22
4.2.3 Integrated Semi-Direct Drive Adoption Trajectory 23
4.3 Drivetrain Efficiency, Weight Optimization, and Failure Rate Comparison 24
Chapter 5 Global Wind Turbine Gearbox Market Breakdown by Application 25
5.1 Onshore Wind Turbine Systems 25
5.1.1 Historical and Forecast Volume (2021-2031) 25
5.1.2 Historical and Forecast Market Value (2021-2031) 26
5.1.3 Repowering and Low-Wind-Speed High-Capacity Trends 27
5.2 Offshore Wind Turbine Systems 28
5.2.1 Historical and Forecast Volume (2021-2031) 28
5.2.2 Historical and Forecast Market Value (2021-2031) 29
5.2.3 Extreme Load Resistance, Corrosion Mitigation, and Megawatt Upscaling (10MW+) 30
Chapter 6 Cross-Border Trade Flows, Tariffs, and Supply Chain Logistics 31
6.1 Global Trade Footprint: Major Exporting vs. Importing Hubs 31
6.2 Trade Policy, Local Content Requirements, and Supply Resilience 32
6.3 Heavy Logistics Constraints, Nacelle Integration Bottlenecks, and Lead Times 33
Chapter 7 North America Wind Turbine Gearbox Market 34
7.1 Regional Market Size, Demand Volume, and Production Overview (2021-2031) 34
7.2 United States 35
7.3 Canada 36
Chapter 8 Europe Wind Turbine Gearbox Market 37
8.1 Regional Market Size, Demand Volume, and Production Overview (2021-2031) 37
8.2 Germany 38
8.3 Denmark 39
8.4 Spain 40
8.5 United Kingdom 41
8.6 Netherlands & Rest of Europe 42
Chapter 9 Asia-Pacific Wind Turbine Gearbox Market 43
9.1 Regional Market Size, Demand Volume, and Production Overview (2021-2031) 43
9.2 China 44
9.3 India & Southeast Asia 45
9.4 Japan 46
9.5 South Korea 47
9.6 Australia 48
Chapter 10 Latin America and Middle East & Africa Markets 49
10.1 Latin America Regional Aggregates (2021-2031) 49
10.1.1 Brazil 50
10.1.2 Chile 51
10.2 Middle East and Africa Regional Aggregates (2021-2031) 52
10.2.1 South Africa 53
10.2.2 Saudi Arabia 54
Chapter 11 Industry Competition Dynamics and Vendor Positioning 55
11.1 Global Tiering Framework and Manufacturer Market Share Analysis 55
11.2 OEM In-House Integration vs. Merchant Gearbox Supplier Dynamics 57
11.3 Patent Intelligence, Gear Tooth Micro-Geometry, and Reliability Analytics 58
Chapter 12 Enterprise Intelligence and Comparative Operational Profiles 60
12.1 Nanjing High Speed Gear Manufacturing Co. Ltd. (NGC) 60
12.1.1 Corporate Structure and Production Capacity Footprint 60
12.1.2 Product Portfolio and Drivetrain Capabilities 61
12.1.3 Strategic SWOT Diagnostic 62
12.1.4 Operational Metrics: Volume, Pricing, Cost Base, and Gross Margin 63
12.2 Hangzhou Advance Gearbox Group 64
12.2.1 Corporate Structure and Production Capacity Footprint 64
12.2.2 Product Portfolio and Drivetrain Capabilities 65
12.2.3 Strategic SWOT Diagnostic 66
12.2.4 Operational Metrics: Volume, Pricing, Cost Base, and Gross Margin 67
12.3 CRRC Qishuyan 68
12.3.1 Corporate Structure and Production Capacity Footprint 68
12.3.2 Product Portfolio and Drivetrain Capabilities 69
12.3.3 Strategic SWOT Diagnostic 70
12.3.4 Operational Metrics: Volume, Pricing, Cost Base, and Gross Margin 71
12.4 Dalian HHI Group 72
12.4.1 Corporate Structure and Production Capacity Footprint 72
12.4.2 Product Portfolio and Drivetrain Capabilities 73
12.4.3 Strategic SWOT Diagnostic 74
12.4.4 Operational Metrics: Volume, Pricing, Cost Base, and Gross Margin 75
12.5 Chongqing Gearbox Co. Ltd 76
12.5.1 Corporate Structure and Production Capacity Footprint 76
12.5.2 Product Portfolio and Drivetrain Capabilities 77
12.5.3 Strategic SWOT Diagnostic 78
12.5.4 Operational Metrics: Volume, Pricing, Cost Base, and Gross Margin 79
12.6 Flender 80
12.6.1 Corporate Structure and Production Capacity Footprint 80
12.6.2 Product Portfolio and Drivetrain Capabilities 81
12.6.3 Strategic SWOT Diagnostic 82
12.6.4 Operational Metrics: Volume, Pricing, Cost Base, and Gross Margin 83
12.7 ZF Friedrichshafen AG 84
12.7.1 Corporate Structure and Production Capacity Footprint 84
12.7.2 Product Portfolio and Drivetrain Capabilities 85
12.7.3 Strategic SWOT Diagnostic 86
12.7.4 Operational Metrics: Volume, Pricing, Cost Base, and Gross Margin 87
12.8 Eickhoff 88
12.8.1 Corporate Structure and Production Capacity Footprint 88
12.8.2 Product Portfolio and Drivetrain Capabilities 89
12.8.3 Strategic SWOT Diagnostic 90
12.8.4 Operational Metrics: Volume, Pricing, Cost Base, and Gross Margin 91
12.9 Nabtesco 92
12.9.1 Corporate Structure and Production Capacity Footprint 92
12.9.2 Product Portfolio and Drivetrain Capabilities 93
12.9.3 Strategic SWOT Diagnostic 94
12.9.4 Operational Metrics: Volume, Pricing, Cost Base, and Gross Margin 95
12.10 Hyosung Heavy Industries 96
12.10.1 Corporate Structure and Production Capacity Footprint 96
12.10.2 Product Portfolio and Drivetrain Capabilities 97
12.10.3 Strategic SWOT Diagnostic 98
12.10.4 Operational Metrics: Volume, Pricing, Cost Base, and Gross Margin 99
12.11 Elecon Engineering 100
12.11.1 Corporate Structure and Production Capacity Footprint 100
12.11.2 Product Portfolio and Drivetrain Capabilities 101
12.11.3 Strategic SWOT Diagnostic 102
12.11.4 Operational Metrics: Volume, Pricing, Cost Base, and Gross Margin 103
12.12 Delijia Transmission Technology 104
12.12.1 Corporate Structure and Production Capacity Footprint 104
12.12.2 Product Portfolio and Drivetrain Capabilities 105
12.12.3 Strategic SWOT Diagnostic 106
12.12.4 Operational Metrics: Volume, Pricing, Cost Base, and Gross Margin 107
12.13 Yinchuan Weili Transmission Technology Co. Ltd. 108
12.13.1 Corporate Structure and Production Capacity Footprint 108
12.13.2 Product Portfolio and Drivetrain Capabilities 109
12.13.3 Strategic SWOT Diagnostic 110
12.13.4 Operational Metrics: Volume, Pricing, Cost Base, and Gross Margin 111
Table 2 Global Wind Turbine Gearbox Market Value (USD Million) by Region (2021-2031) 8
Table 3 Global Wind Turbine Gearbox Sales Volume (Units) by Region (2021-2031) 9
Table 4 Global Wind Turbine Gearbox Average Selling Price (USD/Unit) by Region (2021-2031) 10
Table 5 Upstream Heavy Forgings and Special Alloy Pricing Trajectory (2021-2026) 13
Table 6 Cost Breakdown Structure of Multi-Megawatt Wind Turbine Gearboxes 15
Table 7 Global High-Speed Wind Turbine Gearbox Volume (Units) by Region (2021-2031) 18
Table 8 Global High-Speed Wind Turbine Gearbox Market Value (USD Million) by Region (2021-2031) 19
Table 9 Global Medium-Speed Wind Turbine Gearbox Volume (Units) by Region (2021-2031) 21
Table 10 Global Medium-Speed Wind Turbine Gearbox Market Value (USD Million) by Region (2021-2031) 22
Table 11 Drivetrain Architectural Metrics: Planetary Stages, Ratios, and Mass Comparisons 24
Table 12 Global Onshore Wind Turbine Gearbox Volume (Units) by Region (2021-2031) 25
Table 13 Global Onshore Wind Turbine Gearbox Market Value (USD Million) by Region (2021-2031) 26
Table 14 Global Offshore Wind Turbine Gearbox Volume (Units) by Region (2021-2031) 28
Table 15 Global Offshore Wind Turbine Gearbox Market Value (USD Million) by Region (2021-2031) 29
Table 16 Top 10 Wind Turbine Gearbox Cross-Border Trade Flows (2021-2026) 31
Table 17 North America Wind Turbine Gearbox Volume (Units) and Value (USD Million) (2021-2031) 34
Table 18 United States Wind Turbine Gearbox Market Metrics (2021-2031) 35
Table 19 Canada Wind Turbine Gearbox Market Metrics (2021-2031) 36
Table 20 Europe Wind Turbine Gearbox Volume (Units) and Value (USD Million) (2021-2031) 37
Table 21 Germany Wind Turbine Gearbox Market Metrics (2021-2031) 38
Table 22 Denmark Wind Turbine Gearbox Market Metrics (2021-2031) 39
Table 23 Spain Wind Turbine Gearbox Market Metrics (2021-2031) 40
Table 24 United Kingdom Wind Turbine Gearbox Market Metrics (2021-2031) 41
Table 25 Netherlands Wind Turbine Gearbox Market Metrics (2021-2031) 42
Table 26 Asia-Pacific Wind Turbine Gearbox Volume (Units) and Value (USD Million) (2021-2031) 43
Table 27 China Wind Turbine Gearbox Market Metrics (2021-2031) 44
Table 28 India Wind Turbine Gearbox Market Metrics (2021-2031) 45
Table 29 Japan Wind Turbine Gearbox Market Metrics (2021-2031) 46
Table 30 South Korea Wind Turbine Gearbox Market Metrics (2021-2031) 47
Table 31 Australia Wind Turbine Gearbox Market Metrics (2021-2031) 48
Table 32 Latin America Wind Turbine Gearbox Volume (Units) and Value (USD Million) (2021-2031) 49
Table 33 Brazil Wind Turbine Gearbox Market Metrics (2021-2031) 50
Table 34 Chile Wind Turbine Gearbox Market Metrics (2021-2031) 51
Table 35 Middle East & Africa Wind Turbine Gearbox Volume and Value (2021-2031) 52
Table 36 South Africa Wind Turbine Gearbox Market Metrics (2021-2031) 53
Table 37 Saudi Arabia Wind Turbine Gearbox Market Metrics (2021-2031) 54
Table 38 Global Wind Turbine Gearbox Competitive Revenue Tiering (2021-2026) 56
Table 39 Nanjing High Speed Gear Manufacturing Co. Ltd. (NGC) Wind Turbine Gearbox Sales, Price, Cost and Gross Profit Margin (2021-2026) 63
Table 40 Hangzhou Advance Gearbox Group Wind Turbine Gearbox Sales, Price, Cost and Gross Profit Margin (2021-2026) 67
Table 41 CRRC Qishuyan Wind Turbine Gearbox Sales, Price, Cost and Gross Profit Margin (2021-2026) 71
Table 42 Dalian HHI Group Wind Turbine Gearbox Sales, Price, Cost and Gross Profit Margin (2021-2026) 75
Table 43 Chongqing Gearbox Co. Ltd Wind Turbine Gearbox Sales, Price, Cost and Gross Profit Margin (2021-2026) 79
Table 44 Flender Wind Turbine Gearbox Sales, Price, Cost and Gross Profit Margin (2021-2026) 83
Table 45 ZF Friedrichshafen AG Wind Turbine Gearbox Sales, Price, Cost and Gross Profit Margin (2021-2026) 87
Table 46 Eickhoff Wind Turbine Gearbox Sales, Price, Cost and Gross Profit Margin (2021-2026) 91
Table 47 Nabtesco Wind Turbine Gearbox Sales, Price, Cost and Gross Profit Margin (2021-2026) 95
Table 48 Hyosung Heavy Industries Wind Turbine Gearbox Sales, Price, Cost and Gross Profit Margin (2021-2026) 99
Table 49 Elecon Engineering Wind Turbine Gearbox Sales, Price, Cost and Gross Profit Margin (2021-2026) 103
Table 50 Delijia Transmission Technology Wind Turbine Gearbox Sales, Price, Cost and Gross Profit Margin (2021-2026) 107
Table 51 Yinchuan Weili Transmission Technology Co. Ltd. Wind Turbine Gearbox Sales, Price, Cost and Gross Profit Margin (2021-2026) 111
Figure 1 Primary Research Validation Architecture 3
Figure 2 Global Wind Turbine Gearbox Revenue Trajectory (USD Million, 2021-2031) 7
Figure 3 Global Wind Turbine Gearbox Volume Distribution by MW Class (2021-2031) 9
Figure 4 Value Chain Architecture and Supplier Cost Realization Framework 14
Figure 5 Global Market Share Breakdown by Product Type (2021 vs. 2026 vs. 2031) 20
Figure 6 Medium-Speed Hybrid Drivetrain Penetration Rate Forecast (2021-2031) 23
Figure 7 Global Wind Turbine Gearbox Volume Split: Onshore vs. Offshore (2021-2031) 27
Figure 8 Offshore Wind Turbine Gearbox Average Megawatt Rating Expansion Curve 30
Figure 9 Geopolitical Trade Flow Routes: Global Wind Turbine Gearbox Shipments 32
Figure 10 Global Wind Turbine Gearbox Regional Value Share (2026) 55
Figure 11 Global Manufacturer Competitive Matrix by Installed Base and MW Capacity 57
Figure 12 Nanjing High Speed Gear Manufacturing Co. Ltd. (NGC) Wind Turbine Gearbox Market Share (2021-2026) 63
Figure 13 Hangzhou Advance Gearbox Group Wind Turbine Gearbox Market Share (2021-2026) 67
Figure 14 CRRC Qishuyan Wind Turbine Gearbox Market Share (2021-2026) 71
Figure 15 Dalian HHI Group Wind Turbine Gearbox Market Share (2021-2026) 75
Figure 16 Chongqing Gearbox Co. Ltd Wind Turbine Gearbox Market Share (2021-2026) 79
Figure 17 Flender Wind Turbine Gearbox Market Share (2021-2026) 83
Figure 18 ZF Friedrichshafen AG Wind Turbine Gearbox Market Share (2021-2026) 87
Figure 19 Eickhoff Wind Turbine Gearbox Market Share (2021-2026) 91
Figure 20 Nabtesco Wind Turbine Gearbox Market Share (2021-2026) 95
Figure 21 Hyosung Heavy Industries Wind Turbine Gearbox Market Share (2021-2026) 99
Figure 22 Elecon Engineering Wind Turbine Gearbox Market Share (2021-2026) 103
Figure 23 Delijia Transmission Technology Wind Turbine Gearbox Market Share (2021-2026) 107
Figure 24 Yinchuan Weili Transmission Technology Co. Ltd. Wind Turbine Gearbox Market Share (2021-2026) 111
Research Methodology
- Market Estimated Methodology:
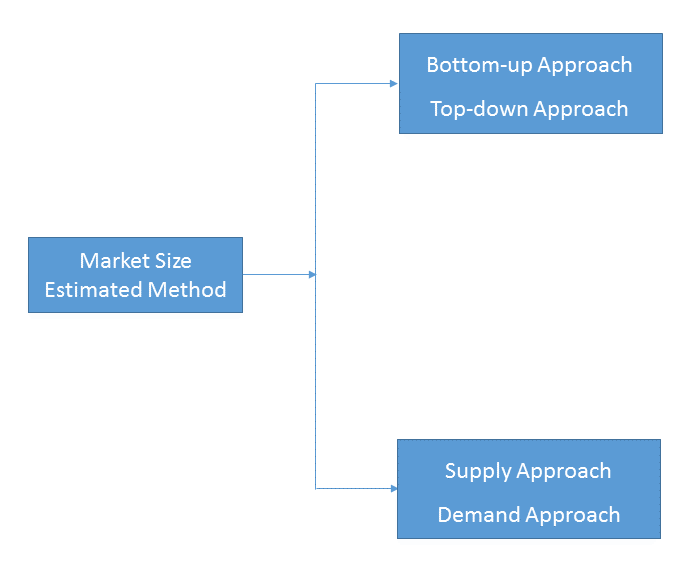
Bottom-up & top-down approach, supply & demand approach are the most important method which is used by HDIN Research to estimate the market size.
1)Top-down & Bottom-up Approach
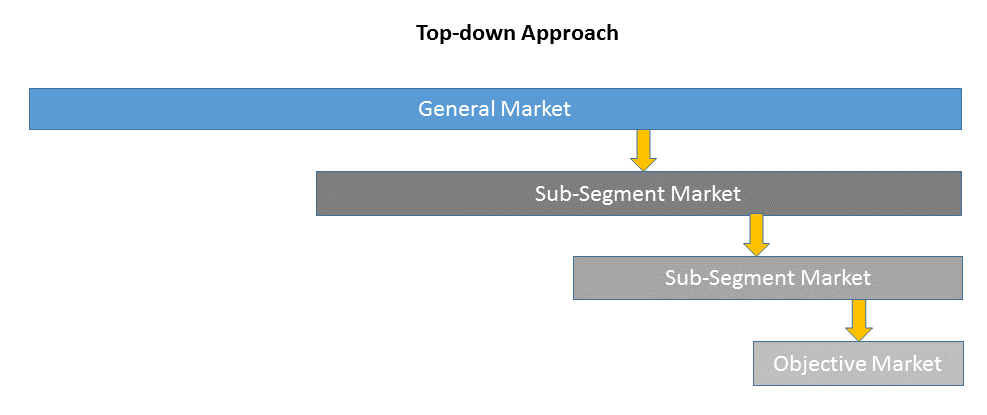
Top-down approach uses a general market size figure and determines the percentage that the objective market represents.
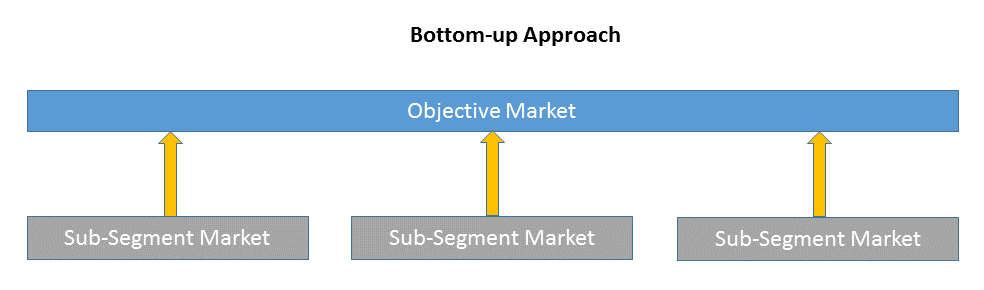
Bottom-up approach size the objective market by collecting the sub-segment information.
2)Supply & Demand Approach
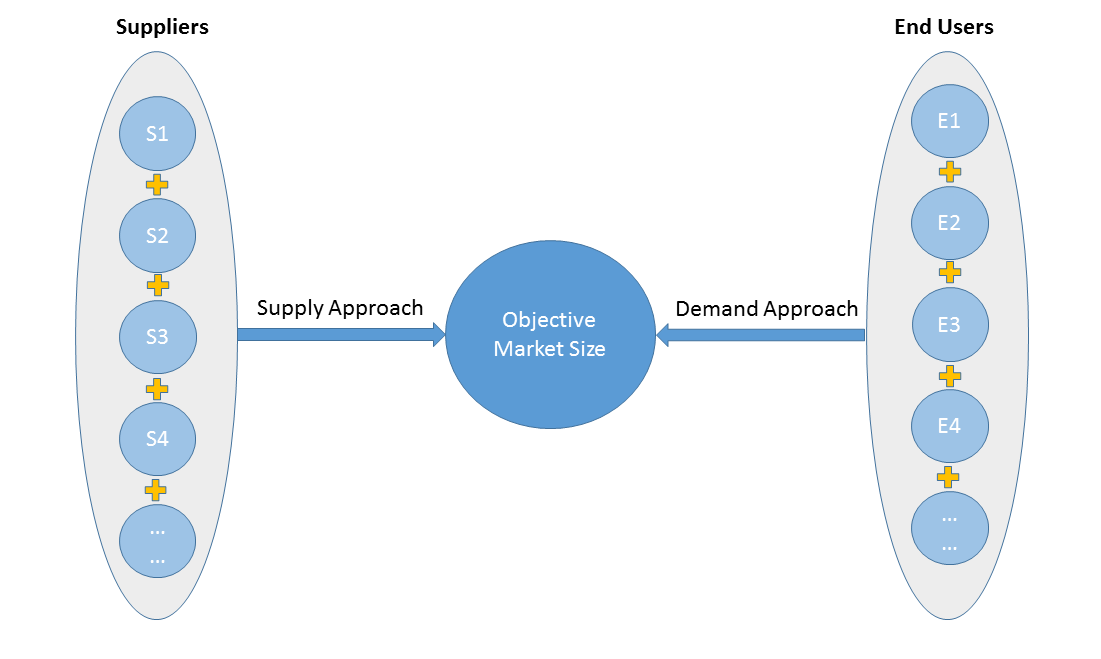
Supply approach is based on assessments of the size of each competitor supplying the objective market.
Demand approach combine end-user data within a market to estimate the objective market size. It is sometimes referred to as bottom-up approach.
- Forecasting Methodology
- Numerous factors impacting the market trend are considered for forecast model:
- New technology and application in the future;
- New project planned/under contraction;
- Global and regional underlying economic growth;
- Threatens of substitute products;
- Industry expert opinion;
- Policy and Society implication.
- Analysis Tools
1)PEST Analysis
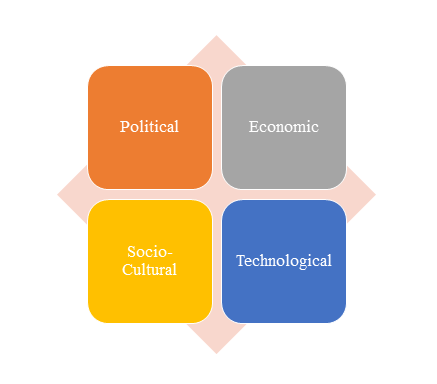
PEST Analysis is a simple and widely used tool that helps our client analyze the Political, Economic, Socio-Cultural, and Technological changes in their business environment.
- Benefits of a PEST analysis:
- It helps you to spot business opportunities, and it gives you advanced warning of significant threats.
- It reveals the direction of change within your business environment. This helps you shape what you’re doing, so that you work with change, rather than against it.
- It helps you avoid starting projects that are likely to fail, for reasons beyond your control.
- It can help you break free of unconscious assumptions when you enter a new country, region, or market; because it helps you develop an objective view of this new environment.
2)Porter’s Five Force Model Analysis
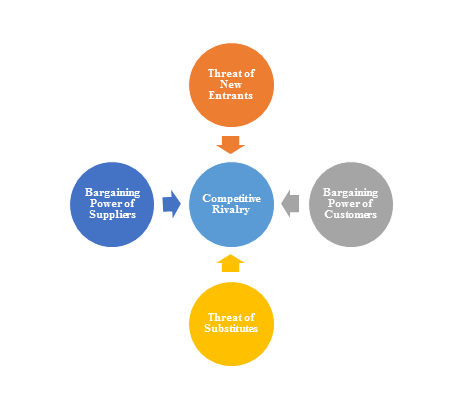
The Porter’s Five Force Model is a tool that can be used to analyze the opportunities and overall competitive advantage. The five forces that can assist in determining the competitive intensity and potential attractiveness within a specific area.
- Threat of New Entrants: Profitable industries that yield high returns will attract new firms.
- Threat of Substitutes: A substitute product uses a different technology to try to solve the same economic need.
- Bargaining Power of Customers: the ability of customers to put the firm under pressure, which also affects the customer's sensitivity to price changes.
- Bargaining Power of Suppliers: Suppliers of raw materials, components, labor, and services (such as expertise) to the firm can be a source of power over the firm when there are few substitutes.
- Competitive Rivalry: For most industries the intensity of competitive rivalry is the major determinant of the competitiveness of the industry.
3)Value Chain Analysis
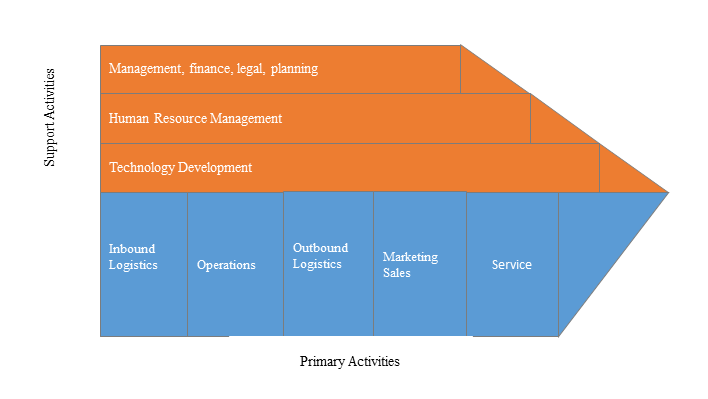
Value chain analysis is a tool to identify activities, within and around the firm and relating these activities to an assessment of competitive strength. Value chain can be analyzed by primary activities and supportive activities. Primary activities include: inbound logistics, operations, outbound logistics, marketing & sales, service. Support activities include: technology development, human resource management, management, finance, legal, planning.
4)SWOT Analysis
SWOT analysis is a tool used to evaluate a company's competitive position by identifying its strengths, weaknesses, opportunities and threats. The strengths and weakness is the inner factor; the opportunities and threats are the external factor. By analyzing the inner and external factors, the analysis can provide the detail information of the position of a player and the characteristics of the industry.
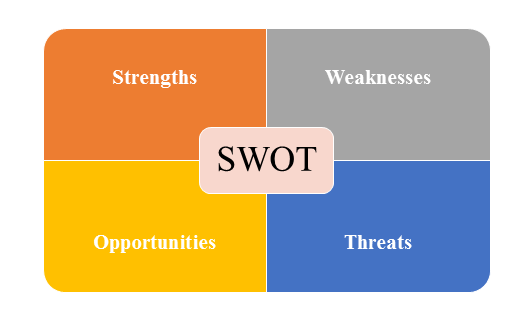
- Strengths describe what the player excels at and separates it from the competition
- Weaknesses stop the player from performing at its optimum level.
- Opportunities refer to favorable external factors that the player can use to give it a competitive advantage.
- Threats refer to factors that have the potential to harm the player.
- Data Sources
| Primary Sources | Secondary Sources |
|---|---|
| Face to face/Phone Interviews with market participants, such as: Manufactures; Distributors; End-users; Experts. Online Survey |
Government/International Organization Data: Annual Report/Presentation/Fact Book Internet Source Information Industry Association Data Free/Purchased Database Market Research Report Book/Journal/News |