Wind Turbine Blade Market Size, Moats & Supply Trends
- Single User License (1 Users) $ 3,500
- Team License (2~5 Users) $ 4,500
- Corporate License (>5 Users) $ 5,500
The global wind turbine blade market is valued between 9.1 billion USD and 10.5 billion USD in 2026 with a compound annual growth rate (CAGR) operating within 3% to 5% through 2031. This trend reflects an ongoing cyclical shift where volume growth in gigawatts is partly offset by aggressive cost-out engineering, procurement indexation, and auction price discipline. The underlying catalyst for this market transformation is the global push to compress the Levelized Cost of Energy (LCOE). Increasing rotor sweep areas capture higher energy yields at low-to-medium wind speeds, pushing onshore blade lengths beyond 100 to 120 meters and offshore platforms past 115 to 147 meters. This scaling necessitates rapid departures from legacy epoxy-glass layups toward low-density carbon spar caps, polyurethane matrices, and circular resin systems capable of satisfying increasingly stringent non-price auction criteria.
Wind turbine blade market control is bifurcated between captive in-house manufacturing divisions of vertically integrated wind turbine original equipment manufacturers (OEMs) such as Sany Renewable Energy, Goldwind, and Suzlon Energy, and specialized independent merchant producers. The independent merchant landscape is dominated by Chinese Tier-1 suppliers, notably Sinoma Science & Technology and Zhuzhou Times New Material Technology (CRRC TMT), which together control a decisive share of merchant production volume, while Western merchant manufacturers like TPI Composites face severe margin compression and operational reorganizations. Deployment growth centers heavily in the Asia-Pacific region, spearheaded by China's multi-gigawatt desert bases and expanding offshore corridors, alongside aggressive capacity additions in India. North America and Europe remain pivotal high-value markets focused on repowering mature onshore fleets and building out deep-water offshore installations, though both regions face intensifying regulatory scrutiny, domestic content mandates, and trade-related border adjustments.
REGIONAL MARKET DYNAMICS & REGULATORY FRAMEWORKS
● Asia-Pacific (APAC)
Asia-Pacific operates as the primary volume anchor of global blade production and installation, capturing over 75% of worldwide manufacturing throughput. China's domestic landscape is characterized by ultra-large onshore energy megabases across the Gobi and northern desert regions, requiring blade designs capable of sustaining high aerodynamic turbulence, wide thermal swings, and severe dust-abrasion profiles. Commercial onshore blade lengths have standardized between 108 meters and 128 meters for 7.X MW to 10.X MW workhorse units. Following policy shifts against extreme domestic price competition, tender metrics increasingly penalize poor lifecycle durability, elevating high-aspect-ratio, aeroelastically tailored blades.
In India, national capacity additions have accelerated following the Approved List of Models and Manufacturers (ALMM) implementation and the waiver of Inter-State Transmission System (ISTS) charges through mid-2028. The Indian market favors low-wind-speed aerodynamic profiles, with rotor diameters expanding to 160-175 meters on 3 MW to 5 MW drivetrains. Local manufacturing mandates have compelled multinational and domestic turbine OEMs to expand dedicated production bases across Tamil Nadu, Gujarat, and Rajasthan.
Across the wider region, offshore programs in Taiwan, China, Japan, and South Korea demand localized composite manufacturing corridors or dedicated portside supply chains to mitigate trans-oceanic shipping constraints. Chinese independent blade producers have countered rising geopolitical friction by executing outbound foreign direct investment, establishing merchant facilities across Southeast Asia to secure uninterrupted access to third-party export markets.
● Europe
The European theatre is characterized by a strategic divergence between aggressive net-zero commitments and the structural cost inflation affecting regional manufacturing bases. Under the Net Zero Industry Act (NZIA) and the European Wind Power Action Plan, auction mechanics across Germany, the United Kingdom, and the Nordics are shifting away from pure price metrics to incorporate non-price criteria. These criteria focus on carbon footprint tracking, supply chain cybersecurity, and composite end-of-life circularity.
Market volume in Europe is shaped by two distinct operational vectors: the repowering of legacy onshore sites with 5.X MW to 7.X MW platforms using 75-meter to 85-meter blades, and the aggressive scaling of North Sea offshore wind farms deploying 14 MW to 15 MW+ platforms with blade lengths exceeding 115 meters. Operating margins for local European blade manufacturing complexes remain under pressure due to elevated power costs and strict environmental chemical compliance regimes (e.g., REACH constraints on specific hardeners and raw inputs). Consequently, European turbine OEMs rely on hybrid procurement frameworks, combining local specialized manufacturing with merchant import volumes from lower-cost production hubs in Türkiye and North Africa.
● North America
The North American market, dominated by the United States, is shaped by policy incentives and stringent trade barriers. The Advanced Manufacturing Production Credit (Section 45X) under the Inflation Reduction Act initially stimulated domestic component supply chains by offering direct operating tax subsidies for domestically produced wind blades. However, regulatory adjustments and phased sunsets enacted through broader legislative reconciliation packages, such as the One Big Beautiful Bill Act, have created project timeline friction, requiring accelerated commissioning schedules to preserve project-level Production Tax Credits.
Concurrently, intensified supply chain enforcement by U.S. Customs and Border Protection under the Uyghur Forced Labor Prevention Act (UFLPA) has disrupted cross-border material flows. Mexican composite manufacturing hubs, historically serving as low-cost nearshore production centers for U.S. wind installations, have experienced delivery delays and heightened traceability burdens on precursor materials, including glass fabrics, epoxy resin precursors, and carbon tow. These disruptions have accelerated strategic reconsiderations among turbine OEMs regarding in-house capacity allocation within domestic borders versus third-party reliance.
● South America
South American dynamics are anchored almost entirely by Brazil, with secondary demand emerging from Chile and Colombia. The regional market has faced macroeconomic headwinds, characterized by local power oversupply, elevated project financing interest rates, and grid curtailment challenges that temporarily dampened onshore turbine tenders.
Despite short-term order cyclicality, the region retains competitive merchant composite manufacturing capacity. Dedicated export-oriented blade manufacturing facilities located around port-adjacent hubs, such as Pecem in Ceara, leverage favorable labor economics and renewable grid profiles to export composite blades to the wider Americas. Structurally, onshore development in Brazil favors large-rotor, medium-generator capacity platforms to maximize capacity factors in high-shear, steady trade-wind environments.
● Middle East & Africa (MEA)
The MEA region is scaling utility-scale wind deployment to support domestic industrial decarbonization, economic diversification, and green hydrogen and ammonia production clusters. Saudi Arabia, Egypt, South Africa, and Turkiye represent the primary installation centers.
Environmental conditions in this geography impose severe engineering constraints on composite blades: high ultraviolet radiation, extreme diurnal thermal cycles, and abrasive airborne particulate matter. These conditions accelerate surface erosion on aerodynamic profiles, compelling operators to specify polyurethane-based protective coatings, reinforced leading-edge shell assemblies, and specialized anti-sand erosion coatings. Turkiye maintains a strategic role as an established nearshore composite manufacturing bridgehead supplying European project sites.
SUPPLY CHAIN & VALUE CHAIN ARCHITECTURE
● Upstream Feedstock Squeeze & Resin Matrix Economics
Raw material procurement commands 65% to 75% of the total manufacturing cost structure of a modern utility-scale wind turbine blade. The primary material matrix is dominated by thermosetting liquid epoxy resins, which retain an 80% to 85% global volume share, combined with amine hardeners. Epoxy dominance stems from its predictable vacuum infusion rheology, low cure shrinkage, superior fiber wet-out properties, and mature qualification history across global turbine OEMs.
However, alternative chemistries are capturing market share. Polyurethane (PU) resin infusion systems are gaining adoption in high-volume serial production lines. PU systems demonstrate lower resin viscosity, facilitating accelerated mold infusion cycles, lower thermal curing thresholds, and superior dynamic inter-laminar shear strength compared to conventional bisphenol-A epoxy configurations.
Simultaneously, the supply chain for structural reinforcement fibers is realigning around raw material modulus requirements:
- Standard E-Glass fabrics are increasingly restricted to root buildups, inner shell laminates, and sub-80-meter blades.
- High-modulus and ultra-high-modulus glass fibers (yielding tensile modulus metrics exceeding 90 GPa) have emerged as the workhorse material for 85-meter to 105-meter onshore platforms, delaying the necessary transition to more expensive carbon fiber systems.
- Pultruded carbon fiber plates represent the primary structural reinforcement for blades crossing the 100-meter to 110-meter boundary.
Structural Cores: The Balsa-to-PET Transition
A structural material shift is occurring within the shear web and aerodynamic sandwich shell assemblies. Historically, end-grain balsa wood sourced from Ecuador served as the primary core material due to its compressive strength and shear modulus. However, historical pricing volatility, climate disruptions, and forestry verification requirements have accelerated substitution toward synthetic structural foams.
Polyethylene Terephthalate (PET) foams have captured dominant market share over legacy balsa and cross-linked Polyvinyl Chloride (PVC) cores. PET core materials provide consistent thermo-mechanical stability, lower resin uptake during vacuum-assisted transfer molding, and superior thermoformability. Crucially, the adoption of PET foam aligns with circularity mandates, as recycled PET bottle flakes serve as a direct upstream feedstock, reducing the carbon footprint of the internal core sandwich structure.
● Midstream Tooling, Cycle Time & Pultrusion Economics
Midstream blade fabrication remains governed by Vacuum-Assisted Resin Transfer Molding (VARTM). In ultra-large blade manufacturing (100m+), the primary operational bottleneck is mold turnaround time. Capital equipment expenditures for a single metallic or composite master mold system—featuring automated hydraulic closure systems, integrated zoned heating elements, and root-alignment carriages—routinely exceed multiple millions of dollars. Consequently, optimizing cycle times is the principal driver of shop-floor unit economics.
To accelerate throughput, manufacturers have widely decoupled the fabrication of the main load-bearing spar caps from the main blade mold via carbon pultrusion technology. In this operational architecture, continuous high-strength carbon fiber tow is impregnated with resin, pulled through heated precision dies, and cured into rigid, highly aligned composite slats at specialized off-line manufacturing cells. These pultruded slats are subsequently kitted, transported to the primary blade line, and stacked into the spar cap mold cavity. This eliminates the risk of fiber wrinkling, dry spots, and localized exothermic peaks associated with thick, in-situ dry fabric resin infusions, reducing master mold residency time while boosting structural consistency.
● Downstream Logistics, Non-Destructive Testing & Circularity
Downstream value retention is increasingly dictated by logistics feasibility, automated quality assurance, and end-of-life circularity economics. As commercial onshore blades surpass 100 meters, inland ground transportation reaches physical limits. Transporting monolithic blades through mountainous terrain, tight urban turns, and rail corridors requires multi-axle steerable trailers and specialized blade lifters capable of tilting the composite structure upward during transit. To circumvent these bottlenecks, OEMs are accelerating R&D into modular, two-piece bolted or jointed blade designs.
Quality assurance has transitioned toward non-destructive testing (NDT) integration. Leading manufacturers deploy automated phased-array ultrasonic testing (PAUT), shearography, and aerial drone thermography to inspect thick laminate bonds, root stud integrations, and adhesive trailing-edge joints. AI-driven vision systems monitor dry fiber layup and resin infusion progression in real time, catching internal structural misalignments prior to thermal curing.
At end-of-life, landfill bans across several European jurisdictions and escalating non-price auction metrics have catalyzed the commercialization of chemical circularity. The historical consensus that cross-linked epoxy thermosets cannot be recycled has been upended by solvolysis chemical recycling breakthroughs. These chemical recycling processes depolymerize cured epoxy resins under mild temperatures and pressures, enabling the recovery of virgin-quality epoxy monomers and undamaged glass or carbon fibers for re-entry into high-value composite supply chains.
OPERATING MODEL TYPOLOGIES & COMPETITIVE DOSSIERS
The wind turbine blade sector operates under three primary business models:
1. The Independent Model: Pure-play merchant composite producers operating multi-facility global networks that supply blades under dedicated multi-year contracts or open-market purchasing arrangements to non-integrated or selectively outsourced OEMs. Independent Model Specialists: Sinoma Science & Technology (Sinoma Blade), Zhuzhou Times New Material Technology (CRRC TMT), TPI Composites, Aeolon Technology, Lianyungang Zhongfu Lianzhong Composite Material Group, Aeris Energy, Titan Wind Energy, Chongqing Machinery & Electric (Chongqing Chengfei New Material / CQME), Human Composites.
2. The In-House Model: Fully integrated turbine OEMs maintaining captive internal design, engineering, and manufacturing plants, ensuring absolute control over aerodynamic intellectual property and direct synchronization with nacelle production schedules. In-House Model Leaders: Sany Renewable Energy, Suzlon Energy.
3. The Hybrid Model: Diversified turbine OEMs that retain strategic captive blade production for proprietary platforms while outsourcing baseline volume or regional peak demand to independent merchant producers. Hybrid Model OEMs: Vestas Wind Systems, GE Vernova (including LM Wind Power), Siemens Gamesa (Siemens Energy), Nordex Group, ENERCON Global GmbH, Mingyang Smart Energy, Dongfang Electric Wind Power (DEC).
OPPORTUNITIES, CONTRARIAN TRUTHS & OPERATIONAL RISKS
● Contrarian Industry Realities
The prevailing consensus that the Levelized Cost of Energy (LCOE) will continually fall through unconstrained turbine scaling faces severe physical and structural limits. Internal modeling suggests the industry has entered a zone of diminishing structural returns. While single-turbine nameplate capacities scaling past 10 MW onshore and 18 MW offshore deliver marginal aerodynamic yield improvements, these gains are increasingly offset by non-linear composite mass penalties.
Because blade mass scales volumetrically (cubed relative to length) while aerodynamic power capture scales on an area basis (squared relative to length), uncontrolled blade mass introduces dynamic fatigue loads that strain main bearings, pitch bearings, and yaw systems. Unless structural mass is suppressed through costlier raw materials—such as high-modulus pultruded carbon fiber—the required capital expenditure across drivetrains cancels out the LCOE benefits of extended rotor spans.
Furthermore, field intelligence indicates that historical cost-reduction modeling relied too heavily on aggressive resin infusion cycle times at the expense of defect mitigation. The rapid expansion of blade dimensions without proportional advancements in real-time non-destructive testing (NDT) has manifested in elevated fleet-wide warranty claims and structural remediation campaigns across major turbine platforms. As a result, Tier-1 operators are shifting commercial evaluations away from upfront capital cost per kilowatt toward total lifecycle availability, prioritizing blade structural margins, root connection integrity, and leading-edge durability.
● Commercial Growth Corridors
Repowering Arbitrage: The repowering segment across Europe and North America represents an expanding commercial growth corridor. Early multi-megawatt installations commissioned in the early 2000s occupy Tier-1 wind resource geography with high capacity factors and existing grid interconnects. Replacing aged 1.5 MW to 2.0 MW units (utilizing 35-meter to 45-meter blades) with modern 5.X MW to 6.X MW platforms equipped with 75-meter to 85-meter blades doubles or triples project yield without expanding land rights. This repowering wave generates consistent demand for mid-range, aerodynamically dense blades suited for legacy tower clearance constraints.
Offshore Deep-Water and Floating Architectures: The commercialization of floating offshore foundations opens high-wind, deep-water concessions across the Mediterranean, the Atlantic shelf, and East Asia. Floating dynamics introduce multi-axis wave-induced pitch and roll moments that interact directly with rotor aeroelasticity. Blade architectures engineered specifically for floating foundations—featuring lighter carbon-pultruded spars, pre-bent tips, and adaptive pitch aeroelastic tailoring—command premium Average Selling Prices (ASPs) and higher gross margins compared to commoditized onshore blades.
System Co-Optimization (FDRE and Power-to-X): In regions like India and the Middle East, commercial tenders have migrated toward Firm and Dispatchable Renewable Energy (FDRE) and hybrid Round-the-Clock (RTC) configurations. These structures integrate wind, solar photovoltaic, and battery storage (BESS) or green hydrogen electrolyzers. Because wind profiles provide complementary generation during solar drop-off, turbine platforms engineered with extreme rotor-to-generator capacity ratios (deploying large-diameter blades on relatively modest generators) maximize off-peak capacity factors. This design paradigm stabilizes baseload inputs for electrolyzers and power purchase off-takers.
● Structural Moats & Operational Headwinds
Raw Material Feedstock Volatility: Operating margins remain exposed to price spikes and availability constraints across upstream chemicals. Liquid epoxy resins and amine curing agents track volatile petrochemical refining margins. The persistent supply volatility of FSC-certified balsa wood from South America has forced rapid requalification of synthetic PET foam cores. Similarly, high-purity carbon fiber tow faces competing aerospace and industrial demand pools. Blade manufacturers lacking backward vertical integration or indexed raw material pass-through contractual mechanisms face significant gross margin compression during commodity inflation shocks.
Geopolitical Protectionism and Sourcing Friction: The rapid escalation of localized content rules and non-tariff trade barriers threatens globally centralized manufacturing footprints. Import detentions under U.S. UFLPA enforcement, European Net Zero Industry Act resilience benchmarks, and Indian ALMM mandates require manufacturers to establish geographically redundant, auditable production nodes. Operating fragmented, multi-region manufacturing sites dilutes volume economies of scale and increases tooling capital expenditures, as duplicate master molds must be placed across multiple regional hubs to serve localized markets.
Inland Transportation Bottlenecks: Onshore blade lengths crossing 100 meters have exhausted standard highway logistics envelopes. Moving monolithic composite blades through populated or mountainous regions necessitates complex civil engineering adjustments, route permits, and specialized heavy-haul tractor-trailer platforms, which severely inflates logistics balance sheets. While modular, two-piece blade joining mechanisms offer a mechanical solution, they introduce weight penalties, root-joint stress concentrations, and field-assembly failure points. The industrialization of robust, fatigue-resistant modular joints remains an unresolved engineering bottleneck that will separate long-term market winners from commoditized producers.
Quality Execution in Scaling: The rapid cadence of blade platform iterations has compressed the duration between digital finite-element modeling, prototyping, and full-scale serial production. This compressed development cycle elevates operational vulnerability to manufacturing anomalies—such as ply wrinkling, localized resin starvation, dry fiber patches, and secondary bonding failures along adhesive trailing edges. As insurance underwriters and project financiers tighten technical due diligence requirements, merchant and captive blade producers must invest heavily in automated non-destructive evaluation, digital factory architectures, and closed-loop process control to preserve market credibility and balance-sheet stability.
1.1 Study Framework and Scope 1
1.2 Research Design and Multi-Tier Verification Logic 2
1.3 Primary Data Sources and Industry Delphi Panels 3
1.4 Secondary Intelligence and Statistical Baselines 4
1.5 Bottom-Up and Top-Down Market Sizing Algorithms 5
1.6 Standard Nomenclature and Acronyms 6
Chapter 2 Executive Summary: Global Wind Turbine Blade Market Landscape 7
2.1 Market Volume and Value Trajectory (2021-2031) 7
2.2 Core Techno-Economic Inflection Points and Levelized Cost of Energy (LCOE) Impacts 8
2.3 Value Migration Across Blade Architecture and Materials 9
2.4 Strategic Structural Matrix: In-House Manufacturing vs. Merchant Outsourcing 10
2.5 Global Geographic Allocation of Blade Manufacturing Capacity 11
Chapter 3 Global Wind Turbine Blade Market Dynamics and Macro Fundamentals 12
3.1 Grid Decarbonization Targets and Macro Renewable Energy Mandates 12
3.2 Turbine Scaling Dynamics: Tip-Speed Ratios, Rotor Diameters, and Aeroelastic Challenges 13
3.3 Raw Material Price Volatility and Inflation Pass-Through Elasticity 14
3.4 Supply Chain Vulnerabilities: Specialized Tooling, Mold Availability, and Logistics Bottlenecks 15
3.5 Offshore Expansion Hurdles: Port Infrastructure, Crane Capacity, and Installation Vessels 16
3.6 Circularity and End-of-Life Regulations: Blade Decommissioning and Pyrolysis Adoption 17
Chapter 4 Global Supply Chain, Upstream Raw Materials, and Manufacturing Architecture 18
4.1 Wind Turbine Blade Value Chain Architecture 18
4.2 Reinforcement Fibers: E-Glass, High-Modulus Glass, and Heavy-Tow Carbon Fiber 19
4.3 Matrix Resins: Standard Epoxy Formulations, Polyurethane, and Recyclable Thermoplastics 20
4.4 Core Materials: Structural Balsa Wood, Polyethylene Terephthalate (PET), and Polyvinyl Chloride (PVC) 21
4.5 Structural Adhesives and Bonding Pastes: Polyurethane vs. Vinyl Ester Systems 22
4.6 Advanced Manufacturing Technologies: Vacuum-Assisted Resin Transfer Molding (VARTM) and Automated Spar Cap Pultrusion 23
4.7 Cost Breakdown Structure: Tooling, Direct Materials, Cycle Time, and Labor Economics 24
Chapter 5 Global Wind Turbine Blade Market by Material Reinforcement 25
5.1 Reinforcement Segment Overview and Material Substitution Trends 25
5.2 Glass Fiber Reinforced Polymer (GFRP) Blades 26
5.2.1 Market Volume (Units/Sets) and Value (USD Million) Baseline (2021-2026) 26
5.2.2 Segment Forecast and Commercial Viability (2027-2031) 27
5.3 Carbon Fiber & Carbon-Glass Hybrid Blades 28
5.3.1 Market Volume (Units/Sets) and Value (USD Million) Baseline (2021-2026) 28
5.3.2 Pultruded Carbon Spar Cap Penetration and Forecast (2027-2031) 29
5.4 Material Density, Fatigue Performance, and Cost-Per-Kilogram Comparative Analysis 30
5.5 Pricing Trajectory and Margin Contribution by Material System 31
Chapter 6 Global Wind Turbine Blade Market by Matrix Resin System 32
6.1 Matrix Resin Systems Overview and Kinetic Curing Profiles 32
6.2 Thermosetting Epoxy Resin Blades 33
6.2.1 Historic Volume and Value Performance (2021-2026) 33
6.2.2 Forecast Dynamics and Toughening Agent Innovations (2027-2031) 34
6.3 Polyurethane & Thermoplastic Resin Blades 35
6.3.1 Historic Volume and Value Performance (2021-2026) 35
6.3.2 Cycle Time Compression, Recyclability Factors, and Growth Forecast (2027-2031) 36
6.4 Relative Chemical Resistance, Exotherm Control, and Mold Cycle Economics 37
Chapter 7 Global Wind Turbine Blade Market by Business Operating Model 38
7.1 Vertical Integration vs. Merchant Procurement Architecture 38
7.2 In-House (OEM Captive) Model 39
7.2.1 Captive Production Volume and Capital Expenditure Requirements (2021-2026) 39
7.2.2 Strategic OEM Captive Capacity Outlook (2027-2031) 40
7.3 Independent Merchant Blade Manufacturer Model 41
7.3.1 Commercial Contract Structures and Global Capacity Output (2021-2026) 41
7.3.2 Co-Development Alliances and Multi-Client Delivery Forecast (2027-2031) 42
7.4 Hybrid Operating Model (Captive Base-Load with Merchant Peaking Strategy) 43
Chapter 8 Global Wind Turbine Blade Market by Application Environment 44
8.1 Operational Environment Segmentation Dynamics 44
8.2 Onshore Wind Turbine Blades 45
8.2.1 Nameplate Ratings, Segment Volume, and Value (2021-2026) 45
8.2.2 Land Transportation Constraints, Segmented Blades, and Forecast (2027-2031) 46
8.3 Offshore Wind Turbine Blades 47
8.3.1 Mega-Scale Blade Geometries (>100 Meters), Volume, and Value (2021-2026) 47
8.3.2 Deepwater Substructures, Harsh Marine Environmental Durability, and Forecast (2027-2031) 48
8.4 Leading-Edge Erosion (LEE) Protection and Anti-Icing Thermal Solutions 49
8.5 Levelized Blade Capital Cost per Megawatt (CAPEX/MW) Comparison 50
Chapter 9 Regional Production Dynamics, Consumption Hubs, and International Trade Flows 51
9.1 Macro Geographic Overview: Global Sourcing and Deployment Disconnect 51
9.2 Asia-Pacific 52
9.2.1 Regional Production Capacities and Regional Demand Dynamics 52
9.2.2 China: Manufacturing Hegemony, Ultra-Long Blade R&D, and Domestic Sourcing 53
9.2.3 India: Wind Turbine Export Hub Strategy and Domestic Local Content Ratios 54
9.3 Europe 55
9.3.1 Production Footprint Modernization and North Sea Offshore Deployment 55
9.3.2 Germany: Precision Engineering, Automation, and Replacement Repowering Market 56
9.3.3 Spain: Consolidation of Blade Tooling Facilities and Export Capabilities 57
9.3.4 Denmark: Offshore Design Centers, Prototyping, and Intellectual Property Clusters 58
9.3.5 United Kingdom: Offshore Expansion Demands and Port-Centric Assembly Dependencies 59
9.3.6 Rest of Europe Market 60
9.4 North America 61
9.4.1 United States 61
9.4.2 Canada 62
9.5 Latin America & MEA 63
9.5.1 Brazil 63
9.5.2 Türkiye 64
Chapter 10 Competitive Landscape and Market Share Analysis 65
10.1 Global Market Concentration Assessment (CR4, CR8, and Herfindahl-Hirschman Index) 65
10.2 OEM Captive Blade Production vs. Independent Merchant Supplier Revenue Mapping 66
10.3 Competitive Tiering: Mega-Mold Investments and Manufacturing Footprint Flexibility 67
10.4 Strategic Mergers, Acquisitions, Joint Ventures, and Exclusive Offtake Pacts 68
10.5 Patent Landscape: Structural Aerodynamics, Multi-Piece Blade Joints, and Bio-Resins 69
10.6 Global Corporate Production Capacity Ranking (MW and Blade Set Metrics) 70
Chapter 11 Company Profiles and Performance Metrics 72
11.1 TPI Composites 72
11.1.1 Corporate Profile and Global Manufacturing Operational Hubs 72
11.1.2 Product Portfolio and Blade Technical Specifications 73
11.1.3 Strategic SWOT Matrix 73
11.1.4 Commercial Execution, R&D Allocations, and Key OEM Offtake Agreements 74
11.1.5 Wind Turbine Blade Operational Metrics (Sales, Price, Cost, Gross Margin, Market Share: 2021-2026) 75
11.2 Sinoma Science & Technology 76
11.2.1 Corporate Profile and Production Footprint 76
11.2.2 Product Portfolio and Ultra-Long Blade Engineering 77
11.2.3 Strategic SWOT Matrix 77
11.2.4 Vertical Integration with Upstream Glass Fiber Assets 78
11.2.5 Wind Turbine Blade Operational Metrics (Sales, Price, Cost, Gross Margin, Market Share: 2021-2026) 79
11.3 Zhuzhou Times New Material Technology (CRRC TMT) 80
11.3.1 Corporate Profile and Polymer Processing Lineage 80
11.3.2 Product Portfolio and High-Capacity Offshore Blading Solutions 81
11.3.3 Strategic SWOT Matrix 81
11.3.4 Production Scaling and Rail-Wind Technology Synergies 82
11.3.5 Wind Turbine Blade Operational Metrics (Sales, Price, Cost, Gross Margin, Market Share: 2021-2026) 83
11.4 Chongqing Machinery & Electric 84
11.4.1 Corporate Profile and Industrial Infrastructure 84
11.4.2 Product Portfolio and Specialized Blade Segment Operations 85
11.4.3 Strategic SWOT Matrix 85
11.4.4 Regional Manufacturing Integration and Downstream Partnerships 86
11.4.5 Wind Turbine Blade Operational Metrics (Sales, Price, Cost, Gross Margin, Market Share: 2021-2026) 87
11.5 Aeolon Technology 88
11.5.1 Corporate Profile and Global Production Facility Network 88
11.5.2 Product Portfolio, Offshore Blade Production, and Tooling Capacities 89
11.5.3 Strategic SWOT Matrix 89
11.5.4 International Factory Relocation and Export-Oriented Manufacturing 90
11.5.5 Wind Turbine Blade Operational Metrics (Sales, Price, Cost, Gross Margin, Market Share: 2021-2026) 91
11.6 Aeris Energy 92
11.6.1 Corporate Profile and Brazilian Production Core 92
11.6.2 Product Portfolio and Multi-OEM Assembly Operations 93
11.6.3 Strategic SWOT Matrix 93
11.6.4 Latin American Regional Logistics Strategy and Port Synergies 94
11.6.5 Wind Turbine Blade Operational Metrics (Sales, Price, Cost, Gross Margin, Market Share: 2021-2026) 95
11.7 Lianyungang Zhongfu Lianzhong Composite Material Group 96
11.7.1 Corporate Profile and CNBM Structural Affiliation 96
11.7.2 Product Portfolio and Mega-Watt Class Rotor Blades 97
11.7.3 Strategic SWOT Matrix 97
11.7.4 Advanced Testing Infrastructure and Carbon Fiber Pultrusion Implementation 98
11.7.5 Wind Turbine Blade Operational Metrics (Sales, Price, Cost, Gross Margin, Market Share: 2021-2026) 99
11.8 Human Composites 100
11.8.1 Corporate Profile and Advanced Materials Positioning 100
11.8.2 Product Portfolio and Bespoke Blade Solutions 101
11.8.3 Strategic SWOT Matrix 101
11.8.4 Structural Optimization and European Merchant Strategy 102
11.8.5 Wind Turbine Blade Operational Metrics (Sales, Price, Cost, Gross Margin, Market Share: 2021-2026) 103
11.9 Mingyang Smart Energy 104
11.9.1 Corporate Profile and Vertically Integrated Turbine Architecture 104
11.9.2 Product Portfolio: Typhoon-Resistant and Offshore Giant Blades 105
11.9.3 Strategic SWOT Matrix 105
11.9.4 Carbon-Glass Hybrid Spar Cap Integration and In-House Supply Chains 106
11.9.5 Wind Turbine Blade Operational Metrics (Sales, Price, Cost, Gross Margin, Market Share: 2021-2026) 107
11.10 Sany Renewable Energy 108
11.10.1 Corporate Profile and Smart Manufacturing Ecosystem 108
11.10.2 Product Portfolio and High-Performance Aerodynamic Blades 109
11.10.3 Strategic SWOT Matrix 109
11.10.4 Intelligent Blade Molding, Digital Twins, and Cost Reduction Mechanisms 110
11.10.5 Wind Turbine Blade Operational Metrics (Sales, Price, Cost, Gross Margin, Market Share: 2021-2026) 111
11.11 Dongfang Electric Wind Power 112
11.11.1 Corporate Profile and State-Owned Heavy Industrial Foundation 112
11.11.2 Product Portfolio and Deep-Sea Offshore Blade Specifications 113
11.11.3 Strategic SWOT Matrix 113
11.11.4 In-House Rotor Prototyping and Next-Generation Validation Facilities 114
11.11.5 Wind Turbine Blade Operational Metrics (Sales, Price, Cost, Gross Margin, Market Share: 2021-2026) 115
11.12 Vestas 116
11.12.1 Corporate Profile and Global Original Equipment Manufacturing Leadership 116
11.12.2 Product Portfolio and EnVentus Platform Blade Architecture 117
11.12.3 Strategic SWOT Matrix 117
11.12.4 Dual Sourcing Strategy, Captive Plants, and Circular Blade Chemistry 118
11.12.5 Wind Turbine Blade Operational Metrics (Sales, Price, Cost, Gross Margin, Market Share: 2021-2026) 119
11.13 Siemens Gamesa 120
11.13.1 Corporate Profile and Marine Offshore Wind Dominance 120
11.13.2 Product Portfolio: IntegralBlade Castings and RecyclableBlade Lines 121
11.13.3 Strategic SWOT Matrix 121
11.13.4 Quality Control Normalization, Mold Technology, and Factory Realignments 122
11.13.5 Wind Turbine Blade Operational Metrics (Sales, Price, Cost, Gross Margin, Market Share: 2021-2026) 123
11.14 GE Vernova 124
11.14.1 Corporate Profile and Energy Transition Enterprise Spin-Off 124
11.14.2 Product Portfolio: Haliade-X Series and Onshore Workhorse Profiles 125
11.14.3 Strategic SWOT Matrix 125
11.14.4 LM Wind Power Asset Synergies and Modular Blade Engineering 126
11.14.5 Wind Turbine Blade Operational Metrics (Sales, Price, Cost, Gross Margin, Market Share: 2021-2026) 127
11.15 Nordex 128
11.15.1 Corporate Profile and Core Turbine Platform Strategy 128
11.15.2 Product Portfolio and Cold Climate Blading Innovations 128
11.15.3 Strategic SWOT Matrix 129
11.15.4 Merchant Sourcing Collaboration and In-House Production Rebalancing 129
11.15.5 Wind Turbine Blade Operational Metrics (Sales, Price, Cost, Gross Margin, Market Share: 2021-2026) 130
11.16 ENERCON Global GmbH 131
11.16.1 Corporate Profile and Direct-Drive Powertrain Systems 131
11.16.2 Product Portfolio, Unique Blade Geometry, and Trailing-Edge Winglets 131
11.16.3 Strategic SWOT Matrix 132
11.16.4 Global Production Realignment and Merchant Procurement Partnerships 132
11.16.5 Wind Turbine Blade Operational Metrics (Sales, Price, Cost, Gross Margin, Market Share: 2021-2026) 133
11.17 Suzlon Energy 134
11.17.1 Corporate Profile and Indian Subcontinent Installation Footprint 134
11.17.2 Product Portfolio and Low Wind-Speed Regime Blades 134
11.17.3 Strategic SWOT Matrix 134
11.17.4 Localized Supply Chain Density and Vertically Integrated Blade Facilities 135
11.17.5 Wind Turbine Blade Operational Metrics (Sales, Price, Cost, Gross Margin, Market Share: 2021-2026) 135
11.18 Titan Wind Energy 136
11.18.1 Corporate Profile and Heavy Wind Structural Component Diversification 136
11.18.2 Product Portfolio and High-Capacity Onshore/Offshore Blade Offerings 136
11.18.3 Strategic SWOT Matrix 136
11.18.4 Domestic and International Production Scaling and Strategic Capex 137
11.18.5 Wind Turbine Blade Operational Metrics (Sales, Price, Cost, Gross Margin, Market Share: 2021-2026) 137
Table 2 Key Macroeconomic and Industry Modeling Parameters 5
Table 3 Global Wind Turbine Blade Market Volume (Blade Sets) and Market Value (USD Million) Baseline and Forecasts (2021-2031) 7
Table 4 Global Wind Turbine Blade Average Unit Prices by Blade Length Tier (2021-2031) 8
Table 5 Upstream Reinforcement Fiber Material Comparison: Tensile Modulus, Density, and Price Index 19
Table 6 Epoxy vs. Polyurethane Resin System Matrix: Exotherm Temperature, Gel Time, and Tensile Strength 20
Table 7 Structural Core Materials Performance Comparison: PET Foam, PVC Foam, and Balsa Wood 21
Table 8 Wind Turbine Blade Manufacturing Cost Breakdown by Cost Component (2021-2026) 24
Table 9 Global Wind Turbine Blade Market Volume by Material Reinforcement (Blade Sets: 2021-2031) 25
Table 10 Global Wind Turbine Blade Market Value by Material Reinforcement (USD Million: 2021-2031) 25
Table 11 Glass Fiber Reinforced Polymer (GFRP) Blade Market Volume and Value by Region (2021-2031) 27
Table 12 Carbon Fiber & Carbon-Glass Hybrid Blade Market Volume and Value by Region (2021-2031) 29
Table 13 Global Wind Turbine Blade Market Volume by Matrix Resin System (Blade Sets: 2021-2031) 32
Table 14 Global Wind Turbine Blade Market Value by Matrix Resin System (USD Million: 2021-2031) 32
Table 15 Thermosetting Epoxy Resin Blade Market Performance by Region (2021-2031) 34
Table 16 Polyurethane & Thermoplastic Resin Blade Market Performance by Region (2021-2031) 36
Table 17 Global Wind Turbine Blade Market Volume by Business Model (Blade Sets: 2021-2031) 38
Table 18 Global Wind Turbine Blade Market Value by Business Model (USD Million: 2021-2031) 38
Table 19 In-House (Captive) Blade Production Volume by Turbine OEM (Blade Sets: 2021-2031) 40
Table 20 Merchant Blade Manufacturer Contract Output Volume by Producer (Blade Sets: 2021-2031) 42
Table 21 Hybrid Procurement Ratios by Leading Global Wind Turbine OEMs (2021-2026) 43
Table 22 Global Wind Turbine Blade Market Volume by Application (Blade Sets: 2021-2031) 44
Table 23 Global Wind Turbine Blade Market Value by Application (USD Million: 2021-2031) 44
Table 24 Onshore Wind Turbine Blade Volume and Market Value by Region (2021-2031) 46
Table 25 Offshore Wind Turbine Blade Volume and Market Value by Region (2021-2031) 48
Table 26 Capital Cost per Megawatt (CAPEX/MW) Breakdown: Onshore vs. Offshore Rotors (2021-2026) 50
Table 27 Global Wind Turbine Blade Manufacturing Capacity by Key Producing Nation (MW Equivalent: 2021-2026) 51
Table 28 Asia-Pacific Wind Turbine Blade Consumption and Production Metrics (2021-2031) 52
Table 29 China Wind Turbine Blade Market Metrics by Material and Application (2021-2031) 53
Table 30 India Wind Turbine Blade Market Metrics by Material and Application (2021-2031) 54
Table 31 Europe Wind Turbine Blade Consumption and Production Metrics (2021-2031) 55
Table 32 Germany Wind Turbine Blade Market Performance (2021-2031) 56
Table 33 Spain Wind Turbine Blade Market Performance (2021-2031) 57
Table 34 Denmark Wind Turbine Blade Market Performance (2021-2031) 58
Table 35 United Kingdom Wind Turbine Blade Consumption Metrics (2021-2031) 59
Table 36 Turkey Wind Turbine Blade Production and Export Shipments (2021-2031) 60
Table 37 United States Wind Turbine Blade Production, Imports, and Installations (2021-2031) 61
Table 38 Brazil Wind Turbine Blade Market Performance (2021-2031) 62
Table 39 Global Wind Turbine Blade Cross-Border Trade Flows by Origin and Destination (USD Million: 2021-2026) 64
Table 40 Top 10 Global Wind Turbine Blade Manufacturers Ranked by Merchant Output Volume (2026) 66
Table 41 Key Wind Turbine Blade Mergers, Acquisitions, and Equity Alliances (2021-2026) 68
Table 42 Global Wind Turbine Blade Manufacturing Capacity by Company (Blade Sets: 2021-2026) 71
Table 43 TPI Composites Wind Turbine Blade Sales Volume, Price, Cost, and Gross Profit Margin (2021-2026) 75
Table 44 Sinoma Science & Technology Wind Turbine Blade Sales Volume, Price, Cost, and Gross Profit Margin (2021-2026) 79
Table 45 Zhuzhou Times New Material Technology (CRRC TMT) Wind Turbine Blade Sales Volume, Price, Cost, and Gross Profit Margin (2021-2026) 83
Table 46 Chongqing Machinery & Electric Wind Turbine Blade Sales Volume, Price, Cost, and Gross Profit Margin (2021-2026) 87
Table 47 Aeolon Technology Wind Turbine Blade Sales Volume, Price, Cost, and Gross Profit Margin (2021-2026) 91
Table 48 Aeris Energy Wind Turbine Blade Sales Volume, Price, Cost, and Gross Profit Margin (2021-2026) 95
Table 49 Lianyungang Zhongfu Lianzhong Composite Material Group Wind Turbine Blade Sales Volume, Price, Cost, and Gross Profit Margin (2021-2026) 99
Table 50 Human Composites Wind Turbine Blade Sales Volume, Price, Cost, and Gross Profit Margin (2021-2026) 103
Table 51 Mingyang Smart Energy Wind Turbine Blade Sales Volume, Price, Cost, and Gross Profit Margin (2021-2026) 107
Table 52 Sany Renewable Energy Wind Turbine Blade Sales Volume, Price, Cost, and Gross Profit Margin (2021-2026) 111
Table 53 Dongfang Electric Wind Power Wind Turbine Blade Sales Volume, Price, Cost, and Gross Profit Margin (2021-2026) 115
Table 54 Vestas Wind Turbine Blade Sales Volume, Price, Cost, and Gross Profit Margin (2021-2026) 119
Table 55 Siemens Gamesa Wind Turbine Blade Sales Volume, Price, Cost, and Gross Profit Margin (2021-2026) 123
Table 56 GE Vernova Wind Turbine Blade Sales Volume, Price, Cost, and Gross Profit Margin (2021-2026) 127
Table 57 Nordex Wind Turbine Blade Sales Volume, Price, Cost, and Gross Profit Margin (2021-2026) 130
Table 58 ENERCON Global GmbH Wind Turbine Blade Sales Volume, Price, Cost, and Gross Profit Margin (2021-2026) 133
Table 59 Suzlon Energy Wind Turbine Blade Sales Volume, Price, Cost, and Gross Profit Margin (2021-2026) 135
Table 60 Titan Wind Energy Wind Turbine Blade Sales Volume, Price, Cost, and Gross Profit Margin (2021-2026) 137
Figure 1 Global Wind Turbine Blade Market Architecture and Research Triangulation 2
Figure 2 Bottom-Up and Top-Down Sizing Methodological Flow 5
Figure 3 Global Wind Turbine Blade Market Size Dynamics (USD Million: 2021-2031) 8
Figure 4 Global Average Wind Turbine Blade Length Evolution (Meters: 2021-2031) 9
Figure 5 Global Rotor Diameter Scaling vs. Power Density Curve (2021-2031) 13
Figure 6 Global Blade Waste Generation Projections and Decommissioning Volume (2021-2031) 17
Figure 7 Wind Turbine Blade End-to-End Value Chain Linkages 18
Figure 8 Automated Pultrusion vs. Traditional Vacuum Infusion Cycle Time Efficiency 23
Figure 9 Cost Breakdown Structure for 90m+ Offshore Wind Turbine Blades 24
Figure 10 Global Wind Turbine Blade Market Share by Material Reinforcement (2021 vs. 2026 vs. 2031) 26
Figure 11 Carbon Fiber Pultrusion Penetration Rate in Blades Exceeding 85 Meters (2021-2031) 30
Figure 12 Global Wind Turbine Blade Market Share by Matrix Resin System (2021 vs. 2026 vs. 2031) 33
Figure 13 Thermoplastic vs. Epoxy Resin Blade Demolding Cycle Time Reductions 37
Figure 14 Global Wind Turbine Blade Market Share by Business Model (2021-2031) 39
Figure 15 Captive OEM Production Volume vs. Merchant Outsourcing Balance (2021-2031) 41
Figure 16 Global Wind Turbine Blade Market Share by Application (2021-2031) 45
Figure 17 Onshore vs. Offshore Average Blade Length Growth Vectors (2021-2031) 47
Figure 18 Global Offshore Wind Turbine Blade Market Size Trajectory (USD Million: 2021-2031) 49
Figure 19 Global Wind Turbine Blade Manufacturing Capacity Distribution by Country (2026) 51
Figure 20 Asia-Pacific Wind Turbine Blade Market Volume Share by Country (2026) 53
Figure 21 Europe Wind Turbine Blade Demand Hubs vs. Manufacturing Clusters (2026) 56
Figure 22 United States Wind Turbine Blade Production vs. Import Dependency (2021-2026) 61
Figure 23 International Ocean Freight Routes and Transport Bottlenecks for Mega-Blades 63
Figure 24 Global Wind Turbine Blade Manufacturer Market Share (CR4 and CR8 Concentration: 2026) 65
Figure 25 Wind Turbine Blade Structural and Aerodynamic Patent Filings by Country (2021-2026) 69
Figure 26 TPI Composites Wind Turbine Blade Market Share (2021-2026) 75
Figure 27 Sinoma Science & Technology Wind Turbine Blade Market Share (2021-2026) 79
Figure 28 Zhuzhou Times New Material Technology (CRRC TMT) Wind Turbine Blade Market Share (2021-2026) 83
Figure 29 Chongqing Machinery & Electric Wind Turbine Blade Market Share (2021-2026) 87
Figure 30 Aeolon Technology Wind Turbine Blade Market Share (2021-2026) 91
Figure 31 Aeris Energy Wind Turbine Blade Market Share (2021-2026) 95
Figure 32 Lianyungang Zhongfu Lianzhong Composite Material Group Wind Turbine Blade Market Share (2021-2026) 99
Figure 33 Human Composites Wind Turbine Blade Market Share (2021-2026) 103
Figure 34 Mingyang Smart Energy Wind Turbine Blade Market Share (2021-2026) 107
Figure 35 Sany Renewable Energy Wind Turbine Blade Market Share (2021-2026) 111
Figure 36 Dongfang Electric Wind Power Wind Turbine Blade Market Share (2021-2026) 115
Figure 37 Vestas Wind Turbine Blade Market Share (2021-2026) 119
Figure 38 Siemens Gamesa Wind Turbine Blade Market Share (2021-2026) 123
Figure 39 GE Vernova Wind Turbine Blade Market Share (2021-2026) 127
Figure 40 Nordex Wind Turbine Blade Market Share (2021-2026) 130
Figure 41 ENERCON Global GmbH Wind Turbine Blade Market Share (2021-2026) 133
Figure 42 Suzlon Energy Wind Turbine Blade Market Share (2021-2026) 135
Figure 43 Titan Wind Energy Wind Turbine Blade Market Share (2021-2026) 137
Research Methodology
- Market Estimated Methodology:
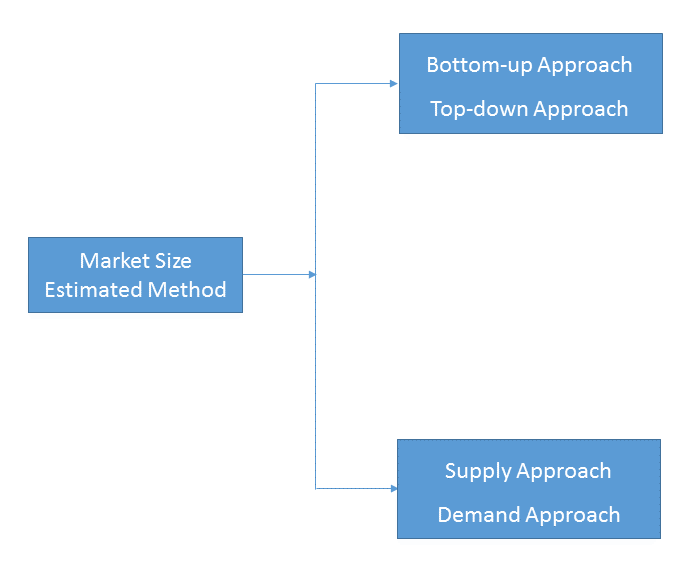
Bottom-up & top-down approach, supply & demand approach are the most important method which is used by HDIN Research to estimate the market size.
1)Top-down & Bottom-up Approach
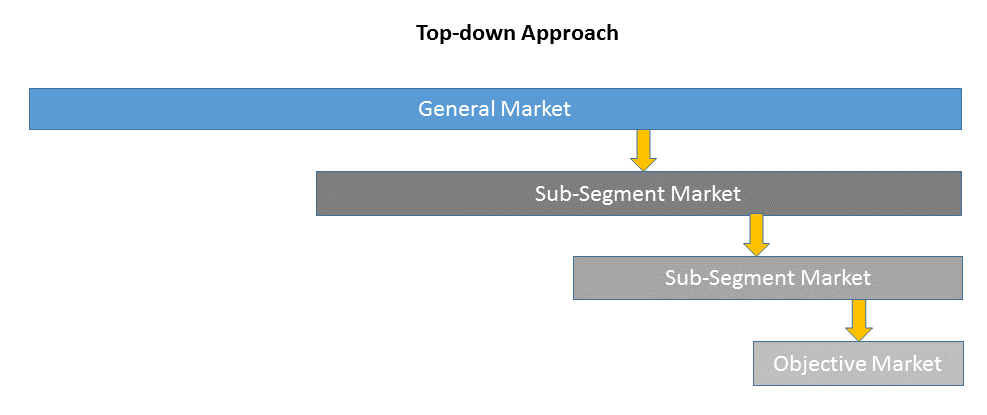
Top-down approach uses a general market size figure and determines the percentage that the objective market represents.
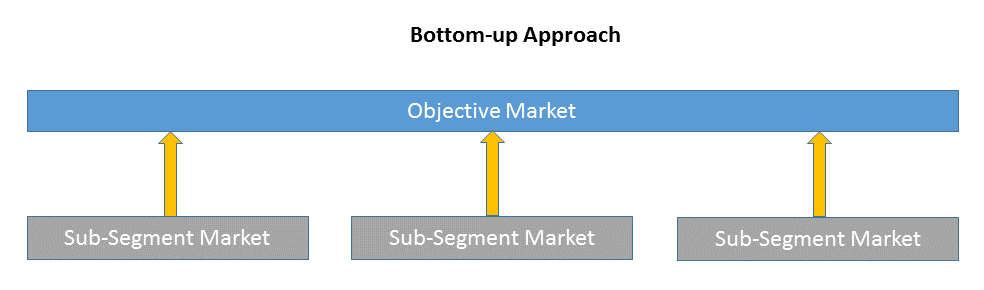
Bottom-up approach size the objective market by collecting the sub-segment information.
2)Supply & Demand Approach
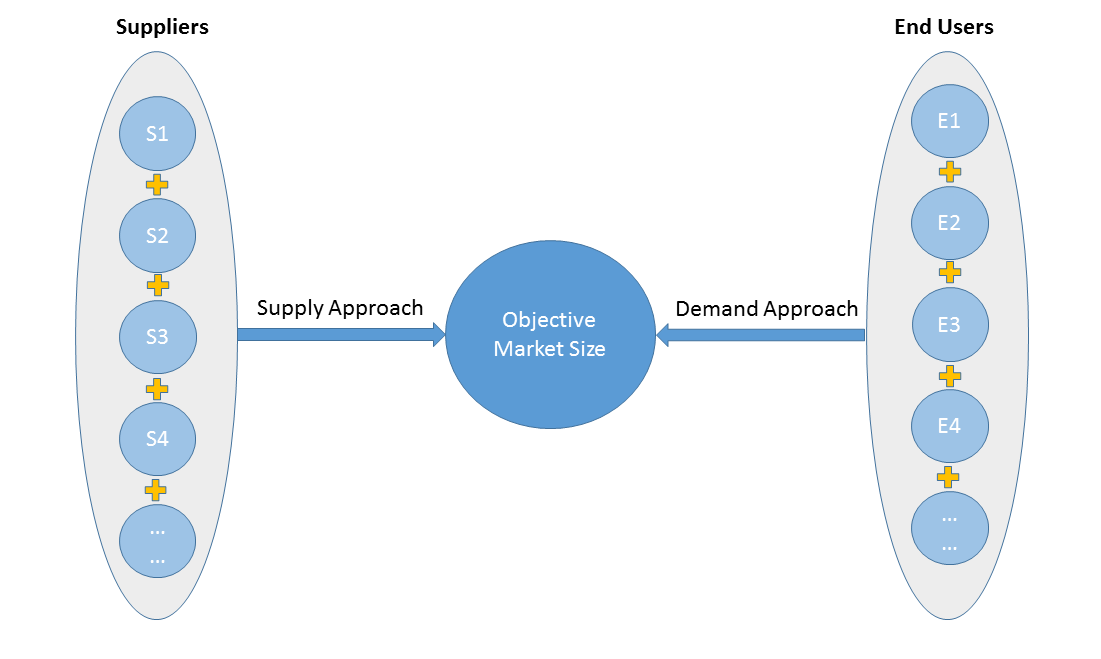
Supply approach is based on assessments of the size of each competitor supplying the objective market.
Demand approach combine end-user data within a market to estimate the objective market size. It is sometimes referred to as bottom-up approach.
- Forecasting Methodology
- Numerous factors impacting the market trend are considered for forecast model:
- New technology and application in the future;
- New project planned/under contraction;
- Global and regional underlying economic growth;
- Threatens of substitute products;
- Industry expert opinion;
- Policy and Society implication.
- Analysis Tools
1)PEST Analysis
PEST Analysis is a simple and widely used tool that helps our client analyze the Political, Economic, Socio-Cultural, and Technological changes in their business environment.
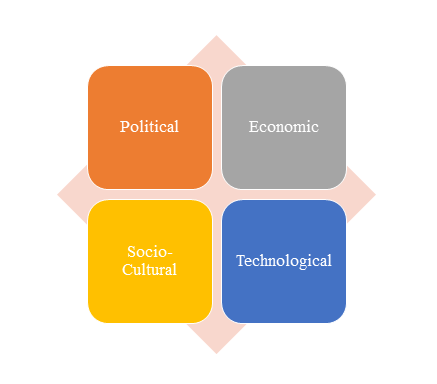
- Benefits of a PEST analysis:
- It helps you to spot business opportunities, and it gives you advanced warning of significant threats.
- It reveals the direction of change within your business environment. This helps you shape what you’re doing, so that you work with change, rather than against it.
- It helps you avoid starting projects that are likely to fail, for reasons beyond your control.
- It can help you break free of unconscious assumptions when you enter a new country, region, or market; because it helps you develop an objective view of this new environment.
2)Porter’s Five Force Model Analysis
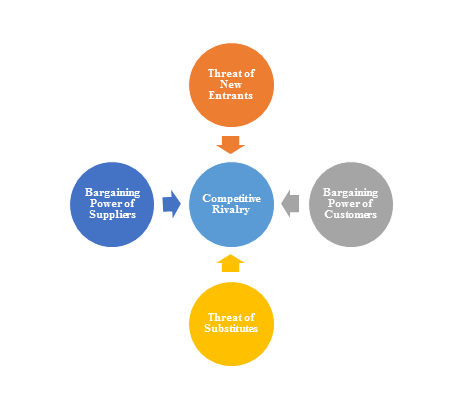
The Porter’s Five Force Model is a tool that can be used to analyze the opportunities and overall competitive advantage. The five forces that can assist in determining the competitive intensity and potential attractiveness within a specific area.
- Threat of New Entrants: Profitable industries that yield high returns will attract new firms.
- Threat of Substitutes: A substitute product uses a different technology to try to solve the same economic need.
- Bargaining Power of Customers: the ability of customers to put the firm under pressure, which also affects the customer's sensitivity to price changes.
- Bargaining Power of Suppliers: Suppliers of raw materials, components, labor, and services (such as expertise) to the firm can be a source of power over the firm when there are few substitutes.
- Competitive Rivalry: For most industries the intensity of competitive rivalry is the major determinant of the competitiveness of the industry.
3)Value Chain Analysis
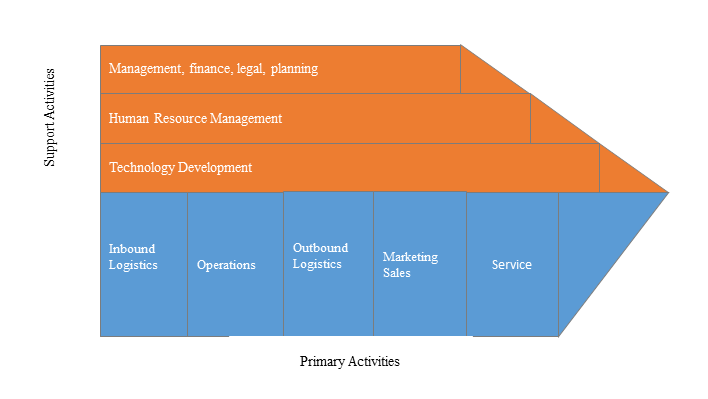
Value chain analysis is a tool to identify activities, within and around the firm and relating these activities to an assessment of competitive strength. Value chain can be analyzed by primary activities and supportive activities. Primary activities include: inbound logistics, operations, outbound logistics, marketing & sales, service. Support activities include: technology development, human resource management, management, finance, legal, planning.
4)SWOT Analysis
SWOT analysis is a tool used to evaluate a company's competitive position by identifying its strengths, weaknesses, opportunities and threats. The strengths and weakness is the inner factor; the opportunities and threats are the external factor. By analyzing the inner and external factors, the analysis can provide the detail information of the position of a player and the characteristics of the industry.
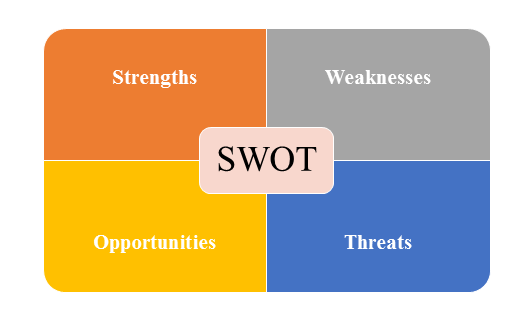
- Strengths describe what the player excels at and separates it from the competition
- Weaknesses stop the player from performing at its optimum level.
- Opportunities refer to favorable external factors that the player can use to give it a competitive advantage.
- Threats refer to factors that have the potential to harm the player.
- Data Sources
| Primary Sources | Secondary Sources |
|---|---|
| Face to face/Phone Interviews with market participants, such as: Manufactures; Distributors; End-users; Experts. Online Survey |
Government/International Organization Data: Annual Report/Presentation/Fact Book Internet Source Information Industry Association Data Free/Purchased Database Market Research Report Book/Journal/News |