Global Wind Tower Market Analysis and Forecast 2021-2031
- Single User License (1 Users) $ 3,500
- Team License (2~5 Users) $ 4,500
- Corporate License (>5 Users) $ 5,500
The global wind tower market size is valued between 4.2 billion USD and 5.2 billion USD in 2026 with a compound annual growth rate within the range of 3 percent to 5 percent through 2031. This expansion is governed by an aggressive structural migration toward taller hub heights, larger turbine nameplate ratings, and increasingly complex multi-megawatt offshore deployments.
In 2025, total global wind installations reached 164.6 gigawatts, with onshore wind representing 155.3 gigawatts (94 percent of global capacity additions) and offshore wind delivering 9.2 gigawatts. Grid-connected additions in 2026 are modeled to absorb 133.5 gigawatts of onshore installations, stepping up to 141.1 gigawatts by 2027. China continues to command the largest installation baseline, having added over 110 gigawatts of onshore wind and 6.59 gigawatts of offshore wind in 2025, followed by the United States, India, and Germany.
Market dynamics are structurally decoupling from pure volume additions toward technical and material value generation. The rapid adoption of 7 megawatt to 10 megawatt onshore turbine platforms and 15 megawatt to 25 megawatt offshore platforms has strained conventional logistics corridors. In response, capital expenditure is flowing toward hybrid concrete-steel structural configurations, localized site-casting yards, and low-carbon electric arc furnace steel procurement. Concurrently, western and Asian markets are contending with regulatory fragmentation, notably the Carbon Border Adjustment Mechanism in the European Union, the One Big Beautiful Bill Act in the United States, and anti-cutthroat pricing agreements among tier-one Chinese turbine original equipment manufacturers.
WIND TOWER PRODUCT CLASSIFICATIONS AND ENGINEERING MECHANICS
1. Steel Tubular Towers
Steel tubular towers continue to represent the standard industrial baseline across onshore deployments and virtually all operational offshore top-tower installations, accounting for more than 85 percent of onshore volume.
Technical Profile and Structural Mechanics: Fabricated primarily from heavy structural carbon steel plates, specifically S355 and S420 grades, tubular sections are roll-formed into cylindrical or truncated conical geometries and submerged-arc welded. Successive shells are coupled via internal high-strength forged steel flanges secured by pretensioned bolting systems. Physical transport envelopes remain the critical design limitation; standard road freight typically constrains individual shell diameters to between 4.0 meters and 5.0 meters, with segment lengths restricted to 30 to 40 meters to comply with overpass clearances and turning radii.
Cost Structure and Decarbonization Trajectory: Raw material inputs represent between 70 percent and 80 percent of direct manufacturing costs. Tower mass scales non-linearly with hub height and top-head nacelle mass. Engineering optimization has yielded significant steel mass rationalization; certain next-generation 3-megawatt class designs, such as the Suzlon S144 platform, have achieved total tubular steel weights of approximately 39 metric tons compared to historical structural weights exceeding 100 metric tons for comparable duties. Simultaneously, Scope 3 embedded emissions mandates have forced original equipment manufacturers to contract low-carbon electric arc furnace steel melted from recycled scrap. For instance, partnerships between Vestas and primary mills such as ArcelorMittal demonstrate up to a 66 percent decrease in the embedded carbon footprint of fabricated tower sections compared to blast furnace-basic oxygen furnace routes.
2. Hybrid Concrete-Steel Towers
Hybrid structural systems integrate an engineered precast concrete lower base with an upper steel tubular section. This architecture serves as the primary technical vector for accessing hub heights between 140 meters and 200 meters.
Technical Profile and Structural Mechanics: The lower 60 percent to 70 percent of the tower height comprises stacked circular precast concrete rings or vertical multi-segment arched panels post-tensioned on-site. The concrete column terminates in a heavy structural transition adapter piece, which supports a conventional steel tubular assembly. This structural division bypasses highway clearance bottlenecks because segmented concrete arches can be transported on standard flatbed trailers or cast on-site within mobile brownfield batching plants.
Market Deployment and Economic Profile: Hybrid towers are uniquely deployed within inland low-wind-speed, high-wind-shear environments across Central Europe and northern and central China. Higher hub heights yield direct levelized cost of electricity reductions by reaching elevated wind resource strata. As demonstrated by Nordex SE on its N175/6.X platform, hub heights of 179 meters featuring 119-meter concrete substructures are now standard commercial offerings. While on-site construction durations are slightly extended—averaging 10 to 15 days per tower—hybrid configurations significantly reduce overall capital expenditure per megawatt at hub heights exceeding 150 meters by substituting expensive thick plate structural steel with localized aggregates and cementitious materials.
3. Precast Prestressed Concrete Towers
Precast prestressed concrete towers represent an alternative engineering approach for extreme hub heights exceeding 160 meters to 200 meters, utilizing concrete across the dominant or entire vertical structural profile.
Technical Profile and Structural Mechanics: Construction relies on high-strength concrete or ultra-high-performance concrete exhibiting compressive strengths of 80 megapascals or greater. Concrete segments are cast with embedded vertical conduits to house high-tensile steel strands. These internal or external tendons are systematically post-tensioned via hydraulic jacks following ring erection to induce severe compressive stress across segment joints, counteracting wind-induced tensile bending moments and dynamic cyclic fatigue.
Operational Assets and Fabrication Constraints: Precast concrete delivers natural material damping properties and resistance to environmental corrosion. However, quality control during segment casting, grout injection, and tendon tensioning demands strict procedural adherence. Fabricators are integrating automated concrete placement systems and robotic segment joint sealants to standardize production velocity, reduce direct assembly labor, and maintain joint integrity over a 25-year operational lifecycle.
DOWNSTREAM APPLICATIONS AND STRUCTURAL TRANSITIONS
1. Onshore Wind Infrastructure
Onshore wind assets constitute the predominant volume foundation of the tower fabrication industry. In 2025, onshore capacity additions reached 155.3 gigawatts globally.
Commercial Delivery Parameters: Onshore towers are low-margin, high-freight-cost assemblies. Structural sections cannot economically bear long-distance ground transportation; consequently, fabricators restrict logistical footprints to within a 500-kilometer radius of installation clusters unless waterborne barging routes are accessible. Projects in interior basins are accelerating the adoption of segmented steel towers and hybrid concrete towers to mitigate excessive road transport permitting delays and route modification expenditures.
2. Offshore Wind Foundations and Top Towers
The offshore wind sector represents a capital-intensive, high-barrier market characterized by massive steel components engineered to survive corrosive marine operating environments.
Market Dynamics and Component Classification: Offshore installations added 9.2 gigawatts in 2025, bringing cumulative global offshore operational capacity to 92.3 gigawatts. The offshore support hierarchy comprises:
- Top Towers: Precision-welded cylindrical steel tubular assemblies installed directly atop maritime substructures, designed with advanced internal coating systems to survive extreme salinity.
- Bottom-Fixed Substructures: Comprising massive monopiles up to 15 meters in diameter and transition pieces, alongside multi-leg steel jackets for deepwater operations exceeding 40 meters. Monopile weights regularly scale past 2,000 to 3,000 metric tons per unit.
- Floating Substructures: Emerging semi-submersible, spar buoy, and tension-leg platform topologies engineered from fabricated steel or prestressed concrete to access deep continental shelf waters.
Execution Realities: Offshore tower and foundation manufacturing yields higher gross profit margins than onshore processing due to specialized structural plate rolling requirements, thick-plate welding qualification standards, and mandatory heavy-load quayside handling infrastructure. Fabricators lacking direct deepwater coastal load-out berths are functionally excluded from tier-one offshore supply agreements.
COMMERCIAL ARCHITECTURE AND CONTRACTUAL EXECUTION
The wind tower supply sector operates predominantly on an engineered-to-order, build-to-order B2B procurement framework. Tower manufacturers interface primarily with turbine original equipment manufacturers or contract directly with balance-of-plant engineering, procurement, and construction contractors and utility developers.
1. Directed Buy and Material Pass-Through Pricing
Due to massive commodity price exposure—with structural steel plate representing up to 80 percent of standard fabrication outlays—the international tower market frequently relies on a directed buy model. Under this contracting structure, the turbine original equipment manufacturer negotiates master pricing agreements for heavy plate inputs directly with primary steel rolling mills. The wind tower fabricator takes delivery of the designated steel under the pre-negotiated corporate procurement terms, converting the raw plate into finished sections under a fixed fabrication and conversion fee per metric ton. This mechanism effectively isolates tower converters from raw steel commodity spot price volatility, pegging fabrication margins strictly to manufacturing productivity, welding efficiency, and yield retention.
2. Bill-and-Hold Accounting Realities
Because civil construction milestones, crane availability, and maritime transport windows fluctuate, wind tower delivery cycles frequently encounter operational misalignment. Tower manufacturers consequently utilize bill-and-hold contractual frameworks. Finished tower sections that have passed factory acceptance testing and non-destructive weld examinations are segregated within the manufacturer's staging yards. Revenue recognition occurs upon project-specific sign-off, prior to physical bill of lading execution, buffering fabricator working capital against downstream installation delays.
SUPPLY CHAIN AND VALUE CHAIN ARCHITECTURE
1. Upstream Raw Materials and Engineered Inputs
- Heavy Structural Steel Plates: The primary cost component consists of normalized or thermo-mechanically rolled carbon steel plates in grades S355 and S420, supplied in thicknesses from 20 millimeters to 150 millimeters by mills such as ArcelorMittal, Baosteel, POSCO, and SSAB.
- Forged Flanges: Large-diameter forged rings are critical structural elements welded directly to tower shell extremities to facilitate multi-section bolt assembly. High-tonnage ring rolling and precision machining capabilities represent a major supply bottleneck, centered among specialized fabricators like Taewoong, Jinlei Technology, and Bharat Forge.
- Concrete and Concrete Additives: Hybrid and prestressed concrete towers require high-early-strength Portland cement, silica fume, structural admixtures, and high-tensile post-tensioning steel strands.
2. Midstream Tower and Substructure Converters
The midstream segment processes heavy plate, executes multi-pass longitudinal and circumferential submerged-arc welding, applies specialized multi-coat epoxy surface treatments, and integrates internal secondary internals (including busbars, service elevators, aluminum access ladders, and electrical switchgear platforms). Global production capacities are consolidated across key multi-facility operations, including CS Wind Corporation, Titan Wind Energy, Dajin Heavy Industry, GRI Renewable Industries, and Taisheng Wind Power.
3. Downstream Integrators and Utility Asset Owners
Finished towers are integrated with high-capacity nacelles, drive-trains, and rotor blade systems. Tier-one turbine original equipment manufacturers—such as Vestas, GE Vernova, Siemens Gamesa, Nordex, Goldwind, Mingyang Smart Energy, Sany Renewable Energy, and Windey—interface with project utilities and independent power producers including Orsted, RWE, NextEra Energy, China Three Gorges, and State Power Investment Corporation.
REGIONAL MARKET DYNAMICS
1. Asia-Pacific
Asia-Pacific remains the primary manufacturing engine and largest consumption region for wind infrastructure, contributing 80 percent of global capacity additions in 2025.
- China: Operating as the absolute volume center, China added approximately 120 gigawatts of wind capacity in 2025, comprising over 110 gigawatts onshore and 6.59 gigawatts offshore. Cumulative Chinese grid-connected wind capacity scaled to 640 gigawatts, generating 1.13 trillion kilowatt-hours of electrical energy. Public turbine procurement tenders surpassed 121 gigawatts, with 70 percent of volume allocated to massive utility bases within northern desert regions (Sanbei). Domestic tower capacity exhibits an operational migration toward ultra-large diameters and hybrid systems to match onshore turbine platforms expanding past 7 to 10 megawatts.
- India: Supported by revised hybrid reverse-auctions and aggressive commercial corporate power purchase agreements, India installed between 6.05 gigawatts and 6.34 gigawatts of onshore wind in 2025, reflecting an 85 percent year-over-year surge. Key domestic integrated turbine players, notably Suzlon Energy and Inox Wind, have restored structural balance sheets and expanded dedicated tower lines.
- Other Asia-Pacific: Australia installed 2.13 gigawatts in 2025, operating as a primary overseas destination for international turbine architectures. Simultaneously, offshore wind frameworks in South Korea, Japan, Taiwan, China, and Vietnam continue to advance, driving localized substructure yard construction.
2. Europe
Europe delivered 19.1 gigawatts of wind installations in 2025 (17.2 gigawatts onshore and 2.0 gigawatts offshore), raising its cumulative operational base to 304 gigawatts. European onshore turbines averaged 5.2 megawatts in capacity, while offshore units reached an average rating of 10.7 megawatts. Regional capacity additions between 2026 and 2030 are modeled to achieve 151 gigawatts, maintaining an average run-rate of 30 gigawatts annually.
- Germany: Regained its status as Europe's primary onshore market, deploying between 5.2 gigawatts and 6.9 gigawatts in 2025 (a 116 percent year-over-year expansion), reaching 68 gigawatts cumulative capacity. Permitting de-bottlenecking led to over 14 gigawatts in new onshore project approvals.
- United Kingdom: Accelerated offshore expansion via Allocation Round 7 of the Contracts for Difference regime, allocating a historic 8.4 gigawatts of offshore projects.
- Rest of Europe: Sweden completed 1.4 gigawatts of onshore additions, Spain delivered 1.2 gigawatts, and France executed foundational leasing for deepwater offshore tenders.
3. North America
North America contributed 4 percent of new global installations in 2025, logging approximately 8.1 gigawatts.
- United States: Added 7.0 gigawatts of onshore wind capacity in 2025. The market is navigating significant trade scrutiny and policy adjustments. Fabrication activity is highly focused on modernizing domestic capacity to serve utility repowering and utility-scale onshore wind farms across the interior wind corridor.
- Canada: Added 1.09 gigawatts in 2025, with growth projections expanding past 2.0 gigawatts per year post-2026, supported by federal clean energy credits and clean provincial power procurement programs.
4. Latin America
Latin America added between 3.5 gigawatts and 4.0 gigawatts in 2025, operating in a temporary cyclical trough due to transmission constraints and power grid interconnection backlogs.
- Brazil: Maintained regional dominance, installing 2.36 gigawatts in 2025, highlighted by major multi-megawatt component handoffs to developments including the Serra do Tigre complex. The Brazilian market is reaching its structural volume bottom, with an installation recovery projected beyond 2026.
- Other Regional Markets: Chile, Colombia, and Mexico saw limited capital deployments, though secondary national pipeline completions are projected to restore regional growth momentum past 2027.
5. Middle East and Africa
The Middle East and Africa region added 2 percent of global capacity in 2025, recording a 32 percent annual expansion.
- Saudi Arabia: Commenced broad-scale utility wind deployment under its renewable energy diversification mandates, with single-market installations projected to expand toward 2.20 gigawatts in 2026.
- South Africa: Delivered 1.20 gigawatts of onshore additions, driven almost entirely by private corporate power purchase agreements navigating national utility load-shedding risks.
- Turkiye: Commissioned 1.7 gigawatts of new onshore wind capacity in 2025, functioning both as an active domestic development sector and as an integrated tower fabrication export hub targeting Southern and Eastern Europe.
REGULATORY FRAMEWORKS, TRADE POLICIES, AND DECARBONIZATION
1. United States Policy Landscape
- One Big Beautiful Bill Act: Passed in mid-2025, the One Big Beautiful Bill Act restructured federal energy tax incentives. While triggering an initial surge in equipment procurement to safe-harbor tax credits, the law enacts a phase-out framework for component manufacturing tax incentives and clean energy production credits for assets placed into service or sold after December 31, 2027. This framework has forced fabricators to streamline operating expenditures.
- Tariffs and Section Policies: Ongoing Section 301 and Section 232 tariffs on foreign steel plates and imported finished wind towers have shielded domestic producers like Arcosa and IES Infrastructure from low-cost overseas steel pricing, effectively requiring turbine original equipment manufacturers to contract long-term manufacturing slots at United States plants.
2. European Union Industrial Directives
- Net Zero Industry Act: Directs that at least 40 percent of Europe's strategic clean energy hardware must be produced within EU borders by 2030. This mandate has compelled global fabricators to construct or expand localized port-adjacent facilities to remain eligible for European public tenders.
- Carbon Border Adjustment Mechanism: Becoming fully operational on January 1, 2026, the Carbon Border Adjustment Mechanism levies carbon equalization duties on carbon-intensive bulk materials, particularly primary carbon steel plate, imported into the European Union. This regulatory regime has altered midstream procurement economics, creating an economic justification for wind tower fabricators to integrate low-carbon electric arc furnace steel to avoid border carbon taxes.
- Return to Two-Way Contracts for Difference: Following failed zero-subsidy auctions in 2024, European governments have broadly abandoned un-capped negative bidding models. National auctions in the United Kingdom, France, and Germany have instituted two-way Contracts for Difference featuring higher administrative strike prices, stabilizing developer project returns and securing forward fabrication work for tower yards.
3. China Market Standardization and Energy Targets
- Self-Discipline Anti-Cutthroat Conventions: Driven by margin collapse and below-cost bidding across 2023 and 2024, major Chinese turbine original equipment manufacturers ratified mutual anti-cutthroat market charters in late 2024 and 2025. This coordinated market discipline effectively established pricing floors on commercial turbine tenders, halting the compression of component conversion fees and allowing tower fabricators to rebuild operating margins.
- NDC 3.0 and Five-Year Planning: China's updated Nationally Determined Contribution submitted at COP30 targets a sixfold expansion in combined wind and solar capacity by 2035 relative to 2020 baselines. Concurrently, initial guidelines for the 15th Five-Year Plan establish a floor of at least 120 gigawatts in annual domestic wind additions, providing multi-year volume visibility for tier-one tower production infrastructure.
COMPANY DOSSIERS
1. CS Wind Corporation: Headquartered in South Korea, CS Wind is the largest dedicated wind tower manufacturer globally, maintaining heavy production operations across Vietnam, the United States, Portugal, China, Taiwan (China), and Denmark.
2. Dongkuk S&C Co., Ltd.: Operating out of Pohang, South Korea, Dongkuk S&C provides utility-scale steel towers and heavy maritime structures, functioning as an integrated partner to both East Asian and Pacific export markets.
3. IES Infrastructure (IES Infrastructure Solutions): An operating division of US-based IES Holdings, Inc., expanding its industrial fabrication presence in North America. On April 30, 2026, IES Infrastructure acquired Broadwind Heavy Fabrications' production facility in Abilene, Texas, strengthening its structural wind presence.
4. Arcosa Wind Towers Inc.: A core subsidiary of Arcosa, Inc. (formerly Trinity Structural Towers), based in Dallas, Texas, operating manufacturing yards across key central United States transportation junctions.
5. GRI Renewable Industries: The renewable energy industrial division of Spain's Gonvarri Industries, GRI operates heavy manufacturing yards in Spain, Brazil, the United States, China, Turkiye, India, and South Africa.
6. Windar Renovables: Headquartered in Aviles, Spain, Windar is a major multinational fabricator of onshore wind towers and deepwater offshore foundation structures, maintaining sites across Spain, India, Brazil, and Mexico.
7. Haizea Wind Group: Headquartered in Bilbao, Spain, Haizea operates fabrication assets in the Port of Bilbao, France (Brest), and Argentina.
8. Marmen: Based in Trois-Rivieres, Quebec, Canada, with manufacturing plants in Canada and the United States (South Dakota), Marmen is a high-precision heavy fabricator and machiner.
9. Titan Wind Energy (Suzhou) Co., Ltd.: Headquartered in Taicang, China, and listed on the Shenzhen Stock Exchange, Titan Wind Energy operates a massive domestic manufacturing network alongside an operational offshore foundation production hub in Germany.
10. TSP Wind Power Group (Shanghai Taisheng Wind Power Equipment Co., Ltd.): Based in Shanghai, China, and listed on the Shenzhen Stock Exchange, TSP Wind Power is an established structural engineering pioneer within the global wind sector.
11. Dajin Heavy Industry Co., Ltd. (DHI): Headquartered in Liaoning, China, with major marine manufacturing assets located in Penglai, Shandong Province, and listed on the Shenzhen Stock Exchange, DHI is a tier-one exporter of offshore foundations.
12. Qingdao Tianneng Heavy Industries Co., Ltd.: Located in Qingdao, Shandong Province, China, and listed on the Shenzhen Stock Exchange, Tianneng is a major supplier of steel components for domestic wind projects.
13. Jiangsu Haili Wind Power Equipment Co., Ltd.: Based in Rudong, Jiangsu Province, China, and listed on the Shenzhen Stock Exchange, Haili Wind Power specializes in offshore support structures.
14. Fujian Fuchuan Yifan New Energy Equipment Manufacturing Co., Ltd.: Located on the Liu'ao Peninsula in Fujian Province, China, the company is a joint venture backed by Fujian Shipbuilding Industry Group and China Three Gorges.
15. Suzlon Energy Ltd.: Headquartered in Pune, India, Suzlon is an integrated wind OEM and structural hardware fabricator with substantial in-house design and production operations.
16. PT. Kenertec Power System: Located in Ciwandan, Banten Province, Indonesia, PT. Kenertec is a key structural manufacturing division of the Korindo Group.
17. Liaoning HeZhan Energy Group Co., Ltd.: Based in Tieling, Liaoning Province, China, and listed on the Shenzhen Stock Exchange, HeZhan Energy has positioned its business model around specialized onshore tall-tower architectures.
MARKET OPPORTUNITIES AND STRUCTURAL BOTTLENECKS
1. Primary Industry Opportunities
- Commercialization of Floating Offshore Foundations: Deepwater wind resources necessitate a migration toward floating structures (semi-submersibles, tension-leg platforms, and spars). The anticipated scaling of commercial-scale floating wind tenders between 2027 and 2031 expands steel and concrete fabrication requirements by four to five times per megawatt relative to fixed-bottom foundations, creating massive demand for high-capacity maritime shipyards.
- Turbine Hub Height Scaling and Hybrid Migration: The operational necessity to capture higher wind resource strata in low-wind-speed onshore regimes is expanding average hub heights beyond 160 meters. This shift drives the adoption of hybrid concrete-steel towers, opening new revenue streams for modular precast concrete suppliers and localized site-casting infrastructure.
- Demand from Data Center Electrification and Green Molecules: Hyper-scale cloud infrastructure and AI data center construction, alongside emerging e-fuels and green hydrogen production clusters, are generating direct private off-take demand. Developers are entering long-term corporate power purchase agreements, accelerating wind project capital commitments independent of sovereign utility auctions.
- Acceleration of Repowering Cycles: The operational maturation of the global wind fleet across Europe and North America has initiated a structural repowering phase. Older 1.5-megawatt to 2-megawatt turbines are being decommissioned and replaced by 5-megawatt to 7-megawatt modern units, requiring entirely re-engineered tower systems and structural foundation replacements.
2. Critical Operational and Structural Bottlenecks
- Transmission Grid Backlogs and Interconnection Timelines: The single most pervasive operational constraint across North America and Europe is the multi-year queue for high-voltage grid connections. Regional transmission operators face long lead times for high-voltage transformers and switchgear, delaying notice-to-proceed milestones for permitted wind farms and stranding fabricated towers in storage yards.
- Port Infrastructure and Heavy Installation Vessel Deficits: Offshore turbine platforms expanding past 15 megawatts require dedicated installation infrastructure. Foundation weights exceeding 2,000 metric tons and tower diameters reaching up to 10 to 15 meters require specialized heavy-lift quaysides with soil-bearing capacities beyond 50 metric tons per square meter, alongside a limited global fleet of ultra-high-capacity wind turbine installation vessels.
- Input Commodity Price Bifurcation: Raw structural plate represents up to 80 percent of direct manufacturing expenses. Divergence between domestic steel prices in tariff-protected markets like the United States and lower baseline steel prices in East Asia complicates pricing structures for multinational turbine original equipment manufacturers. This price gap forces developers to navigate margin compression against strict domestic content compliance mandates.
1.1 Study Framework and Executive Summary 1
1.2 Research Design and Multi-Tiered Verification Matrix 3
1.3 Primary Source Calibration and Data Modeling Parameters 4
1.4 Baseline Macroeconomic Assumptions and Metric Definitions 5
1.5 Nomenclature and Abbreviations 6
Chapter 2 Global Wind Tower Market Landscape: Macro Dynamics and Capacity Metrics 7
2.1 Global Wind Turbine Rating Escalation and Hub Height Directives 7
2.2 Global Wind Tower Market Volume (Units/Metric Tons) and Value (USD Billion) (2021-2026) 9
2.3 Demand Projections and Compound Annual Growth Rates (2027-2031) 11
2.4 Levelized Cost of Energy (LCOE) Pressures on Balance of Plant Components 13
Chapter 3 Global Wind Tower Industry Value Chain and Manufacturing Ecosystem 15
3.1 Upstream Metallurgy: Heavy Steel Plate Sourcing, Forgings, and Flange Supply 15
3.2 Concrete Reinforcement Materials and Composite Hybrid Architectures 17
3.3 Intermediate Processing: Automated Rolling, Longitudinal Submerged Arc Welding, and Shot Blasting 19
3.4 Anti-Corrosion Surface Treatment, Thermal Spraying, and Paint Specifications 20
3.5 Downstream Integration: Original Equipment Manufacturer (OEM) Procurement Frameworks 22
Chapter 4 Global Wind Tower Market Breakdown by Type 24
4.1 Steel Tubular Tower 24
4.1.1 Structural Fabrication Standards and Wall Thickness Evolution 24
4.1.2 Global Production Volume, Sales Revenue, and Realized Price (2021-2031) 26
4.2 Hybrid Concrete-Steel Tower 27
4.2.1 On-Site Slip-Forming versus Modular Precast Segment Mechanics 27
4.2.2 Global Production Volume, Sales Revenue, and Realized Price (2021-2031) 29
4.3 Precast Prestressed Concrete Tower 30
4.3.1 Engineering Economics for Ultra-High Hub Heights (>140m) 30
4.3.2 Global Production Volume, Sales Revenue, and Realized Price (2021-2031) 32
4.4 Comparative Lifecycle Cost, Carbon Intensity, and Structural Fatigue Analysis 33
Chapter 5 Global Wind Tower Market Breakdown by Application 35
5.1 Onshore Wind Power Integration 35
5.1.1 Transportation Bottlenecks, Road Logistical Clearance, and Modular Assembly 35
5.1.2 Market Volume (Units) and Market Size (USD Billion) (2021-2031) 37
5.2 Offshore Wind Power Integration 39
5.2.1 Harsh Marine Environmental Specifications, XXL Monopile Interfacing, and Foundation Loads 39
5.2.2 Market Volume (Units) and Market Size (USD Billion) (2021-2031) 41
Chapter 6 Global Wind Tower Trade Flows: Cross-Border Logistics and Tariff Dynamics 44
6.1 Global Trade Footprint: Major Exporting Corridors and Heavy-Lift Shipping 44
6.2 Trade Defense Instruments, Anti-Dumping Duties, and Countervailing Tariffs 46
6.3 Port Infrastructure Constraints, Quayside Staging Areas, and Installation Vessel Availability 48
6.4 Local Content Mandates and Regional Manufacturing Protectionism 50
Chapter 7 North America Wind Tower Market Dynamics 52
7.1 Regional Market Trajectory and Inflation Reduction Act (IRA) Impact 52
7.2 United States 54
7.3 Canada 57
7.4 Mexico 59
Chapter 8 Europe Wind Tower Market Dynamics 61
8.1 European Union Green Deal, Net-Zero Industry Act, and Offshore Acceleration 61
8.2 Germany 63
8.3 Spain 65
8.4 Denmark 67
8.5 United Kingdom 68
8.6 France & Rest of Europe 70
Chapter 9 Asia-Pacific Wind Tower Market Dynamics 72
9.1 Production Dominance, Raw Material Hegemony, and Deployment Drivers 72
9.2 China 74
9.3 India 77
9.4 South Korea 79
9.5 Southeast Asia 81
9.6 Japan and Australia 83
Chapter 10 Latin America, Middle East, and Africa Wind Tower Market Dynamics 85
10.1 Regional Strategic Shifts and Renewable Energy Transition Mandates 85
10.2 Brazil 87
10.3 Chile 89
10.4 South Africa 90
10.5 Saudi Arabia and Egypt 92
Chapter 11 Competitive Landscape and Market Concentration Benchmarking 94
11.1 Global Tier-1 Manufacturer Market Share and Concentration Matrix (CR4, CR8, HHI) 94
11.2 Strategic Alliances, OEM Preferred Supplier Agreements, and Long-Term Offtake Deals 96
11.3 Greenfield Expansions, Coastal Manufacturing Hubs, and Capex Deployments 98
Chapter 12 Corporate Intelligence: Global Key Players 100
12.1 CS Wind Corporation 100
12.1.1 Corporate Profile and Global Manufacturing Base 100
12.1.2 Strategic SWOT Analysis 101
12.1.3 Wind Tower Operational Metrics (Sales, Pricing, Cost, Margin, Share) 102
12.2 Dongkuk S&C Co. Ltd. 103
12.2.1 Corporate Profile and Production Capabilities 103
12.2.2 Strategic SWOT Analysis 104
12.2.3 Wind Tower Operational Metrics (Sales, Pricing, Cost, Margin, Share) 105
12.3 IES Infrastructure 106
12.3.1 Corporate Profile and Engineering Infrastructure 106
12.3.2 Strategic SWOT Analysis 107
12.3.3 Wind Tower Operational Metrics (Sales, Pricing, Cost, Margin, Share) 108
12.4 Arcosa Wind Towers Inc. 109
12.4.1 Corporate Profile and North American Positioning 109
12.4.2 Strategic SWOT Analysis 110
12.4.3 Wind Tower Operational Metrics (Sales, Pricing, Cost, Margin, Share) 111
12.5 GRI Renewable Industries 112
12.5.1 Corporate Profile and Transnational Industrial Network 112
12.5.2 Strategic SWOT Analysis 113
12.5.3 Wind Tower Operational Metrics (Sales, Pricing, Cost, Margin, Share) 114
12.6 Windar Renovables 115
12.6.1 Corporate Profile and Offshore Foundation Integrations 115
12.6.2 Strategic SWOT Analysis 116
12.6.3 Wind Tower Operational Metrics (Sales, Pricing, Cost, Margin, Share) 117
12.7 Haizea Wind Group 118
12.7.1 Corporate Profile and Port-Centric Fabrication Assets 118
12.7.2 Strategic SWOT Analysis 119
12.7.3 Wind Tower Operational Metrics (Sales, Pricing, Cost, Margin, Share) 120
12.8 Marmen 121
12.8.1 Corporate Profile and High-Precision Heavy Fabrication 121
12.8.2 Strategic SWOT Analysis 122
12.8.3 Wind Tower Operational Metrics (Sales, Pricing, Cost, Margin, Share) 123
12.9 Titan Wind Energy 124
12.9.1 Corporate Profile and European-Asian Dual Footprint 124
12.9.2 Strategic SWOT Analysis 125
12.9.3 Wind Tower Operational Metrics (Sales, Pricing, Cost, Margin, Share) 126
12.10 TSP Wind Power Group 127
12.10.1 Corporate Profile and Structural Component Manufacturing 127
12.10.2 Strategic SWOT Analysis 128
12.10.3 Wind Tower Operational Metrics (Sales, Pricing, Cost, Margin, Share) 129
12.11 Dajin Heavy Industry Co. Ltd (DHI) 130
12.11.1 Corporate Profile and XXL Offshore Tower Leadership 130
12.11.2 Strategic SWOT Analysis 131
12.11.3 Wind Tower Operational Metrics (Sales, Pricing, Cost, Margin, Share) 132
12.12 Tianneng Heavy Industry 133
12.12.1 Corporate Profile and Domestic Core Capacity 133
12.12.2 Strategic SWOT Analysis 134
12.12.3 Wind Tower Operational Metrics (Sales, Pricing, Cost, Margin, Share) 135
12.13 Haili Wind Power 136
12.13.1 Corporate Profile and Offshore Foundation/Tower Synergies 136
12.13.2 Strategic SWOT Analysis 137
12.13.3 Wind Tower Operational Metrics (Sales, Pricing, Cost, Margin, Share) 138
12.14 Fujian Fuchuan Yifan 139
12.14.1 Corporate Profile and Regional Specialized Production 139
12.14.2 Strategic SWOT Analysis 140
12.14.3 Wind Tower Operational Metrics (Sales, Pricing, Cost, Margin, Share) 141
12.15 Suzlon Energy Ltd. 142
12.15.1 Corporate Profile and Vertically Integrated OEM Framework 142
12.15.2 Strategic SWOT Analysis 143
12.15.3 Wind Tower Operational Metrics (Sales, Pricing, Cost, Margin, Share) 144
12.16 PT. Kenertec Power System 145
12.16.1 Corporate Profile and Southeast Asian Export Hub 145
12.16.2 Strategic SWOT Analysis 146
12.16.3 Wind Tower Operational Metrics (Sales, Pricing, Cost, Margin, Share) 147
12.17 Liaoning HeZhan Energy Group 148
12.17.1 Corporate Profile and Heavy Equipment Fabrication 148
12.17.2 Strategic SWOT Analysis 149
12.17.3 Wind Tower Operational Metrics (Sales, Pricing, Cost, Margin, Share) 150
Table 2 Global Wind Tower Market Volume (Units/kMT) and Value (USD Billion) (2021-2026) 10
Table 3 Global Wind Tower Market Volume (Units/kMT) and Value (USD Billion) Forecast (2027-2031) 12
Table 4 Raw Material Price Indices for Heavy Structural Plate, Rebar, and Resins (2021-2026) 16
Table 5 Upstream Heavy Plate Yield Ratios and Flange Material Efficiency Matrix 18
Table 6 Global Wind Tower Market Volume by Type (Units) (2021-2026) 24
Table 7 Global Wind Tower Market Volume Forecast by Type (Units) (2027-2031) 25
Table 8 Global Wind Tower Market Revenue by Type (USD Million) (2021-2026) 25
Table 9 Global Wind Tower Market Revenue Forecast by Type (USD Million) (2027-2031) 26
Table 10 Steel Tubular Tower Average Selling Price and Margin Variance (2021-2031) 27
Table 11 Hybrid Concrete-Steel Tower Average Selling Price and Margin Variance (2021-2031) 29
Table 12 Precast Prestressed Concrete Tower Average Selling Price and Margin Variance (2021-2031) 32
Table 13 Global Wind Tower Market Volume by Application (Units) (2021-2026) 35
Table 14 Global Wind Tower Market Volume Forecast by Application (Units) (2027-2031) 36
Table 15 Global Wind Tower Market Revenue by Application (USD Million) (2021-2026) 37
Table 16 Global Wind Tower Market Revenue Forecast by Application (USD Million) (2027-2031) 38
Table 17 Onshore Wind Tower Installation Logistics and Fleet Capacity Metrics 38
Table 18 Offshore Wind Tower Structural Dimensions, Flange Diameters, and Steel Grades 40
Table 19 Key Cross-Border Trade Flows of Wind Towers by Major Origin-Destination Pairs (2021-2026) 45
Table 20 Regulatory Tariffs, Trade Remedies, and Local Content Requirements by Jurisdiction 47
Table 21 North America Wind Tower Market Volume by Country (Units) (2021-2031) 53
Table 22 North America Wind Tower Market Revenue by Country (USD Million) (2021-2031) 53
Table 23 United States Wind Tower Production, Imports, and Domestic Sales (2021-2031) 55
Table 24 Canada Wind Tower Production, Imports, and Domestic Sales (2021-2031) 58
Table 25 Mexico Wind Tower Production, Imports, and Domestic Sales (2021-2031) 60
Table 26 Europe Wind Tower Market Volume by Country (Units) (2021-2031) 62
Table 27 Europe Wind Tower Market Revenue by Country (USD Million) (2021-2031) 62
Table 28 Germany Wind Tower Production, Imports, and Domestic Sales (2021-2031) 64
Table 29 Spain Wind Tower Production, Imports, and Domestic Sales (2021-2031) 66
Table 30 Denmark Wind Tower Production, Imports, and Domestic Sales (2021-2031) 67
Table 31 United Kingdom Wind Tower Production, Imports, and Domestic Sales (2021-2031) 69
Table 32 France Wind Tower Production, Imports, and Domestic Sales (2021-2031) 71
Table 33 Asia-Pacific Wind Tower Market Volume by Country (Units) (2021-2031) 73
Table 34 Asia-Pacific Wind Tower Market Revenue by Country (USD Million) (2021-2031) 73
Table 35 China Wind Tower Production, Net Exports, and Domestic Consumption (2021-2031) 75
Table 36 India Wind Tower Production, Imports, and Domestic Sales (2021-2031) 78
Table 37 South Korea Wind Tower Production, Imports, and Domestic Sales (2021-2031) 80
Table 38 Vietnam Wind Tower Production, Exports, and Domestic Sales (2021-2031) 81
Table 39 Indonesia Wind Tower Production, Exports, and Domestic Sales (2021-2031) 82
Table 40 Japan and Australia Wind Tower Domestic Consumption and Imports (2021-2031) 84
Table 41 Latin America, Middle East, and Africa Wind Tower Market Volume (Units) (2021-2031) 86
Table 42 Latin America, Middle East, and Africa Wind Tower Market Revenue (USD Million) (2021-2031) 86
Table 43 Brazil Wind Tower Production, Imports, and Domestic Sales (2021-2031) 88
Table 44 Chile Wind Tower Domestic Consumption and Imports (2021-2031) 89
Table 45 South Africa Wind Tower Domestic Consumption and Local Assembly (2021-2031) 91
Table 46 Saudi Arabia and Egypt Wind Tower Domestic Demand and Project Pipelines (2021-2031) 93
Table 47 Global Wind Tower Manufacturer Ranking and Tiering Matrix (2026) 95
Table 48 CS Wind Corporation Wind Tower Sales, Price, Cost and Gross Profit Margin (2021-2026) 102
Table 49 Dongkuk S&C Co. Ltd. Wind Tower Sales, Price, Cost and Gross Profit Margin (2021-2026) 105
Table 50 IES Infrastructure Wind Tower Sales, Price, Cost and Gross Profit Margin (2021-2026) 108
Table 51 Arcosa Wind Towers Inc. Wind Tower Sales, Price, Cost and Gross Profit Margin (2021-2026) 111
Table 52 GRI Renewable Industries Wind Tower Sales, Price, Cost and Gross Profit Margin (2021-2026) 114
Table 53 Windar Renovables Wind Tower Sales, Price, Cost and Gross Profit Margin (2021-2026) 117
Table 54 Haizea Wind Group Wind Tower Sales, Price, Cost and Gross Profit Margin (2021-2026) 120
Table 55 Marmen Wind Tower Sales, Price, Cost and Gross Profit Margin (2021-2026) 123
Table 56 Titan Wind Energy Wind Tower Sales, Price, Cost and Gross Profit Margin (2021-2026) 126
Table 57 TSP Wind Power Group Wind Tower Sales, Price, Cost and Gross Profit Margin (2021-2026) 129
Table 58 Dajin Heavy Industry Co. Ltd (DHI) Wind Tower Sales, Price, Cost and Gross Profit Margin (2021-2026) 132
Table 59 Tianneng Heavy Industry Wind Tower Sales, Price, Cost and Gross Profit Margin (2021-2026) 135
Table 60 Haili Wind Power Wind Tower Sales, Price, Cost and Gross Profit Margin (2021-2026) 138
Table 61 Fujian Fuchuan Yifan Wind Tower Sales, Price, Cost and Gross Profit Margin (2021-2026) 141
Table 62 Suzlon Energy Ltd. Wind Tower Sales, Price, Cost and Gross Profit Margin (2021-2026) 144
Table 63 PT. Kenertec Power System Wind Tower Sales, Price, Cost and Gross Profit Margin (2021-2026) 147
Table 64 Liaoning HeZhan Energy Group Wind Tower Sales, Price, Cost and Gross Profit Margin (2021-2026) 150
Figure 1 Global Wind Turbine Rating and Hub Height Progression (2021-2031) 8
Figure 2 Global Wind Tower Market Value (USD Billion) and Growth Rate (2021-2031) 11
Figure 3 Global Wind Tower Industry Value Chain and Margin Accumulation Profile 16
Figure 4 Steel Tubular vs. Hybrid vs. Precast Concrete Cost Breakdown Dynamics 33
Figure 5 Global Wind Tower Market Share by Type (2021, 2026, 2031) 34
Figure 6 Global Wind Tower Market Share by Application (2021, 2026, 2031) 43
Figure 7 Major Intercontinental Trade Corridors for Wind Towers (2026) 46
Figure 8 North America Wind Tower Revenue Share by Country (2026) 54
Figure 9 Europe Wind Tower Revenue Share by Country (2026) 63
Figure 10 Asia-Pacific Wind Tower Revenue Share by Country (2026) 74
Figure 11 Global Wind Tower Market Concentration (CR4, CR8, HHI) (2021-2026) 96
Figure 12 CS Wind Corporation Wind Tower Market Share (2021-2026) 102
Figure 13 Dongkuk S&C Co. Ltd. Wind Tower Market Share (2021-2026) 105
Figure 14 IES Infrastructure Wind Tower Market Share (2021-2026) 108
Figure 15 Arcosa Wind Towers Inc. Wind Tower Market Share (2021-2026) 111
Figure 16 GRI Renewable Industries Wind Tower Market Share (2021-2026) 114
Figure 17 Windar Renovables Wind Tower Market Share (2021-2026) 117
Figure 18 Haizea Wind Group Wind Tower Market Share (2021-2026) 120
Figure 19 Marmen Wind Tower Market Share (2021-2026) 123
Figure 20 Titan Wind Energy Wind Tower Market Share (2021-2026) 126
Figure 21 TSP Wind Power Group Wind Tower Market Share (2021-2026) 129
Figure 22 Dajin Heavy Industry Co. Ltd (DHI) Wind Tower Market Share (2021-2026) 132
Figure 23 Tianneng Heavy Industry Wind Tower Market Share (2021-2026) 135
Figure 24 Haili Wind Power Wind Tower Market Share (2021-2026) 138
Figure 25 Fujian Fuchuan Yifan Wind Tower Market Share (2021-2026) 141
Figure 26 Suzlon Energy Ltd. Wind Tower Market Share (2021-2026) 144
Figure 27 PT. Kenertec Power System Wind Tower Market Share (2021-2026) 147
Figure 28 Liaoning HeZhan Energy Group Wind Tower Market Share (2021-2026) 150
Research Methodology
- Market Estimated Methodology:
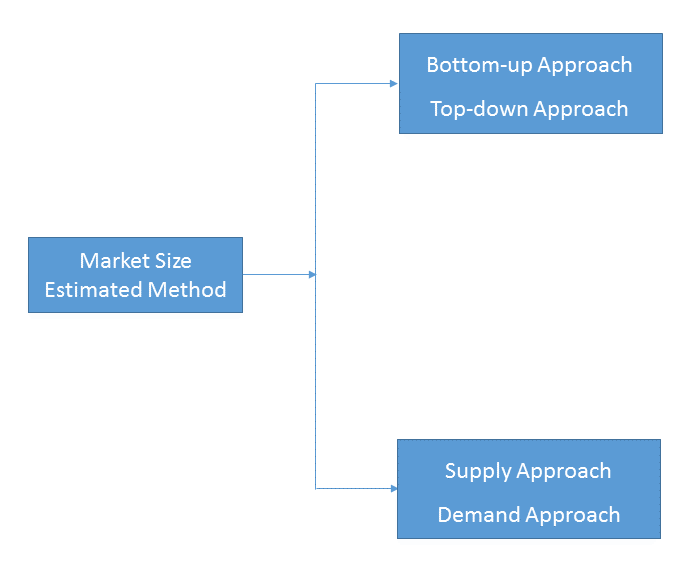
Bottom-up & top-down approach, supply & demand approach are the most important method which is used by HDIN Research to estimate the market size.
1)Top-down & Bottom-up Approach
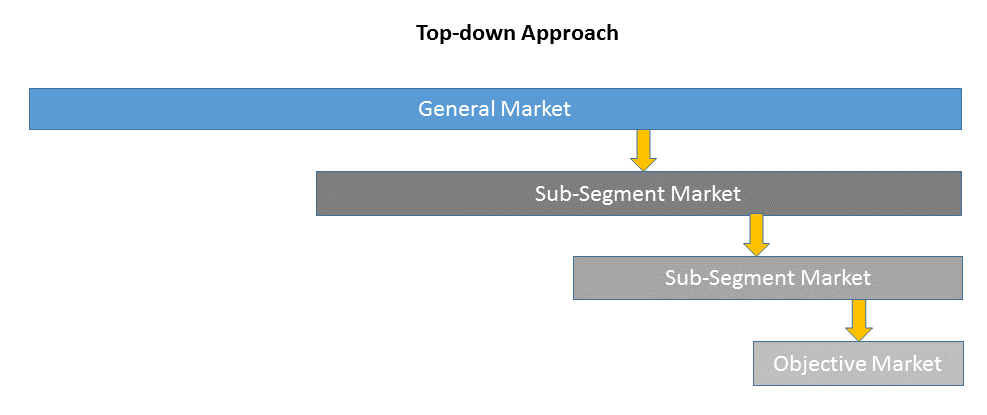
Top-down approach uses a general market size figure and determines the percentage that the objective market represents.
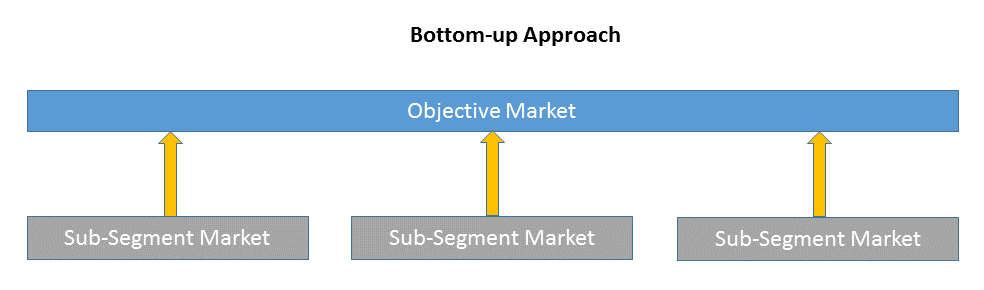
Bottom-up approach size the objective market by collecting the sub-segment information.
2)Supply & Demand Approach
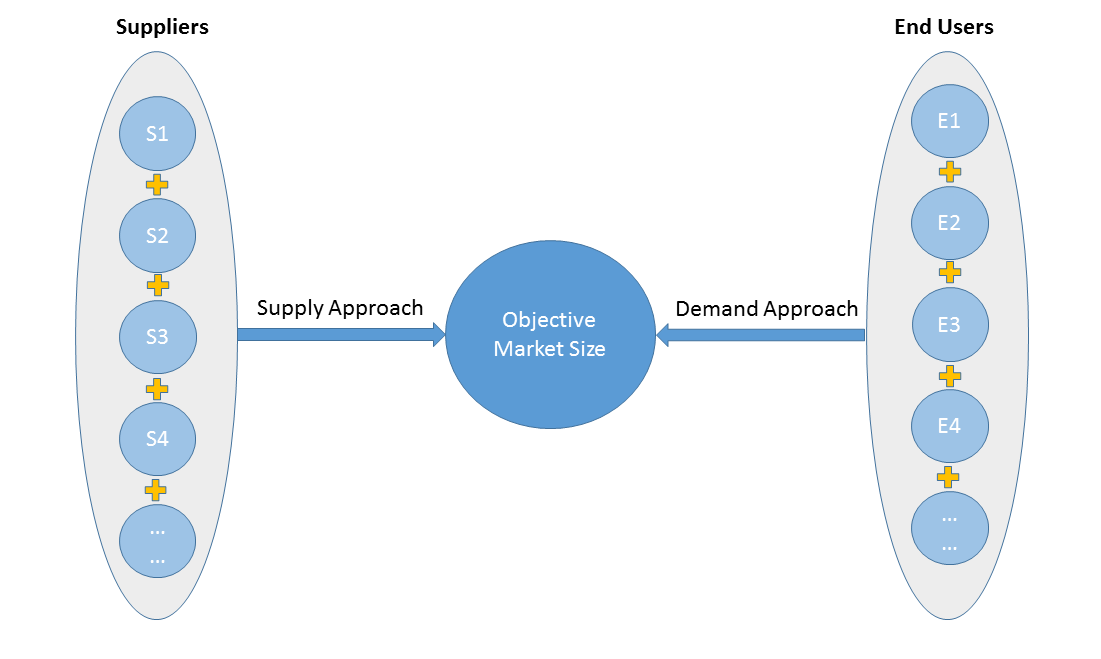
Supply approach is based on assessments of the size of each competitor supplying the objective market.
Demand approach combine end-user data within a market to estimate the objective market size. It is sometimes referred to as bottom-up approach.
- Forecasting Methodology
- Numerous factors impacting the market trend are considered for forecast model:
- New technology and application in the future;
- New project planned/under contraction;
- Global and regional underlying economic growth;
- Threatens of substitute products;
- Industry expert opinion;
- Policy and Society implication.
- Analysis Tools
1)PEST Analysis
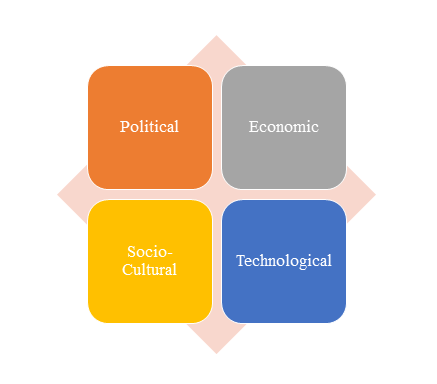
PEST Analysis is a simple and widely used tool that helps our client analyze the Political, Economic, Socio-Cultural, and Technological changes in their business environment.
- Benefits of a PEST analysis:
- It helps you to spot business opportunities, and it gives you advanced warning of significant threats.
- It reveals the direction of change within your business environment. This helps you shape what you’re doing, so that you work with change, rather than against it.
- It helps you avoid starting projects that are likely to fail, for reasons beyond your control.
- It can help you break free of unconscious assumptions when you enter a new country, region, or market; because it helps you develop an objective view of this new environment.
2)Porter’s Five Force Model Analysis
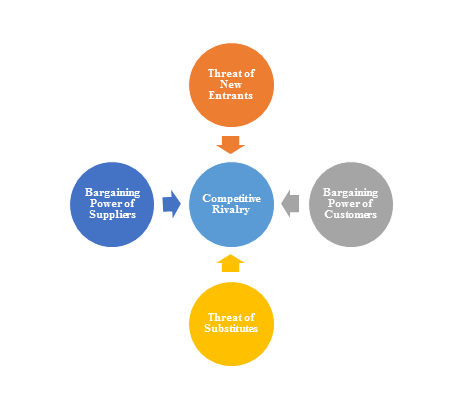
The Porter’s Five Force Model is a tool that can be used to analyze the opportunities and overall competitive advantage. The five forces that can assist in determining the competitive intensity and potential attractiveness within a specific area.
- Threat of New Entrants: Profitable industries that yield high returns will attract new firms.
- Threat of Substitutes: A substitute product uses a different technology to try to solve the same economic need.
- Bargaining Power of Customers: the ability of customers to put the firm under pressure, which also affects the customer's sensitivity to price changes.
- Bargaining Power of Suppliers: Suppliers of raw materials, components, labor, and services (such as expertise) to the firm can be a source of power over the firm when there are few substitutes.
- Competitive Rivalry: For most industries the intensity of competitive rivalry is the major determinant of the competitiveness of the industry.
3)Value Chain Analysis
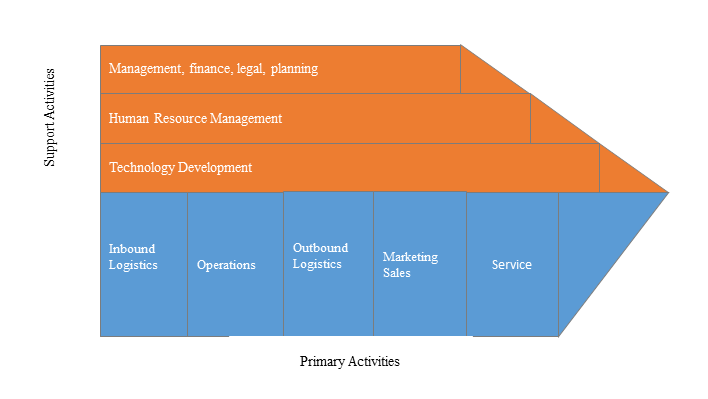
Value chain analysis is a tool to identify activities, within and around the firm and relating these activities to an assessment of competitive strength. Value chain can be analyzed by primary activities and supportive activities. Primary activities include: inbound logistics, operations, outbound logistics, marketing & sales, service. Support activities include: technology development, human resource management, management, finance, legal, planning.
4)SWOT Analysis
SWOT analysis is a tool used to evaluate a company's competitive position by identifying its strengths, weaknesses, opportunities and threats. The strengths and weakness is the inner factor; the opportunities and threats are the external factor. By analyzing the inner and external factors, the analysis can provide the detail information of the position of a player and the characteristics of the industry.
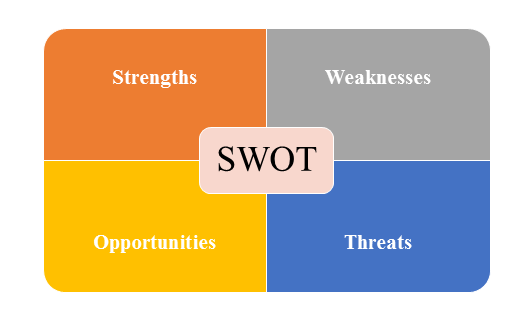
- Strengths describe what the player excels at and separates it from the competition
- Weaknesses stop the player from performing at its optimum level.
- Opportunities refer to favorable external factors that the player can use to give it a competitive advantage.
- Threats refer to factors that have the potential to harm the player.
- Data Sources
| Primary Sources | Secondary Sources |
|---|---|
| Face to face/Phone Interviews with market participants, such as: Manufactures; Distributors; End-users; Experts. Online Survey |
Government/International Organization Data: Annual Report/Presentation/Fact Book Internet Source Information Industry Association Data Free/Purchased Database Market Research Report Book/Journal/News |