Wind Turbine Market Analysis & Global Outlook 2021-2031
- Single User License (1 Users) $ 3,500
- Team License (2~5 Users) $ 4,500
- Corporate License (>5 Users) $ 5,500
The global wind turbine market size is valued between 76 billion USD and 86 billion USD in 2026, advancing at a compound annual growth rate (CAGR) of 3% to 5% through 2031. Structural market acceleration is compelled by sovereign energy security directives, deep industrial electrification, large-scale commercial power purchase agreements (PPAs), and baseload electricity demand generated by hyperscale artificial intelligence data infrastructure. These tailwinds are balanced against grid interconnection backlogs, local-content trade friction, and balance-of-plant capital expenditure escalation. Consolidated tier-1 original equipment manufacturers (OEMs) dominating global deliveries, including Vestas, Siemens Gamesa, GE Vernova, Nordex, Envision Energy, Goldwind, Mingyang Smart Energy, Sany Renewable Energy, Windey Energy Technology, and specialized regional champions such as Suzlon Energy, Inox Wind, and Dongfang Electric.
SYSTEM ARCHITECTURE & PRODUCT CLASSIFICATION
A Wind Turbine Generator is an integrated electro-mechanical generation platform engineered to convert boundary-layer aerodynamic kinetic energy into grid-compliant, utility-grade alternating current. Modern turbine systems are categorized across capacity classes and drivetrain configurations.
Subsystem Breakdown
- Aerodynamic Rotor Assembly: Aerodynamically profiled composite rotor blades fabricated from fiberglass, high-modulus carbon fiber pultrusions, epoxy resins, and structural balsa or polyethylene terephthalate (PET) cores. These are affixed to a spheroidal graphite cast iron hub, extracting kinetic fluid energy via aerodynamic lift and imparting low-speed rotational torque.
- Nacelle & Drivetrain Subsystem: Houses the primary low-speed shaft, spherical or tapered roller main bearings, mechanical braking units, intermediate transmission components, and generators. This subsystem handles high multi-axis mechanical loads while preserving structural alignment.
- Yaw & Pitch Actuation: Electro-mechanical or electro-hydraulic pitch mechanisms rotate blades along their longitudinal axes to govern aerodynamic stall, power capture, and rotor overspeed braking. Dedicated yaw motor-gear assemblies dynamically track meteorological wind vectors to mitigate asymmetric yaw moments.
- Power Conversion & Electrical Systems: Employs full-power or partial-scale back-to-back insulated-gate bipolar transistor (IGBT) or silicon carbide (SiC) converters, water-cooled medium-voltage transformers located within the nacelle or tower base, switchgear, and fault-ride-through control software ensuring grid compliance.
- Structural Substructure: Comprises tapered tubular steel sections, pre-stressed concrete towers, or hybrid concrete-steel architectures for onshore sites. Offshore units leverage fixed-bottom monopiles, high-depth jackets, gravity-base structures, or semi-submersible tension-leg floating foundations.
2. Capacity Classifications
● Onshore Wind Turbine Platforms
- 2MW to 4MW Class: Legacy workhorse configurations utilized in low-to-medium wind regimes, transportation-constrained inland sites, and regional repowering initiatives. In markets such as India and parts of Latin America, 2.X MW to 3.3 MW platforms remain functional anchors, while North American operators leverage late-generation 2.8 MW to 3.6 MW designs for targeted brownfield fleet repowering.
- 4MW to 8MW Class: The global commercial mainstream for onshore wind generation across Europe, North America, and vast multi-provincial grids in Asia. Standard models feature rotor swept diameters between 150 and 185 meters, optimizing levelized cost of electricity (LCoE) through elevated hub heights and high capacity factors.
- Above 8MW Class: The vanguard of onshore design, deployed within desert and steppe mega-clean energy bases, notably across Northern and Northwestern China. Commercial deployment includes single-unit capacities scaling from 8 MW to 12.5 MW, paired with swept diameters exceeding 200 meters.
● Offshore Wind Turbine Platforms
- 8MW to 16MW Class: The prevailing industrial baseline for fixed-bottom installations situated in marine depths up to 50 meters. These systems feature reinforced environmental corrosion packages, self-hoisting maintenance cranes, and direct-drive or medium-speed drivetrains engineered for high availability in harsh sea conditions.
- Above 16MW Class: Ultra-large offshore platforms engineered for high-energy maritime corridors, deepwater concessions, and typhoon-resilient installations. Commercial prototypes and early production serials range from 16 MW to 20 MW, spanning swept diameters greater than 250 meters.
3. Drivetrain Architecture Dynamics
● Doubly-Fed Induction Generator (DFIG) Systems
- Technical Operating Principles: Employs a multi-stage, high-ratio gearbox (typically 1:100 to 1:120) combined with a high-speed wound-rotor induction generator. A partial-scale bidirectional converter processes roughly 30% of the nominal generator output via the rotor circuit, while stator power routes straight to the collection network.
- Strategic Attributes: DFIG platforms maintain capital expenditure advantages because the partial-capacity converter minimizes high-cost power electronics. The mechanical supply chain is mature, supporting extensive high-power installations.
- Strategic Vulnerabilities: Long-term operational expenditures are influenced by mechanical wear on high-speed stage gears, main bearings, and generator slip rings, requiring ongoing condition-monitoring protocols.
● Direct-Drive Permanent Magnet Synchronous Generator (PMSG) Systems
- Technical Operating Principles: Discards the mechanical gearbox. The low-speed aerodynamic rotor shaft connects directly to an ultra-large-diameter synchronous generator featuring high-coercivity Neodymium-Iron-Boron (NdFeB) rare earth permanent magnets, with total electrical output processed via a 100% full-capacity power converter.
- Strategic Attributes: High mechanical reliability, minimal operational friction, superior low-wind electrical efficiency, and lower planned maintenance profiles, making it suitable for offshore installations.
- Strategic Vulnerabilities: Substantial top-head nacelle mass creates heavy structural loads on towers and foundations. Sourcing models remain exposed to rare earth upstream price spikes and processing concentration.
● Semi-Direct Drive Systems (Medium-Speed Hybrid Drive)
- Technical Operating Principles: Integrates a compact single-stage or two-stage planetary gearbox (gear ratios between 1:10 and 1:35) directly with a medium-speed permanent magnet or synchronous generator, managed by a full-power electrical conversion train.
- Strategic Attributes: Balances top-head mass with drivetrain envelope volume, yielding a compact nacelle that eases overland logistics, reduces crane capacity requirements, and preserves drivetrain reliability.
- Strategic Vulnerabilities: Planetary stage gear tooth micro-pitting risks and medium-speed bearing wear demand specialized elastohydrodynamic lubrication, oil filtration systems, and strict manufacturing tolerances.
VALUE CHAIN ARCHITECTURE & BOTTLENECK RESILIENCE
The wind turbine industrial ecosystem exhibits high structural concentration across three interlinked tiers:
● Upstream Feedstocks & Sub-Tier Mechanical Components
- Structural Metallurgy & Casting: Heavy structural steel plate, vacuum-degassed forged alloy steel shafts, and ductile cast iron (EN-GJS-400 series) for hubs, baseframes, and planet carriers. Key market vulnerabilities center on large-scale casting foundry availability, particularly for components supporting 10 MW+ turbines.
- Composite Materials & Core Systems: High-performance structural resins, continuous filament fiberglass textiles, pultruded carbon-fiber structural caps, and high-density balsa or structural foam cores. Supply risk shifts with regional resin chemical plants and precursor prices for carbon fiber.
- Rare Earth Elements & Magnetics: Dysprosium and Neodymium supply pipelines tied to sintered NdFeB magnet manufacturing remain concentrated within East Asia, posing cross-border supply chain risks for direct-drive and medium-speed platforms.
- Mechanical Sub-assemblies: Specialized pitch and yaw reducers, high-capacity dual spherical roller and tapered roller main bearings, hydraulic pitch controls, and automated continuous-feed lubrication systems.
● Midstream Main Component Manufacturing & OEM Assembly
- Rotor Blade Fabrication: In-house OEM production running alongside specialist Tier-1 fabricators. Manufacturing constraints relate to vacuum-assisted resin transfer tooling space, dynamic mold cycling throughput, and regional transport logistics for blade lengths extending past 100 meters.
- Transmission & Conversion: Mechanical gear drive assembly, generator winding, and converter manufacturing. Main production nodes leverage high-precision tooth-grinding capacity and automated coil winding.
- Tower & Substructure Production: Structural fabrication of cylindrical steel tower shells, concrete segmental sections, transition pieces, and offshore monopiles or jacket substructures.
- Nacelle Integration: Original equipment manufacturers perform systems integration, cold-climate winterization packages, internal wire harnesses, top-head cooling loops, and end-of-line software validations at regional assembly hubs.
● Downstream Asset Integration & Lifecycle Operations
- Power Generation Utilities & Independent Power Producers (IPPs): Public utility corporations, state clean-energy conglomerates, private IPPs, and institutional infrastructure funds executing large-scale project capital allocations.
- Balance of Plant (BoP) & Offshore Marine Contracting: Civil works, onshore heavy transport, substations, subsea inter-array cabling, and offshore heavy-lift wind turbine installation vessels (WTIVs) equipped with high-capacity jacking legs and cranes.
- Digital Operations & Maintenance: Continuous condition monitoring systems (CMS), SCADA telematics, supervisory neural networks for predictive pitch adjustment, blade erosion repair, and repowering services at operational life expiration (20 to 30 years).
SALES CHANNELS & COMMERCIALIZATION MODELS
Utility wind turbine sales operate via four main transactional structures:
● Direct Bilateral Framework Agreements
Tier-1 turbine manufacturers sign enterprise-level Master Supply Agreements (MSAs) and preferred partner frameworks with high-volume IPPs and major electric utilities. These multi-year pipeline commitments feature indexed component pricing schedules, defined delivery slot reservations, and standardized warranty liability structures.
● Sovereign Auctions & Competitive Tendering
Public authorities administer competitive auctions utilizing Levelized Cost of Energy (LCoE) thresholds, system reliability commitments, and grid compliance requirements. OEMs align with project developers during early site engineering to complete pre-qualification documentation, power curve yield models, and acoustic profile guarantees, securing supply rights when developers win auction capacity.
● Equipment Supply Versus Turnkey Engineering, Procurement, and Construction (EPC)
- Supply-and-Commissioning Models: The OEM delivers primary wind turbine components to the project boundary, providing technical advisory personnel for final mechanical and electrical erection, while balance-of-plant civil and electrical contracts are handled separately by the asset owner.
- Full Balance-of-Plant / EPC Delivery: The OEM, frequently operating via an engineering joint venture or balance-of-plant subsidiary, assumes broad execution risk, covering resource anemometry, foundation works, substation buildout, internal grid interconnection, and final turbine energization.
● Co-Development Assets & Long-Term Service Agreements (LTSA)
- Co-Development Channel: Manufacturers secure land rights, complete environmental impact studies, and advance interconnection queue positions independently or in partnership with local developers, ultimately divesting the de-risked project rights with an exclusive turbine supply contract attached.
- Fleet Operations & Maintenance Contracts: Strategic asset monetization relies heavily on long-term service agreements (LTSAs). Spanning initial warranty commitments (typically two to five years) through extended service programs spanning 15 to 30 years, these contracts carry performance-based output guarantees that deliver steady, high-margin cash flows for OEMs.
REGIONAL DYNAMICS & CORRIDOR ARBITRAGE
● Asia-Pacific (APAC)
- Regional Dynamics: APAC functions as the primary volume driver for global wind additions, accounting for nearly 80% of new worldwide capacity. Regional additions reflect significant infrastructure spending, massive desert energy bases, and expanding offshore concessions.
- China: The largest national market globally, delivering 130.82 GW of new capacity in 2025. Onshore projects represent 96% of domestic installations, focused heavily in Northern and Northwestern mega-bases, alongside a growing offshore segment (4%) moving into deeper water. The market operates with competitive multi-OEM tenders and localized supply chains.
- India: The third-largest global wind market, adding between 6.05 GW and 6.34 GW of onshore capacity in 2025, an 85% year-on-year increase. Activity is propelled by the central government 10 GW annual bidding mandate, corporate off-take for Firm and Dispatchable Renewable Energy (FDRE), and hybrid wind-solar architectures.
- Australia: Added between 1.43 GW and 2.12 GW of capacity, driven by coal-generation retirement schedules and state-level Renewable Energy Zones (REZs).
- Japan and South Korea: Developing offshore project pipelines focused on typhoon-resistant platforms, localized port infrastructure, and floating wind platforms.
- Taiwan, China: Completed 157 MW of offshore installations in 2025 as part of ongoing phased offshore developments, navigating local content rules and maritime supply chains.
● Europe
- Regional Dynamics: Europe represents the second-largest installation zone globally, recording 19.1 GW of new additions in 2025 to surpass 300 GW in cumulative operating wind capacity. Strategic priorities emphasize supply chain independence, non-price auction criteria, and offshore buildouts in the North Sea.
- Germany: The anchor European market, benefiting from streamlined permitting under the Renewable Energy Sources Act (EEG), resulting in over 14 GW of awarded onshore auctions.
- United Kingdom: The largest regional offshore wind base. The implementation of Allocation Round 7 (AR7) expanded Contract-for-Difference terms to 20 years, securing 8.4 GW in wind capacity allocations.
- Sweden, Spain, and France: Sweden added between 0.75 GW and 1.40 GW (+114% YoY). Spain installed between 0.61 GW and 1.20 GW, while France deployed between 0.80 GW and 1.00 GW, focusing on low-wind onshore applications and emerging offshore tenders.
● North America
- Regional Dynamics: Accounts for roughly 4% of new global additions, characterized by multi-gigawatt backlogs, trade investigations, tax policy recalibrations, and growing baseload requirements from commercial data operations.
- United States: Installed 6.99 GW of onshore wind capacity in 2025. Execution timelines face grid interconnection queues and legislative revisions to energy incentives, but long-term visibility is reinforced by utility resource plans and clean-energy demand from artificial intelligence computing hubs.
- Canada: Added between 0.34 GW and 1.09 GW in 2025, with forecast trajectories exceeding 2.0 GW in 2026 driven by provincial decarbonization mandates and industrial demand in Alberta and Saskatchewan.
● Latin America (LATAM)
- Regional Dynamics: Contributed roughly 2% of annual global installations, navigating high capital costs and local transmission constraints.
- Brazil: The primary regional anchor, installing between 1.28 GW and 2.40 GW in 2025. The market faced high domestic interest rates, delayed transmission tenders, and power curtailments, though long-term growth is tied to the free electricity market (ACL) and green industrial feedstock projects.
- Other LATAM Markets: Mexico installed approximately 260 MW, Argentina deployed 106 MW, and Chile added 39 MW. Regional growth is projected to rebound in 2026-2027 as regional grids expand.
● Middle East & Africa (MEA)
- Regional Dynamics: MEA accounted for roughly 2% of global installations, registering an estimated 32% year-on-year growth driven by fossil-fuel displacement initiatives and state-directed renewable investments.
- Saudi Arabia: Advancing gigawatt-scale wind projects linked to the National Renewable Energy Program, targeting over 2.20 GW of installations in 2026.
- South Africa: Added between 0.48 GW and 1.20 GW of operational capacity in 2025, aided by private energy wheeling regulations and structural unbundling of the national power utility.
- Turkey: Maintained continuous onshore expansion, commissioning between 1.08 GW and 1.71 GW of new capacity.
REGULATORY REGIMES & JURISDICTIONAL FRAMEWORKS
● United States Policy & Trade Environment
- Inflation Reduction Act (IRA) and OBBBA: Extended the Production Tax Credit (PTC) and Investment Tax Credit (ITC), alongside Section 45X Advanced Manufacturing Production Credits offering targeted subsidies for domestic wind components. However, under the July 2025 One Big Beautiful Bill Act (OBBBA), wind installations commencing construction after July 4, 2026, must reach commercial operation before December 31, 2027, to claim full PTC/ITC value, while domestic component manufacturing credits sunset at the close of 2027.
- Section 232 Trade Actions: In August 2025, trade authorities initiated an investigation under Section 232 of the Trade Expansion Act of 1962, assessing the national security impacts of imported wind turbine assemblies, towers, and sub-tier mechanical systems.
- Uyghur Forced Labor Prevention Act (UFLPA): Customs authorities have applied heightened scrutiny to imports of composite blades and sub-components, impacting delivery timelines for international component producers.
● European Union Industrial Frameworks
- Net-Zero Industry Act (NZIA): Implemented secondary guidelines requiring national renewable capacity auctions to include qualitative, non-price selection criteria. These rules evaluate supply chain resilience, cybersecurity protections, and environmental sustainability, reducing reliance on single-country import channels.
- Clean Industrial Support Framework (CISAF): Introduced in June 2025, CISAF provides a structured mechanism for member states to offer temporary financial guarantees and state aid to clean-technology manufacturing facilities through 2030.
- North Sea Hamburg Declaration: Ratified in January 2026 by nine coastal European nations, setting collective deployment goals of 100 GW of cross-border offshore wind capacity by 2050, supporting a broader 300 GW North Sea regional ambition.
● China Domestic Policy Drivers
- Energy Law of the People's Republic of China: Enacted on January 1, 2025, codifying the legal priority of renewable energy resources within the national power grid, establishing market-based carbon quota frameworks, and accelerating inter-provincial power transfers.
- Document 136 Regulatory Shift: Issued in February 2025, this mandate transitions new renewable power generation into direct competitive power market auctions and bilateral contract mechanisms, replacing fixed administrative support with market-based pricing.
- Beijing Wind Energy Declaration 2.0: Approved targets for the 15th Five-Year Plan period (2026-2030), calling for at least 120 GW of new wind turbine installations annually (including a minimum of 15 GW offshore per year), aiming for 1,300 GW in total wind capacity by 2030 and 2,000 GW by 2035.
- Offshore Fiscal Measures: Implemented a 50% Value-Added Tax (VAT) refund on electricity generation from domestic offshore wind installations, effective through late 2027.
● India Industrial Directives
- Bidding Architecture and ALMM: The central government mandates a 10 GW annual wind auction pipeline alongside enforcement of the Approved List of Models and Manufacturers (ALMM), requiring developers to source from verified local and international manufacturing setups to qualify for grid connectivity.
- Grid Transmission Waivers: Multi-year waivers on Inter-State Transmission System (ISTS) charges continue to support wind generation situated in resource-dense corridors delivering electricity to industrial centers in other regions.
COMPETITIVE DOSSIERS
● Vestas Wind Systems A/S: Global operational footprint across Europe, the Americas, and Asia-Pacific, paired with a high-margin, long-term service division managing more than 150 GW of active assets. Platform Portfolio: Modular EnVentus platform (spanning the V150-6.0 MW, V162-6.2/7.2 MW, and V172-7.2 MW models), alongside mature 2 MW and 4 MW installations. The offshore segment is anchored by the commercially deployed V236-15.0 MW platform.
- Strategic Pivot: Moving toward modular nacelle architectures that standardize components across both onshore and offshore platforms, controlling supply chain complexity and stabilizing operating margins over raw volume chasing.
● Siemens Gamesa: Longstanding intellectual property in offshore direct-drive systems, supported by deep balance-sheet integration with Siemens Energy. Platform Portfolio: Geared onshore platforms comprising the SG 4.X and SG 5.X series, alongside a mature offshore direct-drive portfolio featuring the SG 8.0-167 DD, SG 11.0-200 DD, and SG 14-222 DD (expandable to 15 MW).
● GE Vernova: Strong operational footprint in the North American utility landscape, with large operating fleets across the 2.X MW and 3.X MW onshore families. Platform Portfolio: Workhorse onshore platforms including the 2.X and 3.X MW series, the Sierra platform, the Cypress 5.5-6.0 MW series, and the commercial Haliade-X offshore platform (rated between 12 MW and 14.7 MW).
● Nordex Group: Focused purely on onshore installations, with an established supply chain and project development footprint across Europe, Latin America, and select emerging markets. Platform Portfolio: Anchored by the Delta4000 platform, spanning the N149/4.X-5.X, N155/4.X-5.X, N163/5.X-6.X, and the low-wind-optimized N175/6.X platform.
● Envision Energy: Integration of proprietary turbine hardware with the EnOS operating system, paired with captive battery storage manufacturing capabilities. Platform Portfolio: Smart onshore and offshore turbines including the EN-156, EN-171, and EN-182 families (spanning 4.X MW to 8.X MW capacities), alongside deepwater offshore platforms scaling from 10 MW to 16.7+ MW.
● Goldwind: Long-term leadership in permanent magnet direct-drive (PMDD) generator manufacturing, backed by deep domestic market penetration and state utility partnerships. Platform Portfolio: GWHV11 and GWHV12 platforms, medium-speed and PMDD onshore series ranging from 4.X MW to 8.X MW, and utility offshore platforms scaling to the GWH252-16 MW unit.
● Mingyang Smart Energy: Pioneer of compact semi-direct drive (medium-speed hybrid) drivetrains, holding a dominant position in coastal offshore installations subject to typhoon conditions. Platform Portfolio: High-capacity onshore MySE systems from 5.X MW to 10.X MW, alongside offshore and floating platforms including the MySE 11-203, MySE 16-260, MySE 18.5-260, and 20+ MW conceptual designs.
● Sany Renewable Energy: Integrated manufacturing operations with captive in-house production of rotor blades, structural generators, gearboxes, and electrical control systems. Platform Portfolio: High-power onshore units ranging from 4.X MW to 8.X-10 MW (including the SE-17260 and SE-20285 series), 12 MW onshore platforms, and newly introduced 8 MW to 16 MW offshore platforms.
● Shanghai Electric Wind Power Group: Established offshore operating base across East China, supported by strong engineering ties with regional municipal energy developers. Platform Portfolio: Modernized onshore turbines spanning 4 MW to 8 MW+ and offshore direct-drive and geared platforms (Poseidon series) covering 4 MW to 11 MW, 16 MW, and deep-sea prototypes.
● UNISON Co., Ltd.: Long-term domestic wind turbine designer in South Korea with regional balance-of-plant project engineering experience. Platform Portfolio: Low-wind onshore systems and offshore platforms, including the U93 (2.0 MW), U113 (2.3 MW), U136 (4.2/4.4 MW), U151 (4.3 MW), and a dedicated 10 MW offshore marine turbine.
● Doosan Enerbility: Heavy marine engineering, forging, and power plant systems manufacturing base in South Korea. Platform Portfolio: Specialized offshore and onshore generation units, featuring the WinDS3000 (3.0 MW), the DS205-8.0 MW direct-drive marine platform, and early-stage 10 MW+ offshore designs.
●Windey Energy Technology Group: Longstanding wind energy research background in China, maintaining consistent relationships with national power utilities. Platform Portfolio: High-efficiency onshore wind turbine platforms (3.X MW to 10 MW) and offshore models designed for typhoon-prone waters (8.X MW, 10 MW, and 15 MW+ offshore systems).
● Dongfang Electric Wind Power: Industrial base tied to Dongfang Electric Corporation, with access to internal heavy machining, electrical generation, and casting facilities. Platform Portfolio: Geared and direct-drive onshore platforms (3.X MW to 10 MW), alongside large-capacity offshore wind turbines including 10 MW, 13 MW, 18 MW, and ultra-large 26 MW designs.
● ENERCON Global GmbH: Distinctive technological focus on gearless direct-drive systems utilizing electrically excited synchronous generators (EESG), avoiding dependence on permanent magnet rare earths. Platform Portfolio: Gearless onshore turbines, centered around the EP3 platform (E-138 EP3) and the high-output EP5 series (E-160 EP5 and E-175 EP5).
● Suzlon Energy Ltd.: The leading installed base across India, with vertically integrated operations encompassing towers, blades, nacelles, and full lifecycle operations. Platform Portfolio: Tailored low-wind, high-hub-height onshore platforms, primarily the S120 (2.1 MW), S133 (2.6 MW to 3.0 MW), and the S144 (3.0 MW to 3.15 MW) platforms.
● Marmen Inc.: Tier-1 precision machining and contract manufacturer in North America, with heavy fabrication sites in Canada and the United States. Platform Portfolio: Operates as an engineering and contract fabrication partner rather than an independent brand OEM, producing steel towers, internal nacelle baseframes, generator housing shells, and offshore structural components.
●CRRC Wind Power: Backed by CRRC Corporation, leveraging internal electric rail traction, generator winding, and converter manufacturing expertise. Platform Portfolio: Modern onshore and offshore wind systems, spanning 3.X MW to 8.X MW onshore platforms and 10 MW to 16 MW offshore platforms.
● CSSC Haizhuang Windpower: Direct subsidiary of China State Shipbuilding Corporation, leveraging marine structural design, naval architecture, and heavy gearbox manufacturing assets. Platform Portfolio: Onshore geared platforms (3.X MW to 8.X MW) and maritime offshore platforms, including the H171-5.0 MW, H210-10 MW, and H260-18 MW models.
● Guodian United Power Technology: Equipment manufacturing arm of China Energy Investment Corporation (CHN Energy), the world's largest wind farm developer, providing a consistent captive deployment base. Platform Portfolio: Onshore turbines ranging from 1.5 MW to 6.X MW, alongside offshore models in the 6 MW, 8 MW, and 10 MW+ classes.
● Sinovel Wind Group: One of China's earliest multimegawatt wind equipment developers, with a large legacy installed base across early wind project sites. Platform Portfolio: Historically deployed the SL1500 (1.5 MW), SL3000 (3.0 MW), and SL5000/SL6000 (5-6 MW) series across onshore and offshore environments.
● Mitsubishi Heavy Industries (MHI): Heavy power-generation machinery engineering base, with established industrial networks in Japan and across Asia. Platform Portfolio: Historically developed standalone wind platforms (such as the SeaAngel 7 MW), co-founded the MHI Vestas Offshore Wind joint venture, and currently operates MHI Vestas Japan to market, engineer, and support Vestas wind equipment locally.
● Hyosung Heavy Industries: Major Korean manufacturer of industrial electrical power equipment, transformers, switchgear, and rotating machines. Platform Portfolio: Developed utility wind turbine systems (750 kW, 2.0 MW, and 5.5 MW offshore models), alongside acting as a key supplier of wind turbine components including gearboxes, permanent magnet generators, and converters.
● Inox Wind Ltd.: Integrated wind energy solutions provider in India, combining equipment manufacturing with turnkey EPC delivery, project development, and long-term O&M services. Platform Portfolio: Utility-scale onshore platforms manufactured under license, notably the 2 MW platform (DF 93.3, DF 100, and DF 113) and the 3.3 MW platform (with rotor diameters up to 145 meters).
OPPORTUNITIES AND IMPEDIMENTS
● Market Growth Drivers & Strategic Windows
- Data Center Electricity Demand: The global expansion of artificial intelligence compute nodes and enterprise hyperscale data centers has introduced structural changes to baseload electricity demand. Wind power serves as an immediate, utility-scale source of energy, prompting long-term corporate power purchase agreements (PPAs) and dedicated high-voltage interconnections.
- Brownfield Fleet Modernization (Repowering): A growing volume of operational wind turbines across Europe and North America is reaching initial operational design-life limits (20 years or more). Repowering allows operators to replace early 1 MW to 2 MW machines with high-efficiency 4 MW to 6 MW units, utilizing existing real estate, transmission rights-of-way, and operational permits while boosting total energy generation.
- Deepwater Floating Offshore Commercialization: As prime shallow-water seabed locations become saturated, deepwater floating concessions are moving from small demonstrator arrays to multi-hundred-megawatt commercial tenders. This shift unlocks high-velocity, consistent offshore winds across the Pacific Rim, southern Europe, and parts of the Americas.
- Grid-Forming Converter Architectures: The integration of grid-forming (GFM) inverters and advanced battery energy storage systems (BESS) allows modern wind projects to provide synthetic inertia, voltage support, and black-start capabilities, shifting wind plants from intermittent generation into dispatchable power providers.
● Market Challenges & Execution Risks
- Grid Transmission Backlogs & Curtailment: The pace of transmission corridor expansion continues to lag wind project commissioning timelines across North America, Europe, China, and India. Interconnection queue backlogs, regional network congestion, and curtailment issues introduce revenue uncertainty and delay financial close for developers.
- Siting Clearances & Permitting Delays: Lengthy administrative processes, environmental review periods, and right-of-way access approvals remain significant inhibitors to rapid project execution, extending development cycles for new onshore and offshore wind concessions.
- Trade Policy Fragmentation & Protectionism: Escalating tariff structures, non-price auction barriers, Section 232 investigations, and domestic content mandates are fracturing international supply chains. This regionalization limits global component sourcing flexibility and increases project capital expenditures.
- Offshore Balance-of-Plant Vessel Scarcity: The scaling of offshore turbine platforms to 15 MW and beyond has created a shortfall in suitable heavy-lift installation vessels (WTIVs) equipped with adequate crane hook height and deck capacity, introducing maritime execution bottlenecks and escalating charter day-rates.
- Working Capital & Component Cash Flows: Supply-chain lead-time variations and grid synchronization delays can create inventory accumulation and working capital friction across midstream component manufacturers, requiring careful balance-sheet management.
1.1 Wind Turbine Product Scope and Technical Boundaries 1
1.2 Research Methodology, Data Triangulation, and Verification Framework 2
1.3 Primary Data Sources and Industrial Expert Interview Network 3
1.4 Secondary Information Baseline and Bottom-Up Econometric Modeling 4
1.5 Key Analytical Parameters, Currency Conversions, and Base Metrics 5
1.6 Acronyms, Unit Definitions, and Terminology Mapping 6
Chapter 2 Global Wind Turbine Industry Ecosystem and Value Chain Architecture
2.1 End-to-End Wind Turbine Value Chain Topology 7
2.2 Critical Raw Material Sourcing: Rare Earth Elements, Structural Steel, Carbon Fiber, and Resins 8
2.3 Tier-1 Core Subassembly Integration: Blades, Gearboxes, Generators, Main Bearings, and Pitch Systems 9
2.4 Original Equipment Manufacturer (OEM) Assembly and Nacelle Engineering 10
2.5 Balance of Plant (BOP), Foundations, and Tower Manufacturing Dynamics 11
2.6 Levelized Cost of Energy (LCOE) Breakdown and Value Migration Across Turbine Lifecycles 12
2.7 Value Chain Margin Distribution and Profitability Realignment 13
Chapter 3 Global Wind Turbine Manufacturing Footprint and International Logistics
3.1 Geographic Concentration of Primary Nacelle and Component Manufacturing Hubs 14
3.2 Supply Chain Resilience, Local Content Requirements, and Nearshoring Realities 15
3.3 Critical Import and Export Flow Analysis: Europe, Asia-Pacific, and the Americas 16
3.4 Heavy-Lift Maritime Logistics, Vessel Availability, and Overland Transport Constraints 17
3.5 Port Infrastructure Bottlenecks and Specialized Offshore Installation Vessel Capacity 18
3.6 Geopolitical Trade Policies, Tariffs, and Cross-Border Supply Risks 19
3.7 Global Wind Turbine Supply-Demand Equilibrium and Capacity Utilization Rates 20
Chapter 4 Global Wind Turbine Market by Capacity Rating
4.1 Capacity Rating Categorization and Market Dynamics Overview 21
4.2 Onshore Turbine Market Size (USD Million) and Installations (GW/MW), 2021-2031 22
4.2.1 2MW–4MW Onshore Turbines: Volume, Value, and Repowering Demand 23
4.2.2 4MW–8MW Onshore Turbines: Mainstream Utility Adoption and Yield Optimization 24
4.2.3 Above 8MW Onshore Turbines: High-Capacity Architectures and Transport Boundaries 25
4.3 Offshore Turbine Market Size (USD Million) and Installations (GW/MW), 2021-2031 26
4.3.1 8MW–16MW Offshore Turbines: Commercial Fleet Deployment and Scale Economics 27
4.3.2 Above 16MW Offshore Turbines: Next-Generation Platforms and Deepwater Integration 28
4.4 Price-per-Megawatt Progression and Margin Evolution Across Capacity Bands 29
Chapter 5 Global Wind Turbine Market by Drivetrain Architecture
5.1 Drivetrain Architectural Trade-offs: Reliability, Weight, Efficiency, and Capital Cost 30
5.2 Doubly-Fed Induction Generator (DFIG) Systems: Market Volume, Size, and Technological Limits 31
5.3 Direct-Drive Permanent Magnet Synchronous Generator (PMSG) Systems: Market Volume and Size 33
5.4 Semi-Direct Drive Generator (Medium-Speed Hybrid) Systems: Market Volume and Size 35
5.5 Generator Technology Roadmap and Raw Material Sensitivity Analysis 36
Chapter 6 Global Wind Turbine Market by Application
6.1 Application Dynamics and Structural Cost Comparisons 37
6.2 Onshore Wind Turbine Market Installations (GW), Volume (Units), and Revenue (USD Million), 2021-2031 38
6.2.1 Low Wind Speed (Class III) and Complex Terrain Deployments 39
6.2.2 High Wind Speed (Class I & II) Utility Scale Deployments 40
6.3 Offshore Wind Turbine Market Installations (GW), Volume (Units), and Revenue (USD Million), 2021-2031 41
6.3.1 Bottom-Fixed Offshore Installations (Monopile, Jacket, Gravity Base) 42
6.3.2 Floating Offshore Foundations (Spar, Semi-Submersible, Tension Leg Platform) 43
Chapter 7 Global Regional Wind Turbine Market Breakdown and Regional Hubs
7.1 Macro-Regional Supply and Demand Baseline Overview 44
7.2 Asia-Pacific Wind Turbine Market Analysis 45
7.2.1 China: Manufacturing Dominance, Grid Parity, and Ultra-Large Platform Rollout 46
7.2.2 India: Accelerated Tendering, Domestic Manufacturing Hubs, and Class III Onshore Expansion 47
7.2.3 Japan: Offshore Concession Rounds, Deepwater Site Conditions, and Grid Infrastructure 48
7.2.4 South Korea: Offshore Supply Base Industrialization and Renewable Portfolio Standards 49
7.2.5 Australia: Coal-Fired Retirement Replacement, Renewable Energy Zones, and Transmission Buildout 50
7.3 Europe Wind Turbine Market Analysis 51
7.3.1 Germany: Onshore Land Permitting Acceleration, Repowering, and North Sea Offshore Targets 52
7.3.2 Denmark: Offshore Engineering Excellence, Technology Export Hub, and System Flexibility 53
7.3.3 Spain: High-Penetration Onshore Asset Optimization and Fleet Modernization 54
7.3.4 United Kingdom: Contracts for Difference (CfD) Mechanics, Deepwater Offshore, and Grid Bottlenecks 55
7.3.5 Netherlands: Offshore Cluster Integration, Hydrogen Linkage, and Zero-Subsidy Tenders 56
7.3.6 France: Multi-Year Energy Plan (PPE) Allocations and Floating Offshore Pilot Commercialization 57
7.4 North America Wind Turbine Market Analysis 58
7.4.1 United States: Inflation Reduction Act (IRA) Domestic Content Subsidies and Interconnection Queues 59
7.4.2 Canada: Provincial Grid Decarbonization and Large-Scale Prairie Wind Deployments 60
7.5 Latin America Wind Turbine Market Analysis 61
7.5.1 Brazil: Free Market PPAs, Northeast Corridor Resource Exploitation, and Component Exporting 62
7.5.2 Chile: Atacama Wind Corridor Expansion and Renewable Mining Offtake Pacts 63
7.6 Middle East and Africa Wind Turbine Market Analysis 64
7.6.1 South Africa: Renewable Independent Power Producer Programme (REIPPPP) Integration 65
7.6.2 Egypt: Gulf of Suez Megawatt Additions and Green Ammonia Feedstock Infrastructure 66
7.6.3 Saudi Arabia: National Renewable Energy Program (NREP) and Utility-Scale Clean Hydrogen Projects 67
Chapter 8 Technology Roadmap, LCOE Dynamics, and Intellectual Property
8.1 Aerodynamic Rotor Blade Advancements: Modular Blades, Carbon Pultrusion, and Tip Extensions 68
8.2 Next-Generation Tower Structures: Hybrid Concrete-Steel, Lattice, and Self-Erecting Towers 69
8.3 Advanced Condition Monitoring, Predictive Maintenance, and Edge AI Wind Farm Management 70
8.4 Global Patent Landscape Analysis: Key Technology Clusters, Filings, and Intellectual Property Disputes 71
Chapter 9 Competitive Benchmark, Tiering, and Market Concentration
9.1 Global OEM Tiering Architecture and Revenue Concentration Ratios (CR4, CR8, HHI) 72
9.2 Price War Dynamics, Inflation Transmission, and Backlog Profitability Assessment 73
9.3 Product Portfolio Benchmarking: Specific Power, Rotor Diameter, and Nameplate Ratings 74
Chapter 10 Corporate Intelligence: Global Wind Turbine Manufacturers
10.1 Vestas 75
10.1.1 Corporate Profile and Operational Footprint 75
10.1.2 Product Architecture and Technical Differentiation 76
10.1.3 Strategic SWOT Analysis 76
10.1.4 Operational Metrics: Sales Volume, Price, Cost, Gross Margin, and Market Share 77
10.1.5 R&D Allocation and Global Go-To-Market Execution 78
10.2 Siemens Gamesa 79
10.2.1 Corporate Profile and Operational Footprint 79
10.2.2 Product Architecture and Quality Remediations 80
10.2.3 Strategic SWOT Analysis 80
10.2.4 Operational Metrics: Sales Volume, Price, Cost, Gross Margin, and Market Share 81
10.2.5 Fleet Modernization and Offshore Production Scaling 82
10.3 GE Vernova 83
10.3.1 Corporate Profile and Operational Footprint 83
10.3.2 Product Architecture and Haliade-X Platform Strategy 84
10.3.3 Strategic SWOT Analysis 84
10.3.4 Operational Metrics: Sales Volume, Price, Cost, Gross Margin, and Market Share 85
10.3.5 Workhorse Platform Focus and Supply Rationalization 86
10.4 Goldwind 87
10.4.1 Corporate Profile and Operational Footprint 87
10.4.2 Medium-Speed PMSG Product Architecture and Industrial Scale 88
10.4.3 Strategic SWOT Analysis 88
10.4.4 Operational Metrics: Sales Volume, Price, Cost, Gross Margin, and Market Share 89
10.4.5 International Market Penetration and Green Power Strategy 90
10.5 Envision Energy 91
10.5.1 Corporate Profile and Operational Footprint 91
10.5.2 Smart Wind Turbine Innovations and Drivetrain Design 92
10.5.3 Strategic SWOT Analysis 92
10.5.4 Operational Metrics: Sales Volume, Price, Cost, Gross Margin, and Market Share 93
10.5.5 Net-Zero Industrial Parks and Global Expansion 94
10.6 Mingyang Smart Energy 95
10.6.1 Corporate Profile and Operational Footprint 95
10.6.2 Hybrid Drivetrain Innovations and Ultra-Large Offshore Platforms 96
10.6.3 Strategic SWOT Analysis 96
10.6.4 Operational Metrics: Sales Volume, Price, Cost, Gross Margin, and Market Share 97
10.6.5 Deepwater Floating Deployments and Hydrogen Synergies 98
10.7 Nordex 99
10.7.1 Corporate Profile and Operational Footprint 99
10.7.2 Delta4000 Platform Architecture and European Footprint 100
10.7.3 Strategic SWOT Analysis 100
10.7.4 Operational Metrics: Sales Volume, Price, Cost, Gross Margin, and Market Share 101
10.7.5 Margin Recovery Strategy and Global Order Intake 102
10.8 Sany Renewable Energy 103
10.8.1 Corporate Profile and Operational Footprint 103
10.8.2 Vertically Integrated Manufacturing and Smart Nacelle Assemblies 104
10.8.3 Strategic SWOT Analysis 104
10.8.4 Operational Metrics: Sales Volume, Price, Cost, Gross Margin, and Market Share 105
10.8.5 Cost Leadership and International Market Expansion 106
10.9 Windey Energy Technology 107
10.9.1 Corporate Profile and Operational Footprint 107
10.9.2 Onshore and Offshore High-Yield Turbine Portfolio 108
10.9.3 Strategic SWOT Analysis 108
10.9.4 Operational Metrics: Sales Volume, Price, Cost, Gross Margin, and Market Share 109
10.9.5 Integrated Renewable Systems and Export Strategy 110
10.10 Shanghai Electric 111
10.10.1 Corporate Profile and Operational Footprint 111
10.10.2 Offshore Industrial Engineering and Turbine Licensing Synergy 112
10.10.3 Strategic SWOT Analysis 112
10.10.4 Operational Metrics: Sales Volume, Price, Cost, Gross Margin, and Market Share 113
10.10.5 Offshore Maintenance Fleet and Grid Systems 114
10.11 Dongfang Electric Wind Power 115
10.11.1 Corporate Profile and Operational Footprint 115
10.11.2 Heavy Industrial Scale and Direct-Drive Platforms 116
10.11.3 Strategic SWOT Analysis 116
10.11.4 Operational Metrics: Sales Volume, Price, Cost, Gross Margin, and Market Share 117
10.11.5 Regional State Utility Partnerships and R&D Execution 118
10.12 CRRC Wind Power 119
10.12.1 Corporate Profile and Operational Footprint 119
10.12.2 High-Speed Rail Tech Transfer to Nacelle/Generator Systems 120
10.12.3 Strategic SWOT Analysis 120
10.12.4 Operational Metrics: Sales Volume, Price, Cost, Gross Margin, and Market Share 121
10.12.5 Integrated Drivetrain Sourcing and Domestic Scale 122
10.13 CSSC Haizhuang Windpower 123
10.13.1 Corporate Profile and Operational Footprint 123
10.13.2 Marine Engineering Heritage and Giant Offshore Turbines 124
10.13.3 Strategic SWOT Analysis 124
10.13.4 Operational Metrics: Sales Volume, Price, Cost, Gross Margin, and Market Share 125
10.13.5 Maritime Fleet Integration and Offshore R&D 126
10.14 Guodian United Power Technology 127
10.14.1 Corporate Profile and Operational Footprint 127
10.14.2 Captive Power Group Integration and Low-Speed Platforms 128
10.14.3 Strategic SWOT Analysis 128
10.14.4 Operational Metrics: Sales Volume, Price, Cost, Gross Margin, and Market Share 129
10.14.5 Digital Wind Farm Solutions and Fleet Retrofitting 130
10.15 ENERCON Global GmbH 131
10.15.1 Corporate Profile and Operational Footprint 131
10.15.2 Gearless Direct-Drive PMSG Innovation and Grid Friendly Control 132
10.15.3 Strategic SWOT Analysis 132
10.15.4 Operational Metrics: Sales Volume, Price, Cost, Gross Margin, and Market Share 133
10.15.5 Core European Market Positioning and Turnaround Strategy 134
10.16 Suzlon Energy Ltd 135
10.16.1 Corporate Profile and Operational Footprint 135
10.16.2 S144 and High-Hub Platform for Low Wind Regimes 136
10.16.3 Strategic SWOT Analysis 136
10.16.4 Operational Metrics: Sales Volume, Price, Cost, Gross Margin, and Market Share 137
10.16.5 Indian Market Dominance and Balance Sheet Deleveraging 138
10.17 Inox Wind Ltd 139
10.17.1 Corporate Profile and Operational Footprint 139
10.17.2 DFIG-Based Turbine Portfolio and Turnkey Project Capabilities 140
10.17.3 Strategic SWOT Analysis 140
10.17.4 Operational Metrics: Sales Volume, Price, Cost, Gross Margin, and Market Share 141
10.17.5 Manufacturing Modernization and Order Pipeline Growth 142
10.18 Doosan Enerbility 143
10.18.1 Corporate Profile and Operational Footprint 143
10.18.2 South Korean Offshore Turbines and Heavy Power Equipment 144
10.18.3 Strategic SWOT Analysis 144
10.18.4 Operational Metrics: Sales Volume, Price, Cost, Gross Margin, and Market Share 145
10.18.5 Offshore Consortiums and Floating Wind Engineering 146
10.19 UNISON 147
10.19.1 Corporate Profile and Operational Footprint 147
10.19.2 Direct-Drive and Geared Wind Systems Engineering 148
10.19.3 Strategic SWOT Analysis 148
10.19.4 Operational Metrics: Sales Volume, Price, Cost, Gross Margin, and Market Share 149
10.19.5 Domestic Market Strategy and Regional Offtake 150
10.20 Hyosung Heavy Industries 151
10.20.1 Corporate Profile and Operational Footprint 151
10.20.2 Offshore Drivetrain Partnerships and Transmission Integration 152
10.20.3 Strategic SWOT Analysis 152
10.20.4 Operational Metrics: Sales Volume, Price, Cost, Gross Margin, and Market Share 153
10.20.5 Industrial Electrification and Heavy Electrical Systems 154
10.21 Mitsubishi Heavy Industries (MHI) 155
10.21.1 Corporate Profile and Operational Footprint 155
10.21.2 Power Systems Engineering and Marine Propulsion Heritage 155
10.21.3 Strategic SWOT Analysis 155
10.21.4 Operational Metrics: Sales Volume, Price, Cost, Gross Margin, and Market Share 156
10.21.5 Strategic Offshore Technology Licensing and Hydrogen Turbines 156
10.22 Marmen 157
10.22.1 Corporate Profile and Heavy Fabrications Footprint 157
10.22.2 Specialized Wind Tower, Nacelle, and Subassembly Manufacturing 157
10.22.3 Strategic SWOT Analysis 157
10.22.4 Operational Metrics: Fabrication Volume, Price, Cost, Margin, and Market Share 158
10.22.5 North American Supply Partnerships and Port Facility Buildouts 158
10.23 Sinovel Wind Group 159
10.23.1 Corporate Profile and Restructuring Operations 159
10.23.2 Legacy Platforms and Asset Service Management 159
10.23.3 Strategic SWOT Analysis 159
10.23.4 Operational Metrics: Sales Volume, Price, Cost, Gross Margin, and Market Share 160
10.23.5 Maintenance Contracts and Regional Modernization 160
Table 2 End-to-End Wind Turbine Value Chain Cost Breakdown by Subsystem (2021-2026) 8
Table 3 Raw Material Consumption Intensity per MW by Turbine Component (2026) 9
Table 4 Global Nacelle Production Capacity by Major Manufacturing Country (GW), 2021-2026 14
Table 5 Wind Turbine Blade and Gearbox Trade Flow Matrix: Major Exporting vs Importing Hubs (2026) 16
Table 6 Global Wind Turbine Market by Capacity Rating: Total Revenue (USD Million), 2021-2031 21
Table 7 Global Wind Turbine Market by Capacity Rating: Total Installations (GW), 2021-2031 22
Table 8 Onshore Wind Turbine Market Installations (GW) by Capacity Segment, 2021-2031 23
Table 9 Offshore Wind Turbine Market Installations (GW) by Capacity Segment, 2021-2031 27
Table 10 Global Wind Turbine Average Selling Price (ASP per MW) by Capacity Band (2021-2026) 29
Table 11 Global Wind Turbine Market Size by Drivetrain Architecture (USD Million), 2021-2031 30
Table 12 Global Wind Turbine Installations by Drivetrain Architecture (GW), 2021-2031 31
Table 13 Doubly-Fed Induction Generator (DFIG) Market Size by Region (USD Million), 2021-2031 32
Table 14 Direct-Drive PMSG Market Size by Region (USD Million), 2021-2031 34
Table 15 Semi-Direct Drive Generator Market Size by Region (USD Million), 2021-2031 35
Table 16 Global Wind Turbine Market Size by Application (USD Million), 2021-2031 37
Table 17 Global Wind Turbine Installations by Application (GW), 2021-2031 38
Table 18 Onshore Wind Turbine Market Revenue by Region (USD Million), 2021-2031 39
Table 19 Offshore Wind Turbine Market Revenue by Region (USD Million), 2021-2031 41
Table 20 Bottom-Fixed vs Floating Offshore Installations Breakdown (GW), 2021-2031 43
Table 21 Global Wind Turbine Regional Market Overview: Revenue (USD Million), 2021-2031 44
Table 22 Asia-Pacific Wind Turbine Market Size by Country (USD Million), 2021-2031 45
Table 23 China Wind Turbine Installations (GW) and Revenue (USD Million) by Segment, 2021-2031 46
Table 24 India Wind Turbine Installations (GW) and Revenue (USD Million) by Segment, 2021-2031 47
Table 25 Japan Wind Turbine Installations (GW) and Revenue (USD Million), 2021-2031 48
Table 26 South Korea Wind Turbine Installations (GW) and Revenue (USD Million), 2021-2031 49
Table 27 Australia Wind Turbine Installations (GW) and Revenue (USD Million), 2021-2031 50
Table 28 Europe Wind Turbine Market Size by Country (USD Million), 2021-2031 51
Table 29 Germany Wind Turbine Installations (GW) and Revenue (USD Million), 2021-2031 52
Table 30 Denmark Wind Turbine Installations (GW) and Revenue (USD Million), 2021-2031 53
Table 31 Spain Wind Turbine Installations (GW) and Revenue (USD Million), 2021-2031 54
Table 32 United Kingdom Wind Turbine Installations (GW) and Revenue (USD Million), 2021-2031 55
Table 33 Netherlands Wind Turbine Installations (GW) and Revenue (USD Million), 2021-2031 56
Table 34 France Wind Turbine Installations (GW) and Revenue (USD Million), 2021-2031 57
Table 35 North America Wind Turbine Market Size by Country (USD Million), 2021-2031 58
Table 36 United States Wind Turbine Installations (GW) and Revenue (USD Million), 2021-2031 59
Table 37 Canada Wind Turbine Installations (GW) and Revenue (USD Million), 2021-2031 60
Table 38 Latin America Wind Turbine Market Size by Country (USD Million), 2021-2031 61
Table 39 Brazil Wind Turbine Installations (GW) and Revenue (USD Million), 2021-2031 62
Table 40 Chile Wind Turbine Installations (GW) and Revenue (USD Million), 2021-2031 63
Table 41 Middle East and Africa Wind Turbine Market Size by Country (USD Million), 2021-2031 64
Table 42 South Africa Wind Turbine Installations (GW) and Revenue (USD Million), 2021-2031 65
Table 43 Egypt Wind Turbine Installations (GW) and Revenue (USD Million), 2021-2031 66
Table 44 Saudi Arabia Wind Turbine Installations (GW) and Revenue (USD Million), 2021-2031 67
Table 45 LCOE Benchmarks by Turbine Class and Geographical Terrain (USD/MWh), 2021-2026 69
Table 46 Global Wind Turbine OEM Market Concentration Metrics (CR4, CR8, HHI), 2021-2026 72
Table 47 Global Wind Turbine OEM Fleet Specifications and Nameplate Comparison (2026) 74
Table 48 Vestas Wind Turbine Sales, Price, Cost and Gross Profit Margin (2021-2026) 77
Table 49 Siemens Gamesa Wind Turbine Sales, Price, Cost and Gross Profit Margin (2021-2026) 81
Table 50 GE Vernova Wind Turbine Sales, Price, Cost and Gross Profit Margin (2021-2026) 85
Table 51 Goldwind Wind Turbine Sales, Price, Cost and Gross Profit Margin (2021-2026) 89
Table 52 Envision Energy Wind Turbine Sales, Price, Cost and Gross Profit Margin (2021-2026) 93
Table 53 Mingyang Smart Energy Wind Turbine Sales, Price, Cost and Gross Profit Margin (2021-2026) 97
Table 54 Nordex Wind Turbine Sales, Price, Cost and Gross Profit Margin (2021-2026) 101
Table 55 Sany Renewable Energy Wind Turbine Sales, Price, Cost and Gross Profit Margin (2021-2026) 105
Table 56 Windey Energy Technology Wind Turbine Sales, Price, Cost and Gross Profit Margin (2021-2026) 109
Table 57 Shanghai Electric Wind Turbine Sales, Price, Cost and Gross Profit Margin (2021-2026) 113
Table 58 Dongfang Electric Wind Power Wind Turbine Sales, Price, Cost and Gross Profit Margin (2021-2026) 117
Table 59 CRRC Wind Power Wind Turbine Sales, Price, Cost and Gross Profit Margin (2021-2026) 121
Table 60 CSSC Haizhuang Windpower Wind Turbine Sales, Price, Cost and Gross Profit Margin (2021-2026) 125
Table 61 Guodian United Power Technology Wind Turbine Sales, Price, Cost and Gross Profit Margin (2021-2026) 129
Table 62 ENERCON Global GmbH Wind Turbine Sales, Price, Cost and Gross Profit Margin (2021-2026) 133
Table 63 Suzlon Energy Ltd Wind Turbine Sales, Price, Cost and Gross Profit Margin (2021-2026) 137
Table 64 Inox Wind Ltd Wind Turbine Sales, Price, Cost and Gross Profit Margin (2021-2026) 141
Table 65 Doosan Enerbility Wind Turbine Sales, Price, Cost and Gross Profit Margin (2021-2026) 145
Table 66 UNISON Wind Turbine Sales, Price, Cost and Gross Profit Margin (2021-2026) 149
Table 67 Hyosung Heavy Industries Wind Turbine Sales, Price, Cost and Gross Profit Margin (2021-2026) 153
Table 68 Mitsubishi Heavy Industries (MHI) Wind Turbine Sales, Price, Cost and Gross Profit Margin (2021-2026) 156
Table 69 Marmen Wind Turbine Structures Fabrication, Price, Cost and Gross Profit Margin (2021-2026) 158
Table 70 Sinovel Wind Group Wind Turbine Sales, Price, Cost and Gross Profit Margin (2021-2026) 160
Figure 1 Global Wind Turbine Market Size (USD Million) and Growth Trajectory, 2021-2031 6
Figure 2 Wind Turbine End-to-End Value Chain Map and Sourcing Nodes 7
Figure 3 Nacelle Component Weight and Cost Breakdown Comparison 10
Figure 4 Global Heavy Installation Vessel Fleet vs Offshore Demand Projections 18
Figure 5 Global Wind Turbine Supply-Demand Gap and Utilization Curve, 2021-2031 20
Figure 6 Onshore Wind Turbine Installation Distribution by Capacity Band (2021, 2026, 2031) 22
Figure 7 Offshore Wind Turbine Average Nameplate Capacity Evolution (MW), 2021-2031 26
Figure 8 Wind Turbine Average Selling Price Trends by Key Geography (USD/kW), 2021-2026 29
Figure 9 Drivetrain Architecture Market Share Shift (DFIG vs PMSG vs Semi-Direct), 2021-2031 31
Figure 10 Onshore vs Offshore Wind Turbine Installation Split (GW), 2021-2031 38
Figure 11 Floating Offshore Wind Installation Curve and Commercialization Horizon, 2024-2031 43
Figure 12 Global Wind Turbine Installations Share by Macro-Region (2026) 44
Figure 13 China Wind Turbine Annual Capacity Additions and Grid Curtailment Rates (2021-2026) 46
Figure 14 Europe Offshore Wind Pipeline vs Port Marshalling Capacity (2026-2031) 51
Figure 15 United States Wind Turbine Annual Additions by IRA Content Eligibility 59
Figure 16 Rotor Diameter vs Tower Hub Height Progression Curves (2015-2031) 68
Figure 17 Wind Turbine Annual Global Patent Filings by Subsystem Technology Cluster (2018-2026) 71
Figure 18 Global Wind Turbine OEM Top-10 Market Share Distribution (2026) 73
Figure 19 Vestas Wind Turbine Market Share (2021-2026) 77
Figure 20 Siemens Gamesa Wind Turbine Market Share (2021-2026) 81
Figure 21 GE Vernova Wind Turbine Market Share (2021-2026) 85
Figure 22 Goldwind Wind Turbine Market Share (2021-2026) 89
Figure 23 Envision Energy Wind Turbine Market Share (2021-2026) 93
Figure 24 Mingyang Smart Energy Wind Turbine Market Share (2021-2026) 97
Figure 25 Nordex Wind Turbine Market Share (2021-2026) 101
Figure 26 Sany Renewable Energy Wind Turbine Market Share (2021-2026) 105
Figure 27 Windey Energy Technology Wind Turbine Market Share (2021-2026) 109
Figure 28 Shanghai Electric Wind Turbine Market Share (2021-2026) 113
Figure 29 Dongfang Electric Wind Power Wind Turbine Market Share (2021-2026) 117
Figure 30 CRRC Wind Power Wind Turbine Market Share (2021-2026) 121
Figure 31 CSSC Haizhuang Windpower Wind Turbine Market Share (2021-2026) 125
Figure 32 Guodian United Power Technology Wind Turbine Market Share (2021-2026) 129
Figure 33 ENERCON Global GmbH Wind Turbine Market Share (2021-2026) 133
Figure 34 Suzlon Energy Ltd Wind Turbine Market Share (2021-2026) 137
Figure 35 Inox Wind Ltd Wind Turbine Market Share (2021-2026) 141
Figure 36 Doosan Enerbility Wind Turbine Market Share (2021-2026) 145
Figure 37 UNISON Wind Turbine Market Share (2021-2026) 149
Figure 38 Hyosung Heavy Industries Wind Turbine Market Share (2021-2026) 153
Figure 39 Mitsubishi Heavy Industries (MHI) Wind Turbine Market Share (2021-2026) 156
Figure 40 Marmen Wind Turbine Structures Fabrication Market Share (2021-2026) 158
Figure 41 Sinovel Wind Group Wind Turbine Market Share (2021-2026) 160
Research Methodology
- Market Estimated Methodology:
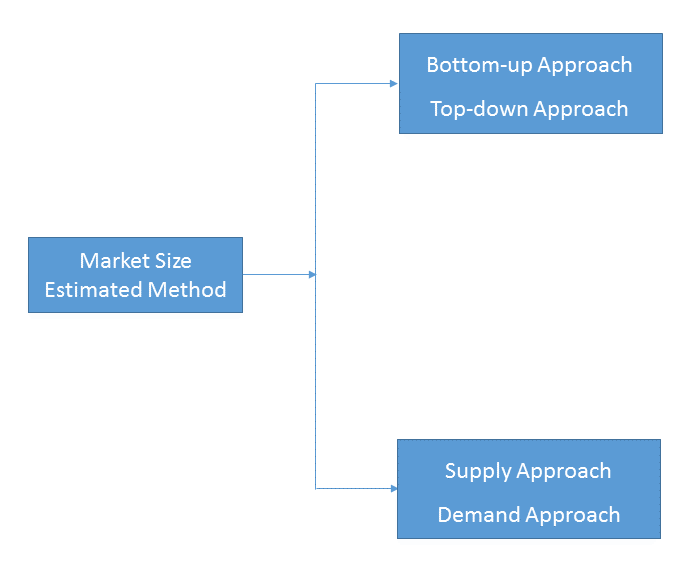
Bottom-up & top-down approach, supply & demand approach are the most important method which is used by HDIN Research to estimate the market size.
1)Top-down & Bottom-up Approach
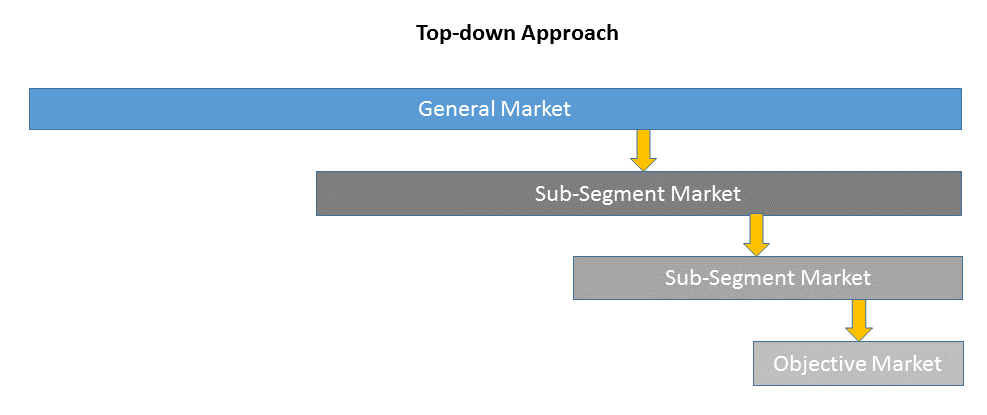
Top-down approach uses a general market size figure and determines the percentage that the objective market represents.
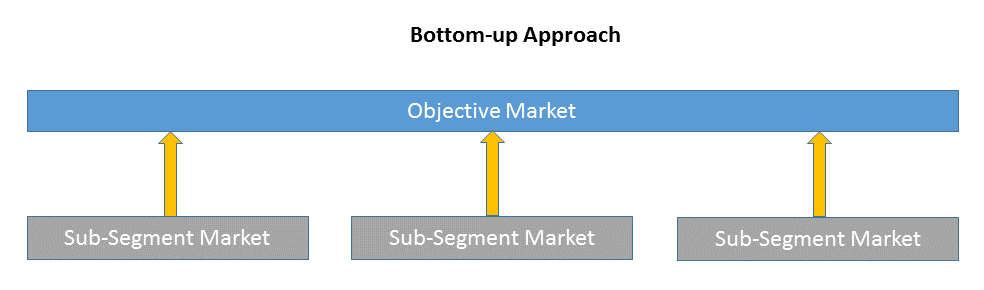
Bottom-up approach size the objective market by collecting the sub-segment information.
2)Supply & Demand Approach
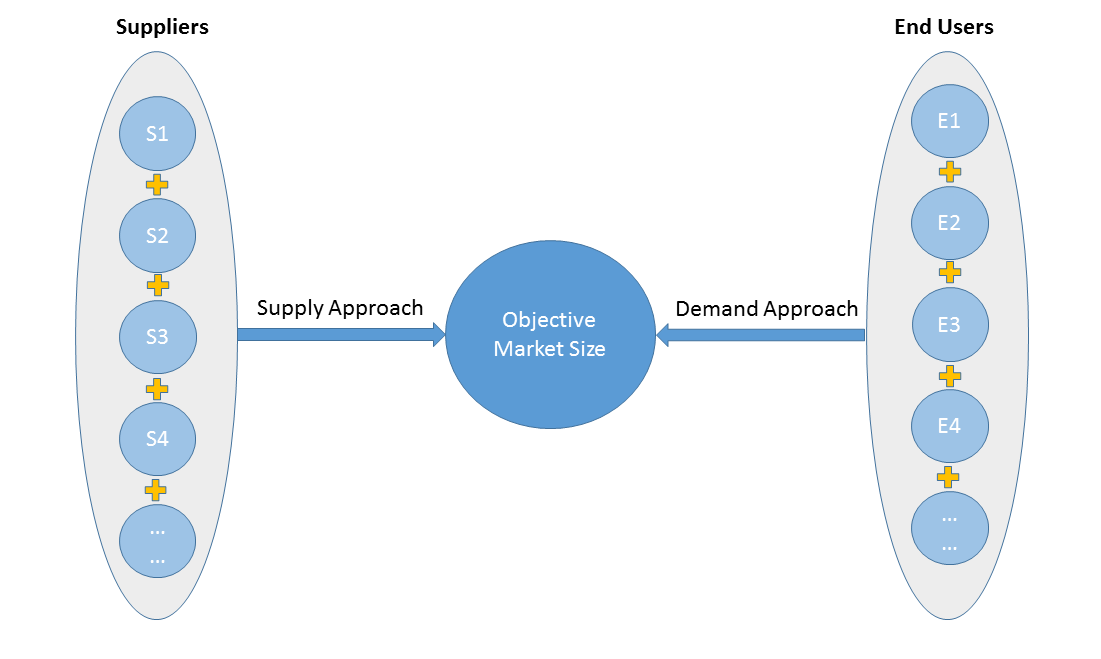
Supply approach is based on assessments of the size of each competitor supplying the objective market.
Demand approach combine end-user data within a market to estimate the objective market size. It is sometimes referred to as bottom-up approach.
- Forecasting Methodology
- Numerous factors impacting the market trend are considered for forecast model:
- New technology and application in the future;
- New project planned/under contraction;
- Global and regional underlying economic growth;
- Threatens of substitute products;
- Industry expert opinion;
- Policy and Society implication.
- Analysis Tools
1)PEST Analysis
PEST Analysis is a simple and widely used tool that helps our client analyze the Political, Economic, Socio-Cultural, and Technological changes in their business environment.
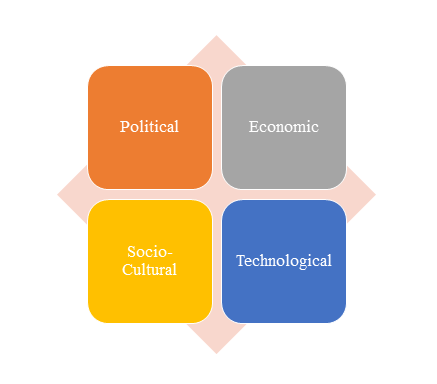
- Benefits of a PEST analysis:
- It helps you to spot business opportunities, and it gives you advanced warning of significant threats.
- It reveals the direction of change within your business environment. This helps you shape what you’re doing, so that you work with change, rather than against it.
- It helps you avoid starting projects that are likely to fail, for reasons beyond your control.
- It can help you break free of unconscious assumptions when you enter a new country, region, or market; because it helps you develop an objective view of this new environment.
2)Porter’s Five Force Model Analysis
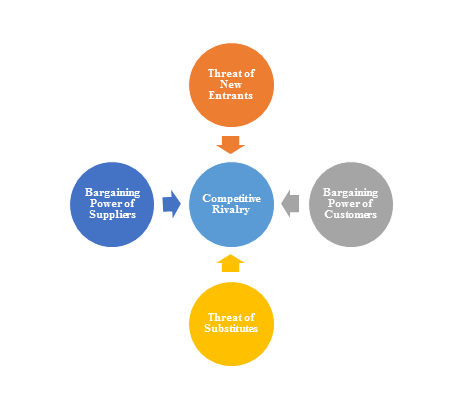
The Porter’s Five Force Model is a tool that can be used to analyze the opportunities and overall competitive advantage. The five forces that can assist in determining the competitive intensity and potential attractiveness within a specific area.
- Threat of New Entrants: Profitable industries that yield high returns will attract new firms.
- Threat of Substitutes: A substitute product uses a different technology to try to solve the same economic need.
- Bargaining Power of Customers: the ability of customers to put the firm under pressure, which also affects the customer's sensitivity to price changes.
- Bargaining Power of Suppliers: Suppliers of raw materials, components, labor, and services (such as expertise) to the firm can be a source of power over the firm when there are few substitutes.
- Competitive Rivalry: For most industries the intensity of competitive rivalry is the major determinant of the competitiveness of the industry.
3)Value Chain Analysis
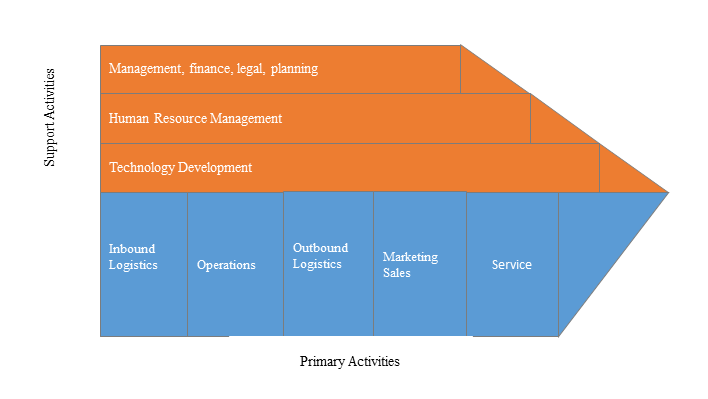
Value chain analysis is a tool to identify activities, within and around the firm and relating these activities to an assessment of competitive strength. Value chain can be analyzed by primary activities and supportive activities. Primary activities include: inbound logistics, operations, outbound logistics, marketing & sales, service. Support activities include: technology development, human resource management, management, finance, legal, planning.
4)SWOT Analysis
SWOT analysis is a tool used to evaluate a company's competitive position by identifying its strengths, weaknesses, opportunities and threats. The strengths and weakness is the inner factor; the opportunities and threats are the external factor. By analyzing the inner and external factors, the analysis can provide the detail information of the position of a player and the characteristics of the industry.
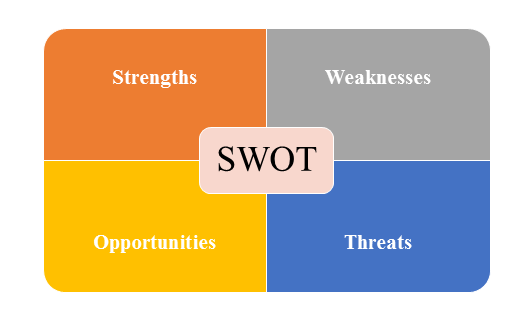
- Strengths describe what the player excels at and separates it from the competition
- Weaknesses stop the player from performing at its optimum level.
- Opportunities refer to favorable external factors that the player can use to give it a competitive advantage.
- Threats refer to factors that have the potential to harm the player.
- Data Sources
| Primary Sources | Secondary Sources |
|---|---|
| Face to face/Phone Interviews with market participants, such as: Manufactures; Distributors; End-users; Experts. Online Survey |
Government/International Organization Data: Annual Report/Presentation/Fact Book Internet Source Information Industry Association Data Free/Purchased Database Market Research Report Book/Journal/News |