Offshore Wind Substructures and Foundations Market Report 2021-2031
- Single User License (1 Users) $ 3,500
- Team License (2~5 Users) $ 4,500
- Corporate License (>5 Users) $ 5,500
The global offshore wind substructures and foundations market size is valued between 3.6 billion USD and 4.6 billion USD in 2026, with a compound annual growth rate within the range of 9% to 14% through 2031. The underlying growth driver is a structural supply-demand imbalance precipitated by turbine generational leaps. The engineering transition from 8-12 MW machines to 15-25 MW platforms requires structural unit weights to escalate from 1,000 tonnes to beyond 2,500 to 3,000 tonnes. Furthermore, nearshore site exhaustion is driving project pipelines beyond 30 to 50 meters of water depth, necessitating capital-intensive transitions from conventional monopiles to complex space-frame jackets and industrialized floating foundation topologies. Geographic activity of global offshore wind market is anchored across high-yield maritime corridors in the North Sea, the Baltic Basin, the Taiwan Strait, the East China Sea, and emerging commercial clusters across the coastal waters of South Korea, Japan, and the United States Eastern Seaboard. Market execution is concentrated among elite heavy steel fabrication conglomerates with direct maritime access, including Dajin Heavy Industry, Sif Group, EEW Group, SK Oceanplant, CS Wind, Haizea Wind Group, Steelwind Nordenham, SeAH Wind, Navantia Seanergies, and Haili Wind Power.
PRODUCT CLASSIFICATION AND DETAILED MARKET DYNAMICS
● Fixed Foundations
Fixed foundations encompass rigid, bottom-seated structural steel configurations physically driven, drilled, or suction-anchored directly into the ocean floor. These units serve as the baseline foundation technology across shallow and intermediate continental shelf zones.
1. Monopiles
Technical Definition: Monopiles represent single-column, large-diameter, thick-walled cylindrical steel structures fabricated through the numerical bending, rolling, and automated submerged arc welding of heavy structural steel plate segments. Typically driven into marine sediments using high-energy hydraulic impact hammers or drilled in rock-dominant strata, monopiles are the foundational backbone of commercial offshore wind. Next-generation XXL and XXXL monopiles designed for 15 MW to 25 MW turbines require outer diameters between 10 and 16 meters, wall thicknesses exceeding 100 to 150 millimeters, and individual unit weights ranging from 2,000 to over 3,000 tonnes.
Market Dynamics: Heavy investment cycles characterize this segment. The structural weight of these components challenges traditional port quaysides and marine installation crane capacities. Producers with ultra-heavy rolling equipment, such as Dajin Heavy Industry at its Caofeidian and Penglai yards, are expanding capacity to process 16-meter diameter sections. Similarly, European incumbents such as Sif Group and EEW Group have committed significant capital expenditures to upgrade quayside handling infrastructure at Maasvlakte 2 and Rostock. In South Korea, GS Entec converted its Yongjam industrial yard in Ulsan through a 211.06 million USD investment to manufacture large-scale monopiles under long-term European technology transfer frameworks. Concurrently, fabricators like Haili Wind Power and TSP Wind Power Group have certified fabrication capabilities for monopile designs scaling between 1,600 and 2,300 tonnes to fulfill domestic demand.
2. Jackets
Technical Definition: A jacket foundation is a three-legged or four-legged space-frame lattice truss structure manufactured from high-yield structural steel tubular sections, secured to the seabed via underwater steel pin piles driven through bottom sleeve guides or anchored via suction buckets. Jackets offer high structural rigidity, superior mass-to-stiffness performance, and significantly reduced hydrodynamic surface area under high-wave-action environments relative to monopiles. This makes them the primary structural choice for intermediate and deep continental shelf installations between 30 and 70 meters of depth.
Market Dynamics: The fabrication of jackets requires thousands of hours of complex manual and semi-automated spatial node welding, non-destructive volumetric testing, and high-precision dimensional control. Key yards in the Asia-Pacific region have emerged as major export centers. SK Oceanplant operates as a primary supplier in East Asia, delivering complex four-legged jackets for high-seismic and typhoon-prone zones across the Taiwan Strait, such as the Fengmiao wind project, with industrial output exceeding 50 complete units annually. Chinese fabricators, including Haili Wind Power, delivered 65 jacket sets in 2025 alone, pushing design parameters toward 16.6 MW turbine support jackets and 10,000-tonne-class high-voltage converter station jackets.
3. Transition Pieces
Technical Definition: Transition pieces are engineered structural intermediate modules positioned over the top of a driven monopile or integrated into the crown of a jacket substructure. They provide the mechanical connection interface to the lowest flange of the wind turbine tower. Transition pieces integrate external secondary steel platforms, personnel access landings, boat fenders, sacrificial internal/external cathodic protection anodes, subsea array cable entry J-tubes, and electrical switchgear assemblies. Beyond secondary interfaces, transition pieces function to absorb verticality tolerances and driving misalignments resulting from offshore piling operations.
Market Dynamics: The market is bifurcating between traditional bolted or grouted two-piece monopile-transition piece assemblies and single-piece extended monopiles. In the latter, the transition piece functionality is rolled and welded directly into the upper tubular section of the primary monopile, a technique led by Steelwind Nordenham to eliminate offshore grouting risks. Nevertheless, separate transition pieces remain favored in markets with limited installation vessel crane reach, as splitting the lift weight reduces vessel hoist limitations. CS Wind, through its integration of Bladt Industries, and Navantia-Windar maintain dedicated transition piece lines serving both bundled foundation contracts and independent EPC equipment lots.
4. Auxiliary Fixed Substructures and Substation Platforms
Technical Definition: This segment covers critical auxiliary structural assemblies, such as high-voltage alternating current and direct current offshore substation topside jackets, converter platforms, and integrated marine installation guidance cages. Offshore substations house utility-scale electrical step-up transformers, gas-insulated switchgear, and converter valves, requiring multi-legged jacket substructures engineered to support topside operating weights between 4,000 and 20,000 tonnes over continuous 30-year design lifespans.
Market Dynamics: Driven by the expansion of distant offshore zones requiring high-voltage direct current grid transmission, demand for massive converter station jackets has risen sharply. Fabricators like Rainbow Offshore, Larsen and Toubro, and HD Hyundai Heavy Industries leverage offshore oil and gas engineering experience to build these high-specification structures. Simultaneously, companies such as Haili Wind Power have developed negative-pressure bucket-type piling stabilization frames and modular integrated installation cages to mitigate offshore installation risks.
● Floating Foundations
Technical Definition: Floating foundations comprise hydrodynamic, buoyant steel or hybrid concrete structural platforms moored to the continental shelf or deep seabed via catenary, semi-taut, or taut tensioned tendon lines coupled to drag-embedment, suction, or driven anchor arrays. Floating architectures deploy in deep marine zones, typically beyond 50 to 80 meters, where rigid bottom-fixed substructures become commercially or structurally unfeasible. Structural configurations include semi-submersible column-stabilized platforms, spar buoys, tension-leg platforms, and articulated barge topologies.
Market Dynamics: Floating offshore wind is transitioning from early demonstration prototypes toward standardized, commercial series manufacturing. The critical bottleneck remains the transition from bespoke, yard-based shipbuilding methodologies to automated, assembly-line manufacturing capable of outputting a floater every one to two weeks. Dajin Heavy Industry is addressing this by constructing an automated, series-production manufacturing line for ultra-large floating platforms at its Caofeidian base, geared for 15 MW to 25 MW units. SK Oceanplant has completed basic design and engineering for its proprietary DS205 semi-submersible floater, designed to support 10 MW to 15 MW turbines with top-mounted catenary mooring lines that mitigate overturning moments and reduce operating expenditures. Concurrently, TSP Wind Power Group and Navantia Seanergies are actively executing demonstration contracts across East Asia and Southern Europe, establishing modular block assembly practices to control residual welding stresses.
DOWNSTREAM APPLICATIONS AND MARKET SEGMENTATION
● Nearshore Applications: Shallow to Medium Depths (Under 50 Meters)
Water Depth and Boundary Conditions: Nearshore environments encompass sheltered or semi-exposed marine locations situated within 30 to 50 meters of depth and close to shorelines.
Substructure Deployment Trends: This segment is dominated by monopiles, which represent more than 70% of total installed volume within this boundary due to minimal manufacturing steps, standardized single-lift installation sequences, and lower initial capital outlay per megawatt.
Market Profile: The nearshore sector accounts for the historical base of commercial offshore wind assets across the UK, Germany, the Netherlands, Denmark, and coastal China. Growth is driven by repowering projects and the industrial expansion of existing lease blocks. The integration of 12 MW to 15 MW turbines into shallow water drives demand for large-diameter, low-length monopiles with broad bases to counter high dynamic overturning bending moments.
● Deepwater Offshore Applications: Depths Exceeding 50 Meters
Water Depth and Boundary Conditions: Deepwater zones span intermediate shelves (50 to 80 meters) out to open ocean environments exceeding 100 meters. These regions possess stronger and more consistent wind resources, away from commercial shipping lanes and coastal preserves.
Substructure Deployment Trends:
Intermediate Zones (50m to 80m): Fixed monopiles encounter economic and mechanical limits due to plate deflection and excessive weight requirements. Lattice jackets, three-legged tripods, and suction-bucket jackets dominate this band by maintaining structural stiffness while optimizing total steel mass.
Ultra-Deep Zones (Beyond 80m): The segment shifts toward floating platforms. Bottom-fixed piles become cost-prohibitive beyond these depths, and floating substructures offer the structural advantage of landside quayside turbine integration, avoiding the use of expensive jack-up installation vessels.
Market Profile: Deepwater development is supported by long-term planning mandates across East Asia, the Mediterranean, the Scottish North Sea, and the United States Pacific coastline. South Korea, for instance, has set structural targets to scale offshore capacity toward 10.5 GW by 2030 and 25 GW by 2035, allocating extensive zones for commercial floating installations. Deepwater structural fabrication capacity for units weighing more than 2,500 tonnes will face localized deficits as commercial-scale floating wind tenders execute simultaneously between 2027 and 2031.
COMMERCIAL MODELS AND SALES CHANNELS
● Direct Sales and Competitive Bidding
Offshore substructure procurement operates primarily through direct, multi-stage competitive tender processes or bilaterally negotiated engineering, procurement, and construction contracts. Foundation fabricators contract directly with energy utilities, such as Orsted, RWE, and China Three Gorges, or Tier-1 balance-of-plant marine contractors, including Jan De Nul and China Communications Construction Company. Fabricators such as Haili Wind Power, Dajin Heavy Industry, and GS Entec generate almost all their revenue through direct corporate bids. Tenders require extensive pre-qualification audits, structural fatigue modeling, health and safety certifications, and balance-sheet verifications.
● Strategic Framework Agreements
Utility developers are increasingly using multi-year capacity reservation frameworks to secure factory capacity slots ahead of final investment decisions. Turbines suppliers, including Vestas and Siemens Gamesa, collaborate with fabricators to standardize structural interface tolerances years prior to commercial fabrication. These strategic framework agreements insulate developers from factory bottlenecks and allow fabricators to optimize raw steel procurement cycles.
● Transition from FOB to DAP Commercial Logistics
Substructure exporters have historically delivered foundations on a Free on Board (FOB) basis at the fabricator quayside, placing the responsibility for ocean transport, transit risk, and staging logistics on the project developer. However, market friction in securing heavy transport vessels has catalyzed a structural shift toward Delivered at Place (DAP) models. Leading yards are taking on international transport logistics, delivering foundations directly to marshalling ports adjacent to offshore wind farm sites.
● Transition to System Service Providers
To support the DAP model, tier-1 fabricators are vertically integrating into marine logistics assets. Dajin Heavy Industry, for example, has acquired dedicated heavy deck cargo vessels and long-range transport ships of up to 43,000 deadweight tonnes, while leasing long-term quayside storage hubs across European ports in Denmark, Germany, and Spain. By internalizing trans-oceanic logistics, fabricators reduce project exposure to maritime spot freight swings, avoid installation port demurrage charges, and capture a broader share of project capital expenditures.
SUPPLY CHAIN AND VALUE CHAIN ARCHITECTURE
● Upstream Segment: Raw Materials and Component Inputs
Heavy Steel Plates: Structural steel plate constitutes 60% to 70% of the total direct material cost of a foundation. Substructures require high-strength, thermo-mechanically controlled processed steel plates engineered for marine fatigue resistance, cold-temperature toughness, and low susceptibility to hydrogen-induced cracking. Key suppliers include POSCO, Dongkuk Steel, and Hyundai Steel in South Korea, alongside Baosteel in China and the Dillinger Group in Europe.
Welding Consumables and Marine Protective Coatings: High-yield flux-cored wires and submerged arc welding fluxes are consumed in multi-pass welds up to 150 millimeters thick. Submerged splash-zone sections receive thick-film solvent-free epoxy systems, polyurethane surface coatings, and cathodic protection assemblies using high-purity aluminum-zinc-indium sacrificial anodes.
Flanges and Internal Ancillaries: Large-diameter forged steel T-flanges, mechanical bolt assemblies, cable entry systems, internal maintenance hoists, and climbing elevator assemblies are procured from specialized industrial suppliers such as Alimak.
● Midstream Segment: Fabrication and Port Infrastructure
Fabrication Engineering: Operations comprise computer numerical control plate cutting, weld edge preparation, plate pre-bending, multi-roll heavy bending, automated submerged arc welding, post-weld heat treatment for residual stress relief, and non-destructive examination using phased-array ultrasonic and time-of-flight diffraction testing.
Quayside Infrastructure: Foundation factories require high ground-bearing quaysides capable of handling loads up to 50 to 100 tonnes per square meter. Yards must feature deep-draft berths (greater than 12 to 15 meters) accessible to heavy-transport vessels, along with gantry cranes lifting from 1,000 to over 2,000 tonnes.
Ocean Transportation: Assembled monopiles and jackets are moved internationally using specialized semi-submersible deck vessels or specialized heavy transport ships.
● Downstream Segment: Offshore EPC, Installation, and Utilities
Marine Installation Contractors: Offshore installation contractors use heavy-lift jack-up vessels, dynamically positioned floating crane ships, and subsea hydraulic pile hammers to place foundations into the seabed.
Project Developers and Utilities: State-owned utilities and independent power producers hold offshore seabed leases, manage regulatory permitting, finance development capital, and operate wind power assets over their operational lifespans.
REGIONAL MARKET DYNAMICS
● Asia-Pacific
The Asia-Pacific region functions as the manufacturing center of the global offshore foundations industry and represents the largest volume of annual project additions.
China: China leads globally in annual capacity deployments. Development follows the national Single 30 framework, which mandates that all new offshore wind farms sit at least 30 kilometers from shore or in water depths surpassing 30 meters. This rule has reduced nearshore projects and driven the rapid deployment of large-diameter deepwater monopiles, four-legged jackets, and floating substructure platforms.
South Korea: Driven by national master plans targeting 10.5 GW of offshore capacity by 2030 and 25 GW by 2035, South Korea enacted the Offshore Wind Special Act in 2025. This legislation replaced fragmented, developer-led permitting with government-led site selection. Backed by expanded annual fixed-price competitive tenders, the market is driving high utilization rates across domestic jacket and monopile yards.
Taiwan, China: Offshore development proceeds under the Round 3 allocation frameworks, which release 1.5 GW of new capacity each year. The relaxation of local content requirements during Round 3 project reviews has allowed developers to source monopiles and jackets from international suppliers, reducing delivery backlogs and benefiting specialized exporters in the wider region.
● Europe
Europe remains the primary destination for deep-sea technology development and institutional greenfield investment.
United Kingdom: The UK advanced its Allocation Round 7 Contracts for Difference auction, awarding record offshore wind capacity supported by adjusted strike prices that account for supply chain inflation. The regional push toward deeper North Sea waters and floating wind projects across the Celtic Sea and coastal Scotland is establishing high baseline demand for both XXL monopiles and next-generation floating platforms.
Germany: Supported by project permits and capacity additions, Germany and its North Sea neighbors have reaffirmed their collective commitment under the Ostend Declaration to deploy 100 GW of offshore wind by 2030 and 300 GW by 2050. These targets support large-scale foundation fabrication demand, though available quayside manufacturing capacity across the North Sea coastline remains heavily constrained.
Western Europe: France, Denmark, the Netherlands, and Poland have standardized bilateral Contracts for Difference auction structures, abandoning zero-subsidy and negative-bidding models that previously depressed supply chain margins. The expansion into the deeper, rock-heavy waters of the Baltic and Mediterranean Seas is accelerating the adoption of complex pin-piled jackets and floating platform architectures.
● North America
The United States market is working through structural regulatory shifts and supply chain realignment.
United States: Federal lease adjustments in late 2025 introduced temporary execution pauses for several Atlantic seaboard projects under construction. Concurrently, the One Big Beautiful Bill Act altered clean energy incentives under the Inflation Reduction Act, setting component credit phase-out dates through 2027. Despite near-term policy shifts, long-term power purchase agreements driven by industrial power consumption and regional utility decarbonization goals continue to support capital allocation. However, domestic fabrication capacity for XXL monopiles remains limited, leaving the market reliant on international imports and foreign vessel operations compliant with maritime cabotage regulations.
● Latin America
The offshore wind market across Latin America remains in its early conceptual phases.
Brazil and Regional Neighbors: Brazil represents the primary focal point for future regional offshore activity, with multi-gigawatt development pipelines under legislative and environmental review. While onshore wind capacity moderated in 2025, the country possesses established offshore fabrication experience within its naval shipyards that can be repurposed for fixed jackets and floating platforms as deepwater auctions formalize.
● Africa and the Middle East
The Middle East and Africa region is laying the preliminary groundwork for coastal offshore energy capture.
Regional Corridors: Initial capacity additions across Saudi Arabia, South Africa, and Egypt remain centered on onshore infrastructure. Nevertheless, regional interest in offshore development is emerging, driven by planned linkages to coastal green hydrogen synthesis hubs, marine ammonia plants, and seawater desalination complexes. Engineering groups in the region are currently targeting modular jacket component fabrication for export to Mediterranean and Northern European developments.
POLICY AND REGULATORY FRAMEWORK ANALYSIS
European Union Auction Reforms: The European Commission has instituted streamlined renewable energy permitting directives, requiring member states to establish defined acceleration areas that compress project environmental reviews to 12 months. Concurrently, European procurement is moving toward indexed two-way Contracts for Difference, replacing uncapped negative bidding structures that historically transferred market volatility onto balance-of-plant manufacturers.
China Marine Spatial Planning: Central government marine planning policies, led by the Single 30 mandate, have shifted new offshore wind pipelines into deeper maritime zones. In addition, national climate commitments made at COP30 target 3.6 billion kilowatts of combined wind and solar capacity by 2035, reinforcing sustained base-load demand for heavy maritime steel structures.
South Korea Offshore Wind Legislation: The passage of the Offshore Wind Special Act in 2025 established a centralized, state-managed zonal auction model in South Korea. This framework eliminates individual developer permitting roadblocks, accelerates seabed surveys, and structures predictable multi-gigawatt competitive tenders through 2035.
United States Policy Realignment: Legislative adjustments under the One Big Beautiful Bill Act revised domestic Advanced Manufacturing Production Credits, creating near-term planning complexity for localized foundation factories. Consequently, developers are balancing domestic fabrication investments with diversified international supply chains to maintain operational timelines.
INDUSTRY OPPORTUNITIES AND OPERATIONAL MOATS
● Turbine Upscaling and Yard Consolidation: The deployment of 15 MW to 25 MW wind turbines requires single-piece monopiles with diameters greater than 14 meters and individual weights up to 3,000 tonnes. Most legacy industrial yards cannot manufacture, roll, lift, or load structures of this size. As a result, industry capacity is consolidating within a small group of tier-1 fabricators that operate heavy rolling machines, deepwater berths, and 1,000-tonne-plus gantry cranes. These operational assets provide structural moats against new entrants.
● Commercialization of Floating Wind: With roughly 80% of global offshore wind resources located in waters deeper than 50 meters, floating wind is moving toward commercial scale. This creates opportunities for modular, semi-submersible, and tension-leg platform fabrication. Standardizing designs allows shipyards to apply line-production methods to floaters, driving down unit production hours and establishing long-term margin advantages.
● Integrated Marine Logistics: Fabricators that manage dedicated heavy transport vessels and secure long-term quayside storage in destination markets are moving from component fabricators to integrated logistics partners. By offering Delivered at Place terms, these operators de-risk shipping bottlenecks for offshore wind developers and capture higher margins compared to basic factory-gate equipment sales.
● Co-Located Marine Applications: Substructures are increasingly designed for multi-use ocean applications, combining offshore wind foundations with offshore aquaculture systems. Projects such as the Guoneng Huanghai No.1 platform show how engineering steel structures for combined wind power and marine ranching can unlock dual-revenue models and optimize ocean spatial planning.
MARKET BOTTLENECK AND CAPITAL RISKS
● Capital Intensity and Elevated Financing Costs: Offshore wind projects require large front-end capital investments, making them sensitive to higher base interest rates and material inflation. These capital dynamics have driven contract renegotiations, project repowering evaluations, and selected schedule adjustments across both European and North American projects over the past 24 months.
● Port Infrastructure and Heavy Transport Shortfalls: Sizing foundations beyond 2,500 tonnes has created a shortage of suitable installation vessels, heavy transport ships, and quayside facilities with sufficient ground-bearing strength. If quayside load capacities and deepwater berths fail to expand in step with turbine dimensions, localized supply-chain bottlenecks could constrain project installations between 2026 and 2030.
● Grid Integration and Transmission Delays: Commissioning timelines remain vulnerable to long lead times for high-voltage direct current converter platforms, subsea export cables, and onshore grid interconnection infrastructure. Delays in landside utility hookups risk stranding completed offshore structural installations, which complicates milestone payments and project returns.
● Raw Material Volatility: Heavy structural steel plate accounts for roughly 60% to 70% of foundation manufacturing costs. While raw steel prices across Asia and Europe stabilized in 2025, regional pricing variations and tariffs introduce margin risk for fabricators that operate without index-linked contracts or back-to-back hedging structures.
COMPREHENSIVE COMPANY PROFILES
1. Sif Group: Headquartered in Roermond with deepwater operations at Maasvlakte 2 in Rotterdam, Netherlands, Sif Group is an established European manufacturer of offshore wind foundations. The company operates dedicated quayside rolling, welding, and load-out facilities along the Maasvlakte deepwater basin, enabling direct maritime transfer of finished foundations onto ocean transport vessels.
2. EEW Group: Headquartered in Erndtebrück with quayside production at the Port of Rostock, Germany, EEW Group specializes in thick-walled, longitudinally submerged arc welded steel pipe fabrication. Its location along the Baltic coast gives the company direct access to deepwater shipping routes into the North Sea, Baltic Sea, and global offshore export markets.
3. Steelwind Nordenham GmbH: Located in Nordenham on the Weser River, Germany, Steelwind Nordenham operates as a dedicated subsidiary of the Dillinger Group. This vertical integration secures its primary supply chain for heavy, thermo-mechanically rolled steel plates, giving the company reliable access to specialized heavy steel inputs.
4. Haizea Wind Group: Headquartered in Bilbao, Spain, Haizea Wind Group operates heavy maritime fabrication facilities in the Port of Bilbao and the Port of Brest, France. Its facilities feature direct deepwater quayside berths, large laydown areas, and high-capacity gantry cranes designed for loading extra-large foundations.
5. Navantia Seanergies: Navantia Seanergies, the green energy arm of Spanish state-owned shipbuilder Navantia, runs maritime fabrication yards in Fene (A Coruña) and Puerto Real (Cádiz), Spain. These shipyards provide dry docks, gantry cranes, and quayside facilities adapted for heavy offshore structures.
6. Welcon A/S: Headquartered in Give, Denmark, Welcon is an established manufacturer of heavy steel tubular assemblies and offshore wind turbine towers. The company operates automated plate processing lines, internal rolling systems, and specialized surface treatment facilities tailored for offshore components.
7. Dajin Heavy Industry Co., Ltd.: Headquartered in Taicang, China, with manufacturing hubs at its Penglai and Caofeidian yards, Dajin Heavy Industry is an export fabricator of offshore wind foundations. The Penglai facility operates direct deepwater quayside berths capable of accommodating 100,000-tonne vessels, supported by integrated multi-axis rolling equipment and automated welding systems.
8. Jiangsu Haili Wind Power Equipment Co., Ltd.: Located in Rudong, Jiangsu Province, China, Haili Wind Power operates several coastal fabrication yards positioned near shallow and medium-depth offshore development zones along the East China Sea.
9. TSP Wind Power Group (Shanghai Taisheng): Headquartered in Shanghai, China, TSP Wind Power Group operates maritime fabrication bases along the Chinese coastline. These facilities integrate heavy plate processing, rolling machines, and painting halls with direct barge and transport ship access.
10. Nantong Rainbow Offshore & Engineering Equipment Co., Ltd.: Located in Qidong, Jiangsu Province, China, along the Yangtze River estuary, Rainbow Offshore operates as a subsidiary of Jiangsu Rainbow Heavy Industries. The yard features deepwater quays, heavy gantry cranes, and structural steel assembly spaces.
11. JFE Engineering Corporation: Headquartered in Tokyo, Japan, JFE Engineering leverages the steel production and metallurgy resources of JFE Holdings. The company operates a dedicated offshore wind foundation fabrication yard at Kasaoka, Okayama Prefecture, alongside fabrication capacity at its Tsu Works.
12. SeAH Wind Ltd.: Headquartered in Teesside, United Kingdom, SeAH Wind operates as the UK manufacturing arm of South Korea's SeAH Steel Holdings. The company has invested in a large-scale monopile manufacturing facility situated within the Teesworks Freeport, providing deepwater quayside export access to North Sea project sites.
13. SK Oceanplant Co., Ltd.: Headquartered in Goseong, Gyeongsangnam-do, South Korea, SK Oceanplant operates large-scale coastal fabrication yards with direct deepwater access, multi-thousand-tonne load-out quays, and assembly space for simultaneous multi-unit manufacturing.
14. GS Entec Corp.: Headquartered in Ulsan, South Korea, GS Entec is an industrial engineering and equipment subsidiary of the GS Group. The company has repurposed its Yongjam facility in Ulsan into a specialized offshore foundation yard, supported by quayside access to South Korea's southeastern maritime corridor.
15. Larsen & Toubro Limited (L&T): Headquartered in Mumbai, India, Larsen & Toubro operates modular fabrication yards in Hazira and Kattupalli, India, as well as an offshore facility in Sohar, Oman. These yards feature large coastal waterfronts, heavy lifting systems, and automated structural shops.
16. HD Hyundai: Headquartered in Ulsan and Seongnam, South Korea, the HD Hyundai Group addresses the offshore wind foundation sector through its shipbuilding and offshore engineering business, HD Hyundai Heavy Industries, while HD Hyundai Electric supplies the accompanying high-voltage electrical transformers, switchgear, and substation systems.
17. CS Wind Corporation: Headquartered in Cheonan, South Korea, CS Wind operates a global wind tower and structural steel fabrication network with yards across South Korea, Vietnam, the United States, Portugal, Taiwan, China, and Malaysia.
1.1 Research Scope and Market Definition 1
1.2 Research Methodology and Secondary Sourcing Architecture 2
1.3 Primary Data Sourcing and Expert Triangulation 3
1.4 Base-Year Calibration and Forecast Modeling Assumptions 4
1.5 Currency, Exchange Rates, and Metric Conversions 5
1.6 List of Abbreviations and Industry Acronyms 6
Chapter 2 Global Offshore Wind Substructures & Foundations Market Overview 7
2.1 Global Market Sizing and Trajectory (2021-2031) 7
2.2 Mega-Turbine Scaling Trends and Impact on Foundation Sizing (15MW to 20MW+) 9
2.3 Regulatory Tailwinds, Seabed Leasing Rounds, and Target Allocations 11
Chapter 3 Industry Value Chain and Manufacturing Ecosystem 13
3.1 Comprehensive Value Chain Mapping: Raw Steel to Installation 13
3.2 Upstream Raw Material Sourcing Dynamics: Heavy Heavy Steel Plate and Flanges 14
3.3 Intermediate Fabrication Processes: Bending, Welding, Coating, and Quality Inspection 15
3.4 Heavy-Lift Harbor Facilities, Marshalling Ports, and Installation Vessel Bottlenecks 16
3.5 Cost Structure Optimization and Levelized Cost of Energy (LCOE) Integration 18
Chapter 4 Global Market by Substructure & Foundation Type 19
4.1 Global Foundation Volume and Revenue Sizing by Product Class (2021-2031) 19
4.2 Fixed Foundations 20
4.2.1 Monopiles (XXL and XXXL Design Architectures) 21
4.2.2 Jackets (Three-Leg and Four-Leg Configurations) 22
4.2.3 Transition Pieces (Integrated vs. Standalone Structures) 23
4.2.4 Others (Gravity-Based Structures and Suction Buckets) 24
4.3 Floating Foundations (Semi-submersible, Spar-buoy, Tension Leg Platform) 25
Chapter 5 Global Market by Application and Water Depth 26
5.1 Water Depth Segmentation Dynamics 26
5.2 Nearshore Deployment (0-30 Meters Water Depth) 27
5.3 Deepwater Offshore Deployment (30-60+ Meters Water Depth) 29
Chapter 6 Global Trade Flow, Export Corridors, and Port Infrastructure 31
6.1 Inter-Regional Transportation Economics and Heavy-Transport Vessel Constraints 31
6.2 Export-Import Bilateral Flows: Trans-Eurasian and Trans-Atlantic Hubs 33
6.3 Port Infrastructure Readiness, Quay Load-Bearing Limits, and Marshalling Capacity 35
Chapter 7 North America Offshore Wind Substructures & Foundations Market 37
7.1 Regional Market Dynamics and Local Content Regulations 37
7.2 United States 39
Chapter 8 Europe Offshore Wind Substructures & Foundations Market 42
8.1 European North Sea and Baltic Sea Market Dynamics 42
8.2 United Kingdom 43
8.3 Germany 44
8.4 Netherlands 45
8.5 Denmark 46
8.6 Spain 47
8.7 France 48
8.8 Norway 49
Chapter 9 Asia-Pacific Offshore Wind Substructures & Foundations Market 50
9.1 Production Sourcing Dominance and Regional Installation Expansion 50
9.2 China 51
9.3 South Korea 53
9.4 Japan 54
9.5 India 56
9.6 Southeast Asia 57
Chapter 10 Latin America, Middle East & Africa Market Assessment 58
10.1 Latin America Offshore Energy Emerging Hubs 58
10.2 Middle East & Africa Desalination and Hydrogen Integration 60
Chapter 11 Global Competitive Landscape and Tier-1 Player Benchmark 62
11.1 Fabrication Capacity Mapping and Yard Expansions 62
11.2 Market Consolidation Matrix and Strategic Yard Alliances 63
11.3 Global Market Share Distribution of Leading Foundation Fabricators (2021-2026) 64
Chapter 12 Corporate Intelligence: Key Fabricators and Marine Contractors 66
12.1 GS Entec Corp. 66
12.1.1 Corporate Profile and Production Facility Footprint 66
12.1.2 Product Portfolio and Monopile Fabrication Capabilities 67
12.1.3 Strategic SWOT Matrix 67
12.1.4 Financial Metrics, Revenue, Cost, Gross Margin, and Global Market Share 68
12.2 SK Oceanplant 70
12.2.1 Corporate Profile and Production Facility Footprint 70
12.2.2 Product Portfolio and Jacket/Substructure Fabrication Capabilities 71
12.2.3 Strategic SWOT Matrix 71
12.2.4 Financial Metrics, Revenue, Cost, Gross Margin, and Global Market Share 72
12.3 CS Wind Corporation 74
12.3.1 Corporate Profile and Production Facility Footprint 74
12.3.2 Product Portfolio and Offshore Wind Tower/Foundation Integrations 75
12.3.3 Strategic SWOT Matrix 75
12.3.4 Financial Metrics, Revenue, Cost, Gross Margin, and Global Market Share 76
12.4 Sif Group 78
12.4.1 Corporate Profile and Production Facility Footprint 78
12.4.2 Product Portfolio and Maasvlakte 2 Monopile Facility Expansion 79
12.4.3 Strategic SWOT Matrix 79
12.4.4 Financial Metrics, Revenue, Cost, Gross Margin, and Global Market Share 80
12.5 EEW Group 82
12.5.1 Corporate Profile and Production Facility Footprint 82
12.5.2 Product Portfolio and Heavy Steel Pipe Foundation Engineering 83
12.5.3 Strategic SWOT Matrix 83
12.5.4 Financial Metrics, Revenue, Cost, Gross Margin, and Global Market Share 84
12.6 SeAH Wind Ltd 86
12.6.1 Corporate Profile and Production Facility Footprint 86
12.6.2 Product Portfolio and Teesside Monopile Facility Integration 87
12.6.3 Strategic SWOT Matrix 87
12.6.4 Financial Metrics, Revenue, Cost, Gross Margin, and Global Market Share 88
12.7 Steelwind Nordenham GmbH 90
12.7.1 Corporate Profile and Production Facility Footprint 90
12.7.2 Product Portfolio and Beyond-XXL Single-Piece Monopiles 91
12.7.3 Strategic SWOT Matrix 91
12.7.4 Financial Metrics, Revenue, Cost, Gross Margin, and Global Market Share 92
12.8 Navantia Seanergies 94
12.8.1 Corporate Profile and Production Facility Footprint 94
12.8.2 Product Portfolio and Floating Foundation/Jacket Fabrication Units 95
12.8.3 Strategic SWOT Matrix 95
12.8.4 Financial Metrics, Revenue, Cost, Gross Margin, and Global Market Share 96
12.9 Haizea Wind Group 98
12.9.1 Corporate Profile and Production Facility Footprint 98
12.9.2 Product Portfolio and Bilbao Monopile Facility Operations 99
12.9.3 Strategic SWOT Matrix 99
12.9.4 Financial Metrics, Revenue, Cost, Gross Margin, and Global Market Share 100
12.10 JFE Engineering Corporation 102
12.10.1 Corporate Profile and Production Facility Footprint 102
12.10.2 Product Portfolio and Kasaoka Monopile Fabrication Works 103
12.10.3 Strategic SWOT Matrix 103
12.10.4 Financial Metrics, Revenue, Cost, Gross Margin, and Global Market Share 104
12.11 Dajin Heavy Industry Co. Ltd. 106
12.11.1 Corporate Profile and Production Facility Footprint 106
12.11.2 Product Portfolio and Penglai Heavy Facility Export Capabilities 107
12.11.3 Strategic SWOT Matrix 107
12.11.4 Financial Metrics, Revenue, Cost, Gross Margin, and Global Market Share 108
12.12 Haili Wind Power 110
12.12.1 Corporate Profile and Production Facility Footprint 110
12.12.2 Product Portfolio and Coastal Foundation Fabrication Bases 111
12.12.3 Strategic SWOT Matrix 111
12.12.4 Financial Metrics, Revenue, Cost, Gross Margin, and Global Market Share 112
12.13 TSP Wind Power Group 114
12.13.1 Corporate Profile and Production Facility Footprint 114
12.13.2 Product Portfolio and Heavy Marine Steel Structure Manufacturing 115
12.13.3 Strategic SWOT Matrix 115
12.13.4 Financial Metrics, Revenue, Cost, Gross Margin, and Global Market Share 116
12.14 Rainbow Offshore 118
12.14.1 Corporate Profile and Production Facility Footprint 118
12.14.2 Product Portfolio and Deepwater Jacket/Floating Substructures 119
12.14.3 Strategic SWOT Matrix 119
12.14.4 Financial Metrics, Revenue, Cost, Gross Margin, and Global Market Share 120
12.15 Larsen & Toubro Limited 122
12.15.1 Corporate Profile and Production Facility Footprint 122
12.15.2 Product Portfolio and Heavy Modular Offshore Fabrication Yards 123
12.15.3 Strategic SWOT Matrix 123
12.15.4 Financial Metrics, Revenue, Cost, Gross Margin, and Global Market Share 124
12.16 HD Hyundai Electric 126
12.16.1 Corporate Profile and Production Facility Footprint 126
12.16.2 Product Portfolio and Substructure Electrical Substation Interfaces 127
12.16.3 Strategic SWOT Matrix 127
12.16.4 Financial Metrics, Revenue, Cost, Gross Margin, and Global Market Share 128
12.17 Welcon 130
12.17.1 Corporate Profile and Production Facility Footprint 130
12.17.2 Product Portfolio and Stiesdal Floating Foundation Collaborations 131
12.17.3 Strategic SWOT Matrix 131
12.17.4 Financial Metrics, Revenue, Cost, Gross Margin, and Global Market Share 132
Table 2: Steel Plate Grades and Specifications for XXL Offshore Monopiles and Jackets 14
Table 3: Global Offshore Wind Substructures & Foundations Market by Type (USD Million), 2021-2031 19
Table 4: Global Offshore Wind Substructures & Foundations Market Volume by Type (Units), 2021-2031 20
Table 5: Global Fixed Offshore Wind Foundations Market by Sub-Category (USD Million), 2021-2031 21
Table 6: Global Monopile Market Value by Water Depth Bracket (USD Million), 2021-2031 22
Table 7: Global Jacket Foundation Market by Configuration (USD Million), 2021-2031 23
Table 8: Global Transition Pieces Market Sizing and Volume (USD Million, Units), 2021-2031 24
Table 9: Global Floating Wind Substructure Market by Hull Architecture (USD Million), 2021-2031 25
Table 10: Global Offshore Wind Substructures Market by Application (USD Million), 2021-2031 26
Table 11: Nearshore Foundation Market Size by Region (USD Million), 2021-2031 28
Table 12: Deepwater Offshore Foundation Market Size by Region (USD Million), 2021-2031 30
Table 13: Inter-Continental Shipping Freight Index for Heavy Substructures, 2021-2026 32
Table 14: North America Offshore Wind Substructures Market by Type (USD Million), 2021-2031 38
Table 15: United States Offshore Wind Foundation Deliveries and Capacity by Basin, 2021-2031 40
Table 16: Europe Offshore Wind Substructures Market by Country (USD Million), 2021-2031 42
Table 17: United Kingdom Offshore Wind Foundation Deployment Schedule (USD Million), 2021-2031 43
Table 18: Germany Offshore Wind Foundation Market by Substructure Class (USD Million), 2021-2031 44
Table 19: Netherlands Offshore Wind Foundation Volume and Revenue Sizing, 2021-2031 45
Table 20: Denmark Offshore Wind Substructure Industrial Orders (USD Million), 2021-2031 46
Table 21: Spain Offshore Wind and Floating Substructure Commercial Volume, 2021-2031 47
Table 22: France Offshore Wind Substructures Market Sizing (USD Million), 2021-2031 48
Table 23: Norway Floating Substructures Pilot and Commercial Pipeline, 2021-2031 49
Table 24: Asia-Pacific Offshore Wind Substructures Market by Country (USD Million), 2021-2031 51
Table 25: China Offshore Wind Foundation Market Value and Yard Deliveries, 2021-2031 52
Table 26: South Korea Offshore Wind Substructures Revenue by Project Tier, 2021-2031 53
Table 27: Japan Offshore Wind Foundation Installations and Projections, 2021-2031 55
Table 28: India Offshore Wind Substructures Industrialization Pipeline, 2021-2031 56
Table 29: Vietnam Intertidal and Nearshore Wind Foundation Dynamics, 2021-2031 57
Table 30: Latin America, Middle East & Africa Substructures Market (USD Million), 2021-2031 58
Table 31: Brazil Offshore Wind Technical Potential and Substructure Projections, 2021-2031 59
Table 32: Saudi Arabia Offshore Renewables and Desalination Substructures, 2021-2031 61
Table 33: Global Top 10 Fabricators Annual Yard Throughput Capacity (Metric Tons), 2026 63
Table 34: Global Offshore Wind Foundation Market Share Sizing of Core Fabricators, 2021-2026 65
Table 35: GS Entec Corp. Offshore Wind Substructures & Foundations Revenue, Cost and Gross Margin (2021-2026) 69
Table 36: SK Oceanplant Offshore Wind Substructures & Foundations Revenue, Cost and Gross Margin (2021-2026) 73
Table 37: CS Wind Corporation Offshore Wind Substructures & Foundations Revenue, Cost and Gross Margin (2021-2026) 77
Table 38: Sif Group Offshore Wind Substructures & Foundations Revenue, Cost and Gross Margin (2021-2026) 81
Table 39: EEW Group Offshore Wind Substructures & Foundations Revenue, Cost and Gross Margin (2021-2026) 85
Table 40: SeAH Wind Ltd Offshore Wind Substructures & Foundations Revenue, Cost and Gross Margin (2021-2026) 89
Table 41: Steelwind Nordenham GmbH Offshore Wind Substructures & Foundations Revenue, Cost and Gross Margin (2021-2026) 93
Table 42: Navantia Seanergies Offshore Wind Substructures & Foundations Revenue, Cost and Gross Margin (2021-2026) 97
Table 43: Haizea Wind Group Offshore Wind Substructures & Foundations Revenue, Cost and Gross Margin (2021-2026) 101
Table 44: JFE Engineering Corporation Offshore Wind Substructures & Foundations Revenue, Cost and Gross Margin (2021-2026) 105
Table 45: Dajin Heavy Industry Co. Ltd. Offshore Wind Substructures & Foundations Revenue, Cost and Gross Margin (2021-2026) 109
Table 46: Haili Wind Power Offshore Wind Substructures & Foundations Revenue, Cost and Gross Margin (2021-2026) 113
Table 47: TSP Wind Power Group Offshore Wind Substructures & Foundations Revenue, Cost and Gross Margin (2021-2026) 117
Table 48: Rainbow Offshore Offshore Wind Substructures & Foundations Revenue, Cost and Gross Margin (2021-2026) 121
Table 49: Larsen & Toubro Limited Offshore Wind Substructures & Foundations Revenue, Cost and Gross Margin (2021-2026) 125
Table 50: HD Hyundai Electric Offshore Wind Substructures & Foundations Revenue, Cost and Gross Margin (2021-2026) 129
Table 51: Welcon Offshore Wind Substructures & Foundations Revenue, Cost and Gross Margin (2021-2026) 133
Figure 1: Global Offshore Wind Substructures & Foundations Market Sizing and Growth Rate, 2021-2031 8
Figure 2: Offshore Turbine Power Ratings Evolution and Associated Foundation Diameter Scaling (2021-2031) 10
Figure 3: Offshore Wind Substructure End-to-End Value Chain Map 13
Figure 4: Raw Material Cost Breakdown for XXL Offshore Monopiles (2026) 15
Figure 5: Foundation Capex as a Share of Total Offshore Wind Farm Installation Capex 18
Figure 6: Global Substructures Market Share Breakdown by Product Type (2021 vs. 2026 vs. 2031) 20
Figure 7: Monopile Diameter and Weight Scaling Curve (2021-2031) 22
Figure 8: Floating Wind Foundation Commercial Deployment Ramp-Up (2024-2031) 25
Figure 9: Market Share Distribution by Water Depth Class (2021-2031) 27
Figure 10: Nearshore vs. Deepwater Foundation Sizing Comparison Matrix 29
Figure 11: Global Trade Routes and Shipping Corridors for Marine Foundation Structures 34
Figure 12: European Offshore Wind Foundation Yard Capacity vs. Projected Seabed Demand (2024-2031) 43
Figure 13: Asia-Pacific Offshore Foundation Production Volume Share by Major Country (2026) 50
Figure 14: China Domestic Demand vs. Export Sourcing Volume for Offshore Foundations (2021-2031) 52
Figure 15: Global Offshore Wind Substructure Yard Market Concentration (CR5 and HHI Index, 2021-2026) 64
Figure 16: GS Entec Corp. Offshore Wind Substructures & Foundations Market Share (2021-2026) 69
Figure 17: SK Oceanplant Offshore Wind Substructures & Foundations Market Share (2021-2026) 73
Figure 18: CS Wind Corporation Offshore Wind Substructures & Foundations Market Share (2021-2026) 77
Figure 19: Sif Group Offshore Wind Substructures & Foundations Market Share (2021-2026) 81
Figure 20: EEW Group Offshore Wind Substructures & Foundations Market Share (2021-2026) 85
Figure 21: SeAH Wind Ltd Offshore Wind Substructures & Foundations Market Share (2021-2026) 89
Figure 22: Steelwind Nordenham GmbH Offshore Wind Substructures & Foundations Market Share (2021-2026) 93
Figure 23: Navantia Seanergies Offshore Wind Substructures & Foundations Market Share (2021-2026) 97
Figure 24: Haizea Wind Group Offshore Wind Substructures & Foundations Market Share (2021-2026) 101
Figure 25: JFE Engineering Corporation Offshore Wind Substructures & Foundations Market Share (2021-2026) 105
Figure 26: Dajin Heavy Industry Co. Ltd. Offshore Wind Substructures & Foundations Market Share (2021-2026) 109
Figure 27: Haili Wind Power Offshore Wind Substructures & Foundations Market Share (2021-2026) 113
Figure 28: TSP Wind Power Group Offshore Wind Substructures & Foundations Market Share (2021-2026) 117
Figure 29: Rainbow Offshore Offshore Wind Substructures & Foundations Market Share (2021-2026) 121
Figure 30: Larsen & Toubro Limited Offshore Wind Substructures & Foundations Market Share (2021-2026) 125
Figure 31: HD Hyundai Electric Offshore Wind Substructures & Foundations Market Share (2021-2026) 129
Figure 32: Welcon Offshore Wind Substructures & Foundations Market Share (2021-2026) 133
Research Methodology
- Market Estimated Methodology:
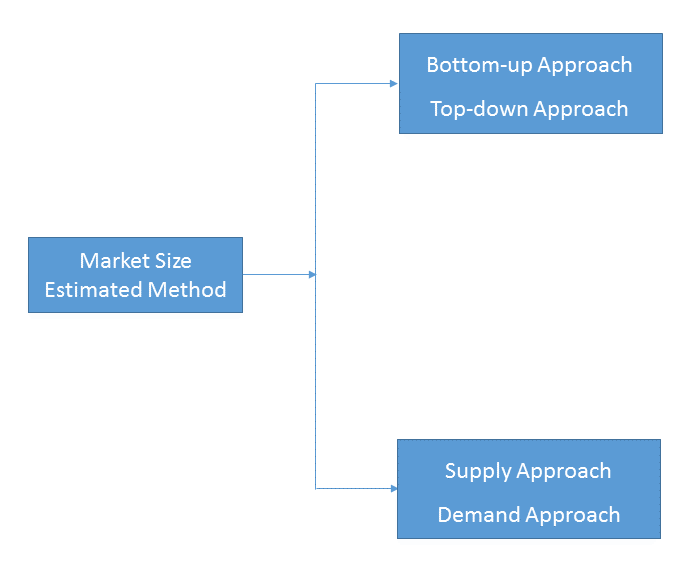
Bottom-up & top-down approach, supply & demand approach are the most important method which is used by HDIN Research to estimate the market size.
1)Top-down & Bottom-up Approach
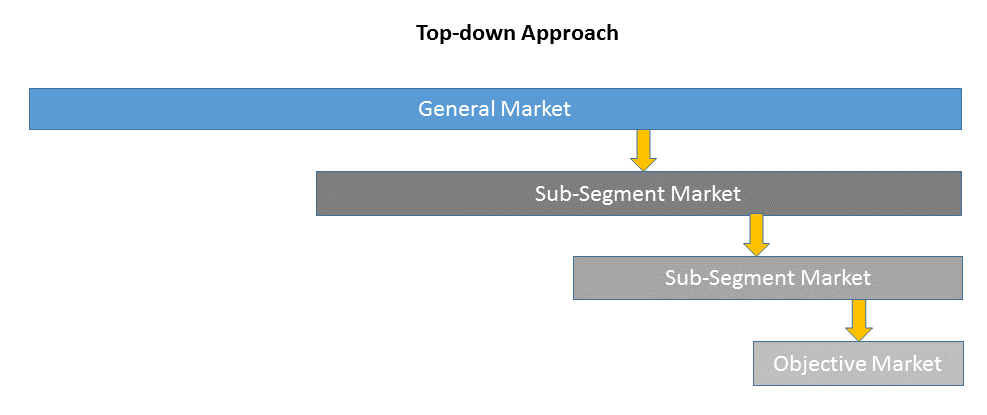
Top-down approach uses a general market size figure and determines the percentage that the objective market represents.
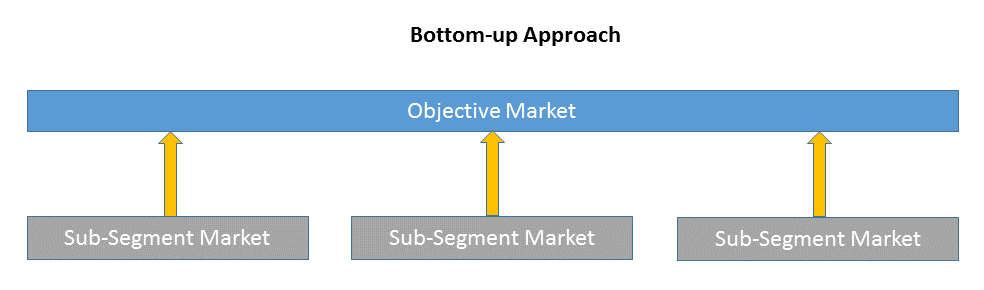
Bottom-up approach size the objective market by collecting the sub-segment information.
2)Supply & Demand Approach
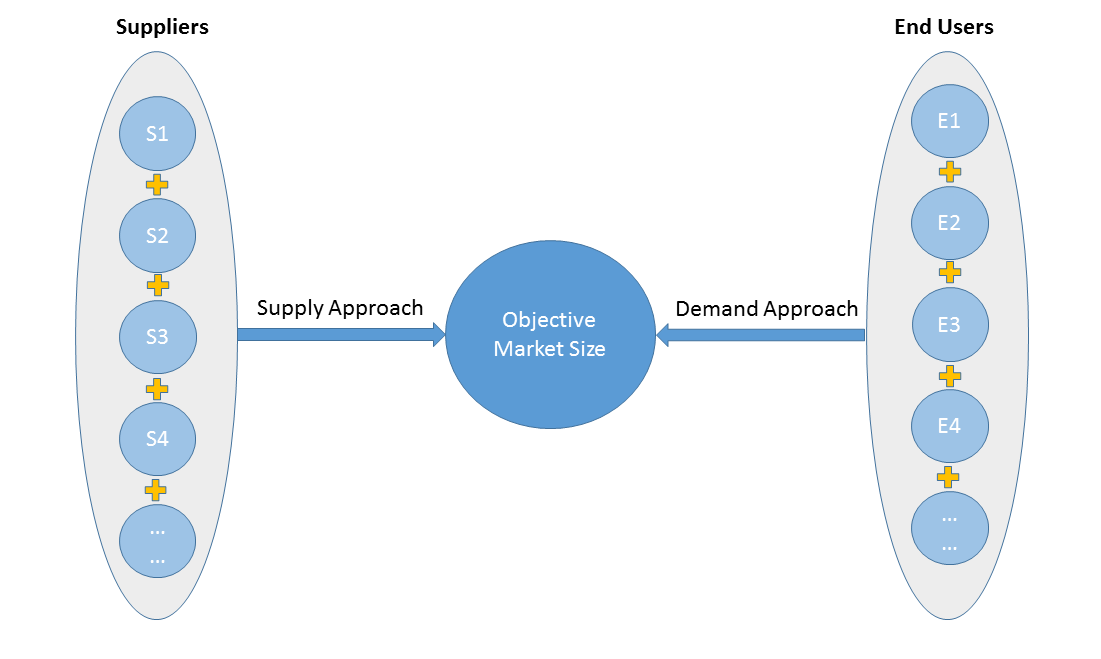
Supply approach is based on assessments of the size of each competitor supplying the objective market.
Demand approach combine end-user data within a market to estimate the objective market size. It is sometimes referred to as bottom-up approach.
- Forecasting Methodology
- Numerous factors impacting the market trend are considered for forecast model:
- New technology and application in the future;
- New project planned/under contraction;
- Global and regional underlying economic growth;
- Threatens of substitute products;
- Industry expert opinion;
- Policy and Society implication.
- Analysis Tools
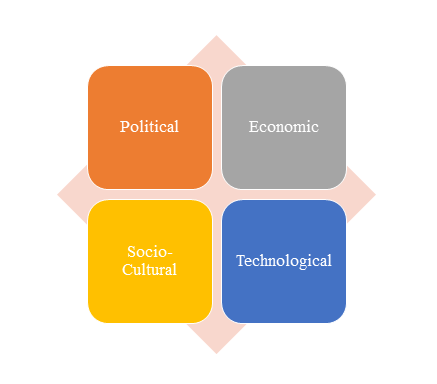
1)PEST Analysis
PEST Analysis is a simple and widely used tool that helps our client analyze the Political, Economic, Socio-Cultural, and Technological changes in their business environment.
- Benefits of a PEST analysis:
- It helps you to spot business opportunities, and it gives you advanced warning of significant threats.
- It reveals the direction of change within your business environment. This helps you shape what you’re doing, so that you work with change, rather than against it.
- It helps you avoid starting projects that are likely to fail, for reasons beyond your control.
- It can help you break free of unconscious assumptions when you enter a new country, region, or market; because it helps you develop an objective view of this new environment.
2)Porter’s Five Force Model Analysis
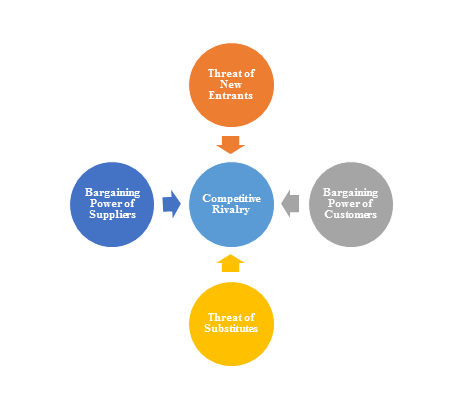
The Porter’s Five Force Model is a tool that can be used to analyze the opportunities and overall competitive advantage. The five forces that can assist in determining the competitive intensity and potential attractiveness within a specific area.
- Threat of New Entrants: Profitable industries that yield high returns will attract new firms.
- Threat of Substitutes: A substitute product uses a different technology to try to solve the same economic need.
- Bargaining Power of Customers: the ability of customers to put the firm under pressure, which also affects the customer's sensitivity to price changes.
- Bargaining Power of Suppliers: Suppliers of raw materials, components, labor, and services (such as expertise) to the firm can be a source of power over the firm when there are few substitutes.
- Competitive Rivalry: For most industries the intensity of competitive rivalry is the major determinant of the competitiveness of the industry.
3)Value Chain Analysis
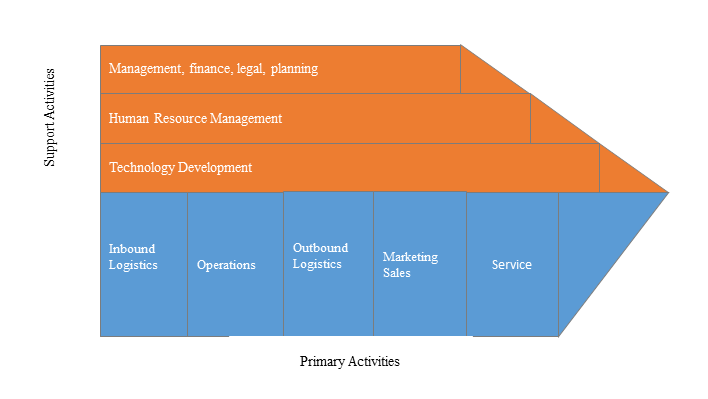
Value chain analysis is a tool to identify activities, within and around the firm and relating these activities to an assessment of competitive strength. Value chain can be analyzed by primary activities and supportive activities. Primary activities include: inbound logistics, operations, outbound logistics, marketing & sales, service. Support activities include: technology development, human resource management, management, finance, legal, planning.
4)SWOT Analysis
SWOT analysis is a tool used to evaluate a company's competitive position by identifying its strengths, weaknesses, opportunities and threats. The strengths and weakness is the inner factor; the opportunities and threats are the external factor. By analyzing the inner and external factors, the analysis can provide the detail information of the position of a player and the characteristics of the industry.
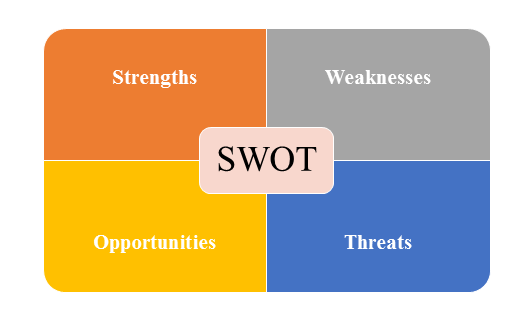
- Strengths describe what the player excels at and separates it from the competition
- Weaknesses stop the player from performing at its optimum level.
- Opportunities refer to favorable external factors that the player can use to give it a competitive advantage.
- Threats refer to factors that have the potential to harm the player.
- Data Sources
| Primary Sources | Secondary Sources |
|---|---|
| Face to face/Phone Interviews with market participants, such as: Manufactures; Distributors; End-users; Experts. Online Survey |
Government/International Organization Data: Annual Report/Presentation/Fact Book Internet Source Information Industry Association Data Free/Purchased Database Market Research Report Book/Journal/News |