Immune Checkpoint Inhibitor Market Analysis & Forecast
- Single User License (1 Users) $ 5,000
- Team License (2~5 Users) $ 6,500
- Corporate License (>5 Users) $ 7,500
Immune Checkpoint Inhibitors comprise engineered immunoglobulin constructs, single-domain fragments, and bispecific fusion molecules configured to disrupt coinhibitory signaling cascades exploited by malignant cells to evade host immune surveillance. Under homeostatic physiological conditions, checkpoint proteins safeguard self-tolerance and limit peripheral tissue destruction. Malignancies co-opt these pathways, establishing an immunosuppressive tumor microenvironment (TME) that drives cytotoxic T-lymphocyte exhaustion. The global Immune Checkpoint Inhibitor (ICI) market represents the central pharmacological pillar of modern medical oncology, transitioning rapidly from monotherapy checkpoint blockade to multi-pathway bispecific constructs, antibody-drug conjugate (ADC) synergisms, and high-concentration subcutaneous delivery platforms. global Immune Checkpoint Inhibitor (ICI) market size is valued between 68.00 and 80.00 billion USD in 2026, the sector is traversing an inflection point. The ICI market is projected to expand at a compound annual growth rate (CAGR) within the 12.00% to 16.00% through 2031, driven by label expansions into perioperative early-stage solid tumors and the commercial scaling of next-generation bispecifics. The underlying growth momentum is propelled by the clinical imperative to overcome primary and acquired tumor immune resistance, reverse regulatory T-cell (Treg) immunosuppression, and eliminate cold tumor phenotypes. Simultaneously, commercial dynamics are heavily pressured by sovereign pricing disciplines, notably the United States Inflation Reduction Act (IRA) Medicare negotiation waves and China volume-based procurement (VBP), catalyzing an urgent strategic race toward patent-extending subcutaneous formulations and high-potency bispecific combinations.
Commercial leadership remains concentrated among global biopharma majors including Merck and Co., Bristol Myers Squibb, AstraZeneca, and Roche, while aggressive clinical-stage and commercial innovation is deployed by Asian biopharma leaders such as Akeso, Innovent Biologics, BeOne Medicines, Shanghai Henlius Biotech, and Shanghai Junshi Biosciences, alongside emerging biosimilar developers including Zydus Lifesciences, Formycon, and Celltrion. North America commands the majority of global value realization due to open commercial pricing structures and early-line clinical penetration. However, the fastest volume expansions reside across the Asia-Pacific region, spearheaded by rapid regulatory clearances and National Reimbursement Drug List (NRDL) access in China, followed by mature commercial demand in Japan and expanding biosimilar adoption in India.
PRODUCT CLASSIFICATION AND COMMERCIAL PORTFOLIO AUDIT
The global therapeutic arsenal of Immune Checkpoint Inhibitors is categorized across distinct structural and pharmacological classifications.
● Anti-PD-1 Monoclonal Antibodies:
The anti-PD-1 class forms the undisputed baseline therapeutic foundation of immuno-oncology.
- Pembrolizumab (Keytruda, Merck and Co.): Recombinant humanized IgG4 kappa antibody. Delivered 31.68 billion USD in global sales in 2025, an increase of 7.50% year-over-year. Possesses approvals across more than 20 indications covering early and advanced stages. In 2025, commercial deployment commenced for Keytruda Qlex, a high-concentration subcutaneous formulation formulated with recombinant human hyaluronidase. Primary composition-of-matter patents face expiration windows between 2028 and 2030 across the US and Europe, though subcutaneous patent thickets extend intellectual property coverage to 2043.
- Nivolumab (Opdivo, Bristol Myers Squibb and Ono Pharmaceutical): Fully human IgG4 monoclonal antibody. Opdivo generated 10.05 billion USD in global net sales during 2025. In parallel, BMS commercialized its subcutaneous iteration, Opdivo Qvantig, securing 238.00 million USD in its initial commercial rollout. Basic composition-of-matter protections in primary jurisdictions approach expiration in the 2028 to 2030 window.
- Tislelizumab (Tevimbra, BeOne Medicines): Fc-engineered humanized IgG4 monoclonal antibody optimized to eliminate Fc gamma receptor binding on macrophages, abrogating antibody-dependent cellular phagocytosis (ADCP) that depletes T-cells. Global product revenue expanded to 737.30 million USD in 2025, underpinned by broad label clearances in second-line esophageal squamous cell carcinoma (ESCC) and non-small cell lung cancer (NSCLC) across the US, Europe, and China.
- Sintilimab (Tyvyt, Innovent Biologics and Eli Lilly): Fully human IgG4 antibody. Formed the commercial core of Innovent's total product revenues, which touched 1,655.08 million USD in 2025, marking 44.60% year-over-year operational scaling, fortified by broad coverage across all primary indications under China National Reimbursement Drug List (NRDL).
- Toripalimab (Tuoyi / Loqtorzi, Shanghai Junshi Biosciences and Coherus Oncology): Recombinant humanized IgG4 targeting PD-1. Anchored Junshi's 2025 drug sales of 320.14 million USD, expanding 40.30% year-over-year. Holds approvals in nasopharyngeal carcinoma across North America and extensive solid tumor indications within Asia.
- Serplulimab (Hansizhuang, Shanghai Henlius Biotech): Humanized IgG4 antibody engineered for stability, yielding 200.32 million USD in domestic commercial sales for 2025, validated as the first anti-PD-1 approved globally for first-line extensive-stage small cell lung cancer (ES-SCLC).
- Cemiplimab (Libtayo, Regeneron Pharmaceuticals and Sanofi): Fully human IgG4 antibody, yielding 1.45 billion USD in 2025 sales, establishing definitive market positioning across non-melanoma skin malignancies including cutaneous squamous cell carcinoma (CSCC) and basal cell carcinoma (BCC).
- Additional Monospecific Entrants: Dostarlimab (Jemperli, GSK), demonstrating dominance in mismatch repair-deficient (dMMR) endometrial cancers; Retifanlimab (Zynyz, Incyte Corporation); Penpulimab (Annike, Akeso and Sino Biopharmaceutical); Pusulimab (Lepu Biopharma); Enlonstobart (SG001, CSPC Pharmaceutical Group), approved by the NMPA and entering broad commercial expansion in 2026.
● Anti-PD-L1 Monoclonal Antibodies:
- Durvalumab (Imfinzi, AstraZeneca): Human IgG1 kappa antibody engineered to retain normal binding affinity while averting ADCC. Generated global revenue of 6.06 billion USD in 2025, an operational increase of 29.00% year-over-year, anchored by standard-of-care consolidation in Stage III unresectable NSCLC and biliary tract cancers.
- Atezolizumab (Tecentriq, Roche): Fc-engineered humanized IgG1 antibody, recording global revenue of 4,293.80 million USD in 2025 across extensive-stage small cell lung cancer, urothelial carcinoma, and first-line hepatocellular carcinoma.
- Avelumab (Bavencio, Merck KGaA and Pfizer): Fully human IgG1 maintaining intact Fc-mediated ADCC capability, positioned in maintenance urothelial carcinoma and Merkel cell carcinoma.
- Sugemalimab (Zerjemei, CStone Pharmaceuticals): Full-length fully human IgG4 discovered via OmniRat transgenic platform, out-licensed across regional distribution channels in Europe, the Middle East, and Latin America.
- Cosibelimab (Unloxcyt, Fortress Biotech and Sun Pharmaceutical Industries): Fully human IgG1 with intact Fc-effector functions, cleared by the US FDA in December 2024 for advanced CSCC, providing a differentiated pricing paradigm within cutaneous oncology.
● Anti-CTLA-4 Monoclonal Antibodies:
- Ipilimumab (Yervoy, Bristol Myers Squibb): Fully human IgG1 antibody. Delivered 2.90 billion USD in 2025 global sales, reflecting a 15.00% year-over-year expansion, sustained entirely by dual-checkpoint combination regimens alongside Opdivo.
- Tremelimumab (Imjudo, AstraZeneca): Fully human IgG2 targeting CTLA-4, deployed as a single priming dose alongside Imfinzi (the STRIDE regimen) in advanced hepatocellular carcinoma and metastatic NSCLC.
● Novel Bispecific, Multispecific, and Next-Generation Constructs:
- Cadonilimab (AK104, Akeso, Inc.): First-in-class symmetrical tetravalent bispecific antibody targeting PD-1 and CTLA-4 simultaneously. Engineered with Fc-silencing mutations to reduce systemic toxicity while concentrating binding in the tumor microenvironment through high-avidity bispecific engagement. Generated commercial sales of 3,033.10 million RMB (422.00 million USD) in 2025, up 51.48% year-over-year, delivering 2,404.00 million RMB (334.47 million USD) in gross profits across cervical and first-line gastric malignancies.
- Ivonescimab (AK112, Akeso and Summit Therapeutics): First-in-class bispecific antibody targeting PD-1 and Vascular Endothelial Growth Factor A (VEGF-A). Demonstrates cooperative binding affinity, wherein binding to VEGF substantially enhances PD-1 binding avidity. Commercialized in China for EGFR-mutated NSCLC and first-line PD-L1 positive NSCLC, with US and European BLA development led by Summit Therapeutics.
- Envafolimab (KN035, Alphamab Oncology, 3D Medicines, and Simcere Pharmaceutical): Engineered single-domain antibody (VHH) fused to a human IgG1 Fc fragment, delivering high stability that permits ambient storage and rapid subcutaneous injection. Achieved 49.54 million USD in 2025 sales with gross margins of 92.10% across Chinese retail and hospital networks.
- Opdualag (Nivolumab and Relatlimab, Bristol Myers Squibb): Fixed-dose dual-checkpoint antibody targeting PD-1 and LAG-3, generating 1.19 billion USD in global 2025 sales, establishing the therapeutic viability of LAG-3 co-inhibition in advanced cutaneous melanoma.
- Tishtha (Zydus Lifesciences): Formally launched in India in January 2026 as the world's first commercially approved Nivolumab biosimilar, opening the price-competition window for checkpoint inhibitors.
PIPELINE ASSETS
Biopharmaceutical pipeline investments are heavily concentrated on circumventing checkpoint resistance, mitigating off-target immune-related toxicities, and constructing multi-targeted modalities.
● Anti-PD-1 and Anti-PD-L1 Innovation Pipeline:
Subcutaneous reformulations dominate the lifecycle preservation maneuvers of leading sponsors. Merck's Keytruda Qlex is undergoing global Phase 3 trials across lung, breast, and renal cohorts to solidify protection against impending intravenous biosimilar entries. Bristol Myers Squibb is validating Opdivo Qvantig in combination with Yervoy in Phase 3 registrational studies (CheckMate-1533).
Simultaneously, biosimilar programs are advancing rapidly: Shanghai Henlius Biotech initiated global Phase 1 evaluation of HLX17 (pembrolizumab biosimilar) under US FDA IND cleared protocols; Formycon and Zydus are progressing FYB206 through advanced regulatory review; Boan Biotech is completing late-stage development of BA1104. In novel modalities, Adlai Nortye is conducting Phase 1 multi-center trials for AN4005, an orally available small-molecule PD-L1 inhibitor designed to break the dependence on parenteral biologic infusions.
● Anti-CTLA-4 Masked and Microenvironment-Selective Formulations:
Due to high historical rates of grade 3/4 immune-related adverse events associated with systemic CTLA-4 blockade, next-generation engineering prioritizes conditionally activated antibodies.
- ADG126 (Muzastotug, Adagene): Employs SAFEbody technology, integrating a cleavable peptide mask covering the CTLA-4 binding domain that is selectively removed by matrix metalloproteinases abundant within the tumor microenvironment. Clinical proof-of-concept Phase 1b/2 studies demonstrate marked safety improvements and verified objective responses in microsatellite-stable (MSS) colorectal carcinoma in combination with pembrolizumab (FDA Fast Track designation), with active partnership evaluations alongside Sanofi (SAR445877 PD-1/IL-15) and Roche (triplet evaluation with Tecentriq and Avastin in HCC). Adagene is simultaneously advancing ADG116, an unmasked candidate engineered against a unique CTLA-4 epitope.
- Evalstotug (BA3071, BioAtla): Conditionally Active Biologic (CAB) anti-CTLA-4 antibody engineered to bind target selectively under the acidic extracellular conditions characteristic of glycolytic cancer microenvironments, halting binding under normal physiological pH to eliminate systemic autoimmune toxicity.
- Additional CTLA-4 Candidates: Harbour BioMed's heavy-chain-only antibody prusulimab (HBM4003) demonstrated an objective response rate of 34.80% in combination with tislelizumab in MSS colorectal cancer; Biocytogen is evaluating YH001; Sandoz and Henlius are executing Phase 1/3 global development for HLX13, an ipilimumab biosimilar; Merck is evaluating its co-formulated quavonlimab (MK-1308A).
● Bispecific and Multi-Target Checkpoint Pipeline:
- Pumitamig (BNT327 / BMS-986545, BioNTech and Bristol Myers Squibb): Bispecific construct targeting PD-L1 and VEGF-A. Entering extensive Phase 2 and 3 evaluations globally, prominently the ROSETTA Lung-02 study evaluating first-line NSCLC alongside chemotherapy against standard pembrolizumab regimens, representing the most direct Western validation of the PD-1/VEGF bispecific thesis.
- 707 (3SBio and Pfizer): Investigational PD-1 x VEGF bispecific construct progressing through Phase 2/3 development in China, with ex-China global development rights out-licensed to Pfizer in a transaction valued up to 1,311.43 million USD in upfront and milestone commitments.
- Multi-Specific Platforms: Compass Therapeutics is advancing CTX-8371 (a dual-targeting PD-1 x PD-L1 bispecific showing clinical complete responses) and CTX-10726 (tetravalent PD-1 x VEGF-A); AstraZeneca and Compugen are advancing Phase 3 clinical evaluations for rilvegostomig, an integrated PD-1 x TIGIT bispecific; CStone Pharmaceuticals is advancing CS2009 (tri-specific PD-1 x VEGF x CTLA-4) and CS5009 (bispecific ADC targeting B7-H3 and PD-L1); ImmuneOnco is advancing IMM2510 (PD-L1 x VEGF); Yuzhiyou Biopharma is studying Y101D (PD-L1 x TGF-beta); Adlai Nortye is advancing AN8025 (tri-specific targeting PD-L1, CD86, and LAG-3); Purple Biotech is preparing IND transitions for IM1240 and IM1305, tri-specific constructs engaging 5T4 or TROP2 simultaneously with CD3 and NKG2A.
● Novel Checkpoint Receptors and Resistance Reversal:
- Fianlimab (Regeneron Pharmaceuticals): Fully human anti-LAG-3 antibody, evaluated in registrational Phase 3 clinical trials combined with Libtayo (cemiplimab) across first-line metastatic melanoma and NSCLC.
- TIGIT Inhibitors: Domvanalimab (Arcus Biosciences and Gilead Sciences) continues evaluation in Phase 3 NSCLC (STAR-121 study), adjusting from development halts in upper gastrointestinal trials; Compugen continues development of COM902 and COM701 (anti-PVRIG).
- Interleukin and Chemokine Modulators: Compugen and Gilead are advancing GS-0321 (COM503), an anti-IL18BP monoclonal antibody restoring active endogenous IL-18 within the TME; Coherus Oncology is progressing casdozokitug (anti-IL-27) in HCC and tagmokitug (CHS-114, anti-CCR8) for targeted regulatory T-cell depletion; BioInvent International is validating BI-1206 (anti-Fc gamma RIIB) to reverse PD-1 resistance in combination with pembrolizumab, alongside BI-1808 (anti-TNFR2); Shanghai Junshi Biosciences is progressing tifcemalimab (JS004, anti-BTLA) through Phase 3 trials in extensive-stage SCLC; Xuanzhu Bio is evaluating KM602 (engineered CD80-Fc fusion protein).
DOWNSTREAM CLINICAL APPLICATIONS AND PATIENT ARCHITECTURE
Immune Checkpoint Inhibitors function as backbone therapeutic entities across more than 20 oncological indications, split between solid tumor entities and primary hematological malignancies.
● Primary Solid Tumor Landscape:
- Lung Carcinomas (Non-Small Cell and Small Cell): Represents the commercial core of the ICI therapeutic class, commanding over 35% of total therapeutic expenditure. Addressable metastatic NSCLC patient volumes in major developed markets exceed 315,000 patients annually, including approximately 50,000 newly diagnosed individuals in the United States. Keytruda, Opdivo, Imfinzi, Tecentriq, and Tevimbra serve as core systemic regimens. Strategic expansion has migrated swiftly upstream into Stage IB through IIIA resectable settings, where neoadjuvant and perioperative combinations drastically prolong duration of therapy (DoT). In small cell lung cancer (SCLC), anti-PD-L1 agents Imfinzi and Tecentriq, supplemented by Serplulimab, govern first-line systemic combinations.
- Gastrointestinal Malignancies:
1. Hepatocellular Carcinoma (HCC): Therapeutic standards center on combination immuno-oncology protocols, specifically Imfinzi plus Imjudo (the STRIDE regimen), Tecentriq plus bevacizumab, and Opdivo plus Yervoy. Cadonilimab and Ivonescimab are scaling presence across Asian patient cohorts.
2. Gastric and Gastroesophageal Junction (GEJ) / Esophageal Squamous Cell Carcinoma (ESCC): Established frontline standards integrate Keytruda, Opdivo, Tevimbra, or Tuoyi with fluoropyrimidine and platinum-based chemotherapy.
3. Colorectal Carcinoma (CRC): While microsatellite instability-high (MSI-H) or mismatch repair-deficient (dMMR) tumors respond robustly to Keytruda, Opdivo plus Yervoy, and Envafolimab, they represent under 5% of metastatic CRC. The primary competitive frontier is unlocking the 95% of patients presenting with microsatellite-stable (MSS) cold colorectal tumors, currently pursued via Adagene's masked CTLA-4 ADG126 and Coherus's anti-CCR8 tagmokitug.
- Genitourinary and Gynecological Malignancies:
1. Renal Cell Carcinoma (RCC): Frontline settings mandate checkpoint combinations, prominently Opdivo plus Yervoy, or anti-PD-1 agents paired with VEGFR tyrosine kinase inhibitors (Keytruda plus lenvatinib).
2. Urothelial and Bladder Cancers: Driven by Imfinzi, Tecentriq, and the standard-of-care combination of Padcev (enfortumab vedotin, an anti-Nectin-4 ADC) with Keytruda, which demonstrated historic survival improvements over standard gemcitabine-platinum chemotherapy.
3. Cervical and Endometrial Malignancies: Jemperli, Keytruda, and Akeso's bispecific Cadonilimab maintain definitive market positions in advanced dMMR and PD-L1 positive cohorts.
- Cutaneous and Other Solid Tumors: Metastatic melanoma remains the paradigm for checkpoint inhibition, led by Keytruda, Opdivo, Yervoy, and BMS's dual-agent Opdualag (nivolumab plus relatlimab). Non-melanoma skin carcinomas are addressed by cemiplimab, cosibelimab, and retifanlimab. Additional strong deployments include triple-negative breast cancer (TNBC) and recurrent head and neck squamous cell carcinoma (HNSCC).
● Primary Hematological Malignancies:
Hematologic applications exploit constitutive checkpoint overexpression driven by genetic alterations:
- Classical Hodgkin Lymphoma (cHL): Characterized by chromosome 9p24.1 amplification, resulting in extreme cell-surface overexpression of PD-L1 and PD-L2. Opdivo and Keytruda maintain core positions in relapsed/refractory cohorts, with emerging candidates such as Danburstotug (IMC-001) securing designated orphan clearances.
- Non-Hodgkin Lymphomas and Advanced Leukemias: Diffuse Large B-cell Lymphoma (DLBCL) and extranodal NK/T-cell lymphoma are systematically addressed by next-generation combinations, while relapsed/refractory multiple myeloma transitions toward T-cell engaging bispecifics (Tecvayli, Talvey) and cellular therapies, frequently explored in consolidative checkpoint schedules.
REGIONAL DYNAMICS AND TRADE ARCHITECTURE
● North America:
North America retains structural market dominance, generating over 50.00% of global pharmaceutical revenues derived from immune checkpoint inhibition. The United States represents the decisive locus of commercial profitability, governed by commercial payer receptivity, rapid adoption of early-stage neoadjuvant label indications, and swift penetration of high-margin combination regimens such as Padcev plus Keytruda. The market is exclusively wholesale-driven, characterized by rapid inventory turns and immediate specialty tier availability. However, legislative implementation of the Inflation Reduction Act introduces substantial structural shifts into long-term commercial models.
● Europe:
Europe ranks as the second-largest commercial theater, characterized by universal public healthcare systems, centralized regulatory marketing authorizations through the European Medicines Agency (EMA), and stringent health technology assessments (HTA) managed by national bodies, including NICE in the United Kingdom, the G-BA in Germany, and HAS in France. Reimbursement authorization hinges entirely on rigorous cost-effectiveness metrics and comparative overall survival benefits over existing generic or standard therapies. Net realized prices across major European markets (Germany, the UK, France, Italy, and Spain) average 40.00% to 55.00% below United States wholesale acquisition costs, limiting gross commercial revenue generation despite comparable patient treatment volumes.
● Asia-Pacific (APAC):
The Asia-Pacific region stands as the third-largest regional market and the fastest-growing volume corridor.
- China: Chinese oncology dynamics are uniquely bifurcated. Domestic biopharma innovation has achieved international parity, driven by indigenous breakthroughs from Akeso, Innovent, BeOne, Henlius, and Junshi. However, foreign biopharmaceutical majors encounter severe commercial pricing friction driven by annual National Reimbursement Drug List (NRDL) negotiations and National Volume-Based Procurement (VBP) policies. Domestic price discounting during NRDL onboarding routinely surpasses 60.00% to 80.00%, resulting in overall multi-national oncology sales growth decelerating to approximately 0.30% within China in 2025. Conversely, the introduction of the Commercial Health Insurance Innovative Drug List (CHIIDL) in early 2026 establishes an alternative reimbursement pathway for non-basic covered therapies.
- Japan: Serves as the largest mature value market in the Asia-Pacific territory, utilizing a biennial price-revision framework tied directly to volume expansion triggers, housing major native innovators including Ono Pharmaceutical.
- India: Expanding as a dual market for lower-cost biosimilar deployment and clinical research. The launch of the world's first nivolumab biosimilar (Tishtha by Zydus) marks India as the initial proving ground for price-disruptive checkpoint competition. Domestic giants including Sun Pharma, Zydus, and Biocon lead local distribution and global export operations.
- Republic of Korea: Highly sophisticated clinical development and commercial market driven by domestic champions such as Celltrion, Samsung Epis, and Daewoong Pharmaceutical, with biotechs such as ImmuneOncia pioneering first-in-human checkpoint assets.
- Taiwan, China: Functions as an advanced clinical validation center, with innovators like PharmaEssentia progressing novel immuno-oncology combinations (P1801 with ropeginterferon alfa-2b).
● Latin America (LATAM):
Latin America ranks as the fourth-largest global market, anchored by Brazil and Mexico. The operational landscape is characterized by a two-tiered healthcare infrastructure: private healthcare systems absorb innovative checkpoint therapies rapidly at pricing benchmarks approaching European levels, whereas public health systems operate under fiscal constraints and centralized tender structures. Sourcing strategies focus increasingly on securing commercial supply through regional licensing agreements with Asian biopharma innovators, such as CStone's partnerships for sugemalimab and Junshi's partnerships with Dr. Reddy's.
● Middle East and Africa (MEA):
The MEA territory represents the fifth-largest commercial zone, displaying extreme internal divergence. The Gulf Cooperation Council (GCC) nations (prominently Saudi Arabia and the United Arab Emirates) maintain state-funded healthcare models providing rapid, premium-priced access to cutting-edge biologics. Global licensing models and specialized marketing partnerships drive commercial penetration, exemplified by Biocon's market leadership across biosimilar categories in Saudi Arabia and Formycon's expansion agreements into Sub-Saharan territories, balanced against high unmet needs and tender-driven generic demand throughout North Africa.
STRUCTURAL SHIFTS AND BOTTLENECK RESILIENCE
The immune checkpoint inhibitor market is entering a pivotal transformation phase between 2026 and 2031, characterized by the convergence of major patent expirations, regulatory-mandated pricing compressions, and rapid technological succession.
● The Subcutaneous Delivery Conversion Arbitrage:
The biopharmaceutical landscape is deploying high-concentration subcutaneous (SC) reformulations to construct durable defensive moats ahead of impending intravenous Loss of Exclusivity (LOE). Intravenous infusions of pembrolizumab or nivolumab require 30 to 60 minutes of clinical infusion-chair time, plus extensive pharmacy compounding and venous catheter access. By co-formulating monoclonal antibodies with recombinant human hyaluronidase (such as in Keytruda Qlex and Opdivo Qvantig), administration duration collapses to under five minutes via rapid subcutaneous push.
This conversion yields dual benefits: it mitigates capacity constraints in hospital infusion centers, improving overall patient satisfaction, while establishing independent secondary formulation patents extending into the late 2030s and 2040s. Biopharma sponsors that convert upwards of 50% of their existing intravenous patient base to subcutaneous maintenance schedules will effectively bludgeon generic intravenous biosimilar erosion, maintaining pricing discipline and patient retention.
● The Bispecific Supremacy Transition:
The clinical supremacy established by bispecific antibodies represents the most disruptive technological threat to traditional monotherapy checkpoint inhibitors. First-generation checkpoint monotherapy exhibits ceiling effects, with objective response rates plateauing between 20% and 35% across unselected solid tumors due to redundant immunosuppressive pathways. Bispecific constructs address this bottleneck through cooperative avidity mechanisms.
Akeso's Ivonescimab and BioNTech/BMS's Pumitamig demonstrate that simultaneous blockade of the PD-1/PD-L1 pathway and VEGF-A downregulates local tumor vascular permeability, reverses endothelial cell-mediated T-cell exclusion, and alters the immunosuppressive microenvironment concurrently. This biological synergy translates directly into superior head-to-head clinical efficacy over standard-of-care monospecific blockbusters. Consequently, the commercial locus of value within the checkpoint sector will shift decisively from monospecific anti-PD-1 agents toward dual-targeting bispecific and tri-specific platforms by 2031.
● The Impending Biosimilar Influx and Pricing Erosion:
Between 2028 and 2031, composition-of-matter protections covering the foundational checkpoint inhibitors (pembrolizumab, nivolumab, ipilimumab) will reach statutory expiration across major Western jurisdictions. Highly capitalized biosimilar developers—including Celltrion, Formycon, Samsung Epis, Sandoz, and Zydus Lifesciences—are advancing late-stage biosimilar candidates. The launch of Tishtha in India in early 2026 confirms that biosimilar checkpoint entries will introduce substantial pricing discounts, forcing rapid price adjustments across off-patent original biologics.
Concurrently, the Medicare Part B drug price negotiation mechanisms mandated by the US Inflation Reduction Act will trigger statutory price cuts exceeding 50% to 65% for top-expenditure checkpoint biologics as they enter active negotiation cycles from 2028 onward. This sovereign pricing intervention compresses gross commercial margins, accelerating the need for continuous portfolio evolution.
● ADC-Immunotherapy Convergence:
The fastest-growing segment of clinical combination protocols is the synergistic combination of immune checkpoint inhibitors with target-directed Antibody-Drug Conjugates (ADCs). Monospecific checkpoint inhibitors frequently fail in cold tumors devoid of pre-existing immune infiltrates. When paired with cytotoxic ADCs—such as the transformative pairing of Padcev (enfortumab vedotin) with Keytruda in bladder cancer, or combinations involving Trodelvy and datopotamab deruxtecan—the targeted payload induces immunogenic cell death (ICD).
This localized cytotoxic lysis unleashes a cascade of tumor-associated neoantigens, activating local antigen-presenting cells and priming cytotoxic T-lymphocytes, converting immunologically cold tumor beds into highly responsive microenvironments. This synergy enhances therapeutic duration and cements checkpoint inhibitors as essential companion backbones for next-generation cytotoxic conjugates.
1.1 Research Architecture, Scope, and Immune Checkpoint Inhibitor Taxonomy 1
1.2 Primary Research Methodology, KOL Delphi Panels, and Clinical Investigator Consultations 2
1.3 Secondary Data Filtration, Pharmacovigilance Repositories, and Clinical Trial Registry Audits 3
1.4 Bottom-Up and Top-Down Market Sizing, Econometric Reconciliation, and Forecasting Models 4
1.5 Macroeconomic Baselines, Currency Normalization, and Core Analytical Assumptions (2021-2031) 5
1.6 Acronyms, Standard Nomenclature, and Indication Classification Index 6
Chapter 2 Global Immune Checkpoint Inhibitor Market Landscape and Strategic Architecture 7
2.1 Global Market Valuation, Dosage Volume Dynamics, and Trajectory Analysis (2021-2031) 7
2.2 Immuno-Oncology Paradigm Shifts: First-Line Monotherapy vs Multiplexed Checkpoint Blockade 9
2.3 Average Selling Price (ASP) Dynamics, Contracting Realities, and Net Effective Pricing Erosion 11
2.4 Strategic Competitive Benchmarking: Monospecific Antibodies vs Next-Generation Modulators 13
Chapter 3 Upstream Supply Chain, Biomanufacturing Infrastructure, and Value Chain Economics 15
3.1 Upstream Bioprocessing: Master Cell Line Engineering (CHO Systems) and Expression Titers 15
3.2 Chemically Defined Media, Single-Use Bioreactor Technologies, and Feed Sourcing Risks 17
3.3 Downstream Bioseparation: Protein A Affinity Chromatography, Purification Resins, and Viral Filtration 19
3.4 Sterile Fill-Finish Operations, Cold-Chain Distribution, and Aseptic Secondary Packaging 20
3.5 Value Chain Decomposition: Cost-of-Goods-Sold (COGS) Breakdown and Margin Distribution Pools 21
Chapter 4 Regulatory Policy, Loss of Exclusivity Timelines, and Biosimilar Dynamics 23
4.1 Global Regulatory Approval Frameworks: FDA BLA, EMA Centralized Procedure, and NMPA Expedited Review 23
4.2 Biomarker Standardization: Companion Diagnostics (PD-L1 IHC, MSI-H/dMMR, TMB) and Accelerated Approvals 25
4.3 Loss of Exclusivity (LoE) Horizons and Patent Cliff Vulnerability Matrix (2026-2031) 27
4.4 Biosimilar Penetration Pathways, Interchangeability Classifications, and Price Deflation Curves 28
Chapter 5 Global Market Breakdown by Receptor Target Mechanism 30
5.1 Anti-PD-1 Monoclonal Antibodies 30
5.1.1 Mechanism of Action, Approved Indications, and Market Sizing (2021-2031) 31
5.1.2 Clinical Differentiation, Dosing Schedules, and Combination Regimens 32
5.2 Anti-PD-L1 Monoclonal Antibodies 33
5.2.1 Tumor Microenvironment Infiltration Dynamics and Revenue Sizing (2021-2031) 33
5.2.2 Comparative Efficacy, Target Engagement, and Off-Target Toxicity Profiles 34
5.3 Anti-CTLA-4 Monoclonal Antibodies 35
5.3.1 Dual Checkpoint Synergy, Toxicity Management Protocols, and Valuation (2021-2031) 35
5.3.2 Next-Generation Fc-Engineered CTLA-4 Candidates and Half-Life Optimization 36
5.4 Novel Monospecific and Co-Inhibitory Receptor Modulators 37
5.4.1 LAG-3, TIGIT, TIM-3, and VISTA Targeted Therapeutics 37
5.4.2 Costimulatory and Emerging Checkpoint Targets (B7-H3, CD47, OX40, GITR) 38
Chapter 6 Global Market Breakdown by Clinical Indication and Downstream Application 39
6.1 Primary Solid Tumors 39
6.1.1 Lung Cancer (Non-Small Cell Lung Cancer and Small Cell Lung Cancer) 40
6.1.2 Gastrointestinal Cancer (Colorectal, Gastric/GEJ, Esophageal, and Hepatocellular Carcinoma) 42
6.1.3 Genitourinary and Gynecological Cancers (Renal Cell, Urothelial/Bladder, Cervical, and Endometrial) 44
6.1.4 Other Solid Tumors (Melanoma, Triple-Negative Breast Cancer, SCCHN, and Merkel Cell Carcinoma) 46
6.2 Primary Hematological Malignancies 47
6.2.1 Classical Hodgkin Lymphoma and Primary Mediastinal Large B-Cell Lymphoma 47
6.2.2 Non-Hodgkin Lymphomas, Relapsed/Refractory Multiple Myeloma, and Acute Leukemias 48
Chapter 7 Commercial Distribution Channels and Healthcare Delivery Systems 49
7.1 Inpatient Hospital Pharmacies and Comprehensive Cancer Centers 49
7.2 Outpatient Oncology Infusion Clinics and Ambulatory Surgical Centers 51
7.3 Specialty Biopharmaceutical Pharmacies and Integrated Closed-Loop Networks 53
7.4 Global Payer Frameworks: CMS Reimbursement, EU DRG Tariffs, and China NRDL Dynamic Inclusion 54
Chapter 8 Global Biopharmaceutical Production Hubs and Cross-Border Trade Flows 56
8.1 Global Biomanufacturing Footprint and Installed Bioreactor Capacity Distribution 56
8.2 North America Production Center: United States Biomanufacturing Corridors 57
8.3 European Biomanufacturing Hubs: Ireland, Switzerland, Germany, and Belgium 58
8.4 Asia-Pacific Production Hubs: China, South Korea, Singapore, Japan, and India 59
8.5 Bulk Drug Substance (BDS) Logistics, Cold-Chain Tariffs, and Trade Policy Vulnerabilities 60
Chapter 9 Geographic Consumption Breakdown and Regional Market Analytics 62
9.1 North America Market 62
9.1.1 United States 62
9.1.2 Canada 63
9.2 Europe Market 63
9.2.1 Germany 63
9.2.2 France 64
9.2.3 United Kingdom 64
9.2.4 Italy 64
9.2.5 Spain 65
9.2.6 Switzerland & Rest of Europe 65
9.3 Asia-Pacific Market 65
9.3.1 China 65
9.3.2 Japan 66
9.3.3 South Korea 66
9.3.4 India 66
9.3.5 Australia 67
9.3.6 Taiwan (China) 67
9.4 Latin America Market 67
9.4.1 Brazil 67
9.4.2 Mexico 68
9.5 Middle East and Africa 68
9.5.1 Saudi Arabia 68
9.5.2 United Arab Emirates 68
9.5.3 South Africa 68
Chapter 10 Corporate Competitive Intelligence: Commercialized Immune Checkpoint Inhibitor Manufacturers 69
10.1 AstraZeneca 69
10.1.1 Corporate Profile, Oncology Infrastructure, and Biomanufacturing Scale 69
10.1.2 Strategic SWOT Analysis 70
10.1.3 Immune Checkpoint Inhibitor Revenue, Cost, Gross Margin, and Market Share 71
10.2 Roche 72
10.2.1 Corporate Profile, Oncology Infrastructure, and Biomanufacturing Scale 72
10.2.2 Strategic SWOT Analysis 73
10.2.3 Immune Checkpoint Inhibitor Revenue, Cost, Gross Margin, and Market Share 74
10.3 Sanofi 75
10.3.1 Corporate Profile, Oncology Infrastructure, and Biomanufacturing Scale 75
10.3.2 Strategic SWOT Analysis 76
10.3.3 Immune Checkpoint Inhibitor Revenue, Cost, Gross Margin, and Market Share 77
10.4 Merck & Co. 78
10.4.1 Corporate Profile, Oncology Infrastructure, and Biomanufacturing Scale 78
10.4.2 Strategic SWOT Analysis 79
10.4.3 Immune Checkpoint Inhibitor Revenue, Cost, Gross Margin, and Market Share 80
10.5 Merck KGaA 81
10.5.1 Corporate Profile, Oncology Infrastructure, and Biomanufacturing Scale 81
10.5.2 Strategic SWOT Analysis 82
10.5.3 Immune Checkpoint Inhibitor Revenue, Cost, Gross Margin, and Market Share 83
10.6 Pfizer 84
10.6.1 Corporate Profile, Oncology Infrastructure, and Biomanufacturing Scale 84
10.6.2 Strategic SWOT Analysis 85
10.6.3 Immune Checkpoint Inhibitor Revenue, Cost, Gross Margin, and Market Share 86
10.7 BeOne Medicines 87
10.7.1 Corporate Profile, Oncology Infrastructure, and Biomanufacturing Scale 87
10.7.2 Strategic SWOT Analysis 88
10.7.3 Immune Checkpoint Inhibitor Revenue, Cost, Gross Margin, and Market Share 89
10.8 Bristol Myers Squibb (BMS) 90
10.8.1 Corporate Profile, Oncology Infrastructure, and Biomanufacturing Scale 90
10.8.2 Strategic SWOT Analysis 91
10.8.3 Immune Checkpoint Inhibitor Revenue, Cost, Gross Margin, and Market Share 92
10.9 Ono Pharmaceutical 93
10.9.1 Corporate Profile, Oncology Infrastructure, and Biomanufacturing Scale 93
10.9.2 Strategic SWOT Analysis 94
10.9.3 Immune Checkpoint Inhibitor Revenue, Cost, Gross Margin, and Market Share 95
10.10 Regeneron Pharmaceuticals 96
10.10.1 Corporate Profile, Oncology Infrastructure, and Biomanufacturing Scale 96
10.10.2 Strategic SWOT Analysis 97
10.10.3 Immune Checkpoint Inhibitor Revenue, Cost, Gross Margin, and Market Share 98
10.11 Coherus Oncology Inc. 99
10.11.1 Corporate Profile, Oncology Infrastructure, and Biomanufacturing Scale 99
10.11.2 Strategic SWOT Analysis 100
10.11.3 Immune Checkpoint Inhibitor Revenue, Cost, Gross Margin, and Market Share 101
10.12 Fortress Biotech Inc. 102
10.12.1 Corporate Profile, Oncology Infrastructure, and Biomanufacturing Scale 102
10.12.2 Strategic SWOT Analysis 103
10.12.3 Immune Checkpoint Inhibitor Revenue, Cost, Gross Margin, and Market Share 104
10.13 GSK plc 105
10.13.1 Corporate Profile, Oncology Infrastructure, and Biomanufacturing Scale 105
10.13.2 Strategic SWOT Analysis 106
10.13.3 Immune Checkpoint Inhibitor Revenue, Cost, Gross Margin, and Market Share 107
10.14 INCYTE CORPORATION 108
10.14.1 Corporate Profile, Oncology Infrastructure, and Biomanufacturing Scale 108
10.14.2 Strategic SWOT Analysis 109
10.14.3 Immune Checkpoint Inhibitor Revenue, Cost, Gross Margin, and Market Share 110
10.15 Jiangsu Hengrui Pharmaceuticals 111
10.15.1 Corporate Profile, Oncology Infrastructure, and Biomanufacturing Scale 111
10.15.2 Strategic SWOT Analysis 112
10.15.3 Immune Checkpoint Inhibitor Revenue, Cost, Gross Margin, and Market Share 113
10.16 Lepu Biopharma 114
10.16.1 Corporate Profile, Oncology Infrastructure, and Biomanufacturing Scale 114
10.16.2 Strategic SWOT Analysis 115
10.16.3 Immune Checkpoint Inhibitor Revenue, Cost, Gross Margin, and Market Share 116
10.17 Shanghai Henlius Biotech 117
10.17.1 Corporate Profile, Oncology Infrastructure, and Biomanufacturing Scale 117
10.17.2 Strategic SWOT Analysis 118
10.17.3 Immune Checkpoint Inhibitor Revenue, Cost, Gross Margin, and Market Share 119
10.18 Shanghai Junshi Biosciences 120
10.18.1 Corporate Profile, Oncology Infrastructure, and Biomanufacturing Scale 120
10.18.2 Strategic SWOT Analysis 121
10.18.3 Immune Checkpoint Inhibitor Revenue, Cost, Gross Margin, and Market Share 122
10.19 Sichuan Kelun Pharmaceutical 123
10.19.1 Corporate Profile, Oncology Infrastructure, and Biomanufacturing Scale 123
10.19.2 Strategic SWOT Analysis 124
10.19.3 Immune Checkpoint Inhibitor Revenue, Cost, Gross Margin, and Market Share 125
10.20 Simcere Pharmaceutical 126
10.20.1 Corporate Profile, Oncology Infrastructure, and Biomanufacturing Scale 126
10.20.2 Strategic SWOT Analysis 127
10.20.3 Immune Checkpoint Inhibitor Revenue, Cost, Gross Margin, and Market Share 128
10.21 Sino Biopharmaceutical Limited 129
10.21.1 Corporate Profile, Oncology Infrastructure, and Biomanufacturing Scale 129
10.21.2 Strategic SWOT Analysis 130
10.21.3 Immune Checkpoint Inhibitor Revenue, Cost, Gross Margin, and Market Share 131
10.22 Sun Pharmaceutical Industries Ltd 132
10.22.1 Corporate Profile, Oncology Infrastructure, and Biomanufacturing Scale 132
10.22.2 Strategic SWOT Analysis 133
10.22.3 Immune Checkpoint Inhibitor Revenue, Cost, Gross Margin, and Market Share 134
10.23 Innovent Biologics 135
10.23.1 Corporate Profile, Oncology Infrastructure, and Biomanufacturing Scale 135
10.23.2 Strategic SWOT Analysis 136
10.23.3 Immune Checkpoint Inhibitor Revenue, Cost, Gross Margin, and Market Share 137
10.24 Akeso 138
10.24.1 Corporate Profile, Oncology Infrastructure, and Biomanufacturing Scale 138
10.24.2 Strategic SWOT Analysis 139
10.24.3 Immune Checkpoint Inhibitor Revenue, Cost, Gross Margin, and Market Share 140
10.25 3D Medicines 141
10.25.1 Corporate Profile, Oncology Infrastructure, and Biomanufacturing Scale 141
10.25.2 Strategic SWOT Analysis 142
10.25.3 Immune Checkpoint Inhibitor Revenue, Cost, Gross Margin, and Market Share 143
10.26 Alphamab Oncology 144
10.26.1 Corporate Profile, Oncology Infrastructure, and Biomanufacturing Scale 144
10.26.2 Strategic SWOT Analysis 145
10.26.3 Immune Checkpoint Inhibitor Revenue, Cost, Gross Margin, and Market Share 146
10.27 CStone Pharmaceuticals 147
10.27.1 Corporate Profile, Oncology Infrastructure, and Biomanufacturing Scale 147
10.27.2 Strategic SWOT Analysis 148
10.27.3 Immune Checkpoint Inhibitor Revenue, Cost, Gross Margin, and Market Share 149
10.28 Lee's Pharmaceutical 150
10.28.1 Corporate Profile, Oncology Infrastructure, and Biomanufacturing Scale 150
10.28.2 Strategic SWOT Analysis 151
10.28.3 Immune Checkpoint Inhibitor Revenue, Cost, Gross Margin, and Market Share 152
10.29 Sandoz 153
10.29.1 Corporate Profile, Oncology Infrastructure, and Biomanufacturing Scale 153
10.29.2 Strategic SWOT Analysis 154
10.29.3 Immune Checkpoint Inhibitor Revenue, Cost, Gross Margin, and Market Share 155
10.30 Celltrion 156
10.30.1 Corporate Profile, Oncology Infrastructure, and Biomanufacturing Scale 156
10.30.2 Strategic SWOT Analysis 157
10.30.3 Immune Checkpoint Inhibitor Revenue, Cost, Gross Margin, and Market Share 158
10.31 Beijing SinoCellTech Group 159
10.31.1 Corporate Profile, Oncology Infrastructure, and Biomanufacturing Scale 159
10.31.2 Strategic SWOT Analysis 160
10.31.3 Immune Checkpoint Inhibitor Revenue, Cost, Gross Margin, and Market Share 161
10.32 CSPC Pharmaceutical Group 162
10.32.1 Corporate Profile, Oncology Infrastructure, and Biomanufacturing Scale 162
10.32.2 Strategic SWOT Analysis 163
10.32.3 Immune Checkpoint Inhibitor Revenue, Cost, Gross Margin, and Market Share 164
10.33 Zydus Lifesciences 165
10.33.1 Corporate Profile, Oncology Infrastructure, and Biomanufacturing Scale 165
10.33.2 Strategic SWOT Analysis 166
10.33.3 Immune Checkpoint Inhibitor Revenue, Cost, Gross Margin, and Market Share 167
Chapter 11 Corporate Competitive Intelligence: Pipeline Developers and Clinical-Stage Innovators 168
11.1 AbbVie 168
11.1.1 Corporate Profile, Oncology Clinical Assets, and Trial Infrastructure 168
11.1.2 Strategic SWOT Analysis 169
11.1.3 Immune Checkpoint Inhibitor R&D Allocation, Cost Structure, and Market Potential 170
11.2 Amgen 171
11.2.1 Corporate Profile, Oncology Clinical Assets, and Trial Infrastructure 171
11.2.2 Strategic SWOT Analysis 172
11.2.3 Immune Checkpoint Inhibitor R&D Allocation, Cost Structure, and Market Potential 173
11.3 Bayer 174
11.3.1 Corporate Profile, Oncology Clinical Assets, and Trial Infrastructure 174
11.3.2 Strategic SWOT Analysis 175
11.3.3 Immune Checkpoint Inhibitor R&D Allocation, Cost Structure, and Market Potential 176
11.4 Novartis AG 177
11.4.1 Corporate Profile, Oncology Clinical Assets, and Trial Infrastructure 177
11.4.2 Strategic SWOT Analysis 178
11.4.3 Immune Checkpoint Inhibitor R&D Allocation, Cost Structure, and Market Potential 179
11.5 Biocytogen Pharmaceuticals 180
11.5.1 Corporate Profile, Oncology Clinical Assets, and Trial Infrastructure 180
11.5.2 Strategic SWOT Analysis 181
11.5.3 Immune Checkpoint Inhibitor R&D Allocation, Cost Structure, and Market Potential 182
11.6 BioNTech SE 183
11.6.1 Corporate Profile, Oncology Clinical Assets, and Trial Infrastructure 183
11.6.2 Strategic SWOT Analysis 184
11.6.3 Immune Checkpoint Inhibitor R&D Allocation, Cost Structure, and Market Potential 185
11.7 Daewoong Pharmaceutical 186
11.7.1 Corporate Profile, Oncology Clinical Assets, and Trial Infrastructure 186
11.7.2 Strategic SWOT Analysis 187
11.7.3 Immune Checkpoint Inhibitor R&D Allocation, Cost Structure, and Market Potential 188
11.8 Exelixis 189
11.8.1 Corporate Profile, Oncology Clinical Assets, and Trial Infrastructure 189
11.8.2 Strategic SWOT Analysis 190
11.8.3 Immune Checkpoint Inhibitor R&D Allocation, Cost Structure, and Market Potential 191
11.9 Gilead Sciences 192
11.9.1 Corporate Profile, Oncology Clinical Assets, and Trial Infrastructure 192
11.9.2 Strategic SWOT Analysis 193
11.9.3 Immune Checkpoint Inhibitor R&D Allocation, Cost Structure, and Market Potential 194
11.10 3SBio Inc. 195
11.10.1 Corporate Profile, Oncology Clinical Assets, and Trial Infrastructure 195
11.10.2 Strategic SWOT Analysis 196
11.10.3 Immune Checkpoint Inhibitor R&D Allocation, Cost Structure, and Market Potential 197
11.11 HUTCHMED (China) Ltd. 198
11.11.1 Corporate Profile, Oncology Clinical Assets, and Trial Infrastructure 198
11.11.2 Strategic SWOT Analysis 199
11.11.3 Immune Checkpoint Inhibitor R&D Allocation, Cost Structure, and Market Potential 200
11.12 ImmuneOncia Therapeutics 201
11.12.1 Corporate Profile, Oncology Clinical Assets, and Trial Infrastructure 201
11.12.2 Strategic SWOT Analysis 202
11.12.3 Immune Checkpoint Inhibitor R&D Allocation, Cost Structure, and Market Potential 203
11.13 ImmunityBio Inc. 204
11.13.1 Corporate Profile, Oncology Clinical Assets, and Trial Infrastructure 204
11.13.2 Strategic SWOT Analysis 205
11.13.3 Immune Checkpoint Inhibitor R&D Allocation, Cost Structure, and Market Potential 206
11.14 Iovance Biotherapeutics 207
11.14.1 Corporate Profile, Oncology Clinical Assets, and Trial Infrastructure 207
11.14.2 Strategic SWOT Analysis 208
11.14.3 Immune Checkpoint Inhibitor R&D Allocation, Cost Structure, and Market Potential 209
11.15 Ipsen S.A. 210
11.15.1 Corporate Profile, Oncology Clinical Assets, and Trial Infrastructure 210
11.15.2 Strategic SWOT Analysis 211
11.15.3 Immune Checkpoint Inhibitor R&D Allocation, Cost Structure, and Market Potential 212
11.16 JEIL Pharmaceutical 213
11.16.1 Corporate Profile, Oncology Clinical Assets, and Trial Infrastructure 213
11.16.2 Strategic SWOT Analysis 214
11.16.3 Immune Checkpoint Inhibitor R&D Allocation, Cost Structure, and Market Potential 215
11.17 Shenzhen Chipscreen Biosciences 216
11.17.1 Corporate Profile, Oncology Clinical Assets, and Trial Infrastructure 216
11.17.2 Strategic SWOT Analysis 217
11.17.3 Immune Checkpoint Inhibitor R&D Allocation, Cost Structure, and Market Potential 218
11.18 Sichuan Biokin Pharmaceutical 219
11.18.1 Corporate Profile, Oncology Clinical Assets, and Trial Infrastructure 219
11.18.2 Strategic SWOT Analysis 220
11.18.3 Immune Checkpoint Inhibitor R&D Allocation, Cost Structure, and Market Potential 221
11.19 Tonix Pharmaceuticals 222
11.19.1 Corporate Profile, Oncology Clinical Assets, and Trial Infrastructure 222
11.19.2 Strategic SWOT Analysis 223
11.19.3 Immune Checkpoint Inhibitor R&D Allocation, Cost Structure, and Market Potential 224
11.20 Harbour BioMed 225
11.20.1 Corporate Profile, Oncology Clinical Assets, and Trial Infrastructure 225
11.20.2 Strategic SWOT Analysis 226
11.20.3 Immune Checkpoint Inhibitor R&D Allocation, Cost Structure, and Market Potential 227
11.21 Leads Biolabs 228
11.21.1 Corporate Profile, Oncology Clinical Assets, and Trial Infrastructure 228
11.21.2 Strategic SWOT Analysis 229
11.21.3 Immune Checkpoint Inhibitor R&D Allocation, Cost Structure, and Market Potential 230
11.22 ImmuneOnco 231
11.22.1 Corporate Profile, Oncology Clinical Assets, and Trial Infrastructure 231
11.22.2 Strategic SWOT Analysis 232
11.22.3 Immune Checkpoint Inhibitor R&D Allocation, Cost Structure, and Market Potential 233
11.23 Antengene 234
11.23.1 Corporate Profile, Oncology Clinical Assets, and Trial Infrastructure 234
11.23.2 Strategic SWOT Analysis 235
11.23.3 Immune Checkpoint Inhibitor R&D Allocation, Cost Structure, and Market Potential 236
11.24 DualityBio 237
11.24.1 Corporate Profile, Oncology Clinical Assets, and Trial Infrastructure 237
11.24.2 Strategic SWOT Analysis 238
11.24.3 Immune Checkpoint Inhibitor R&D Allocation, Cost Structure, and Market Potential 239
11.25 Transcenta 240
11.25.1 Corporate Profile, Oncology Clinical Assets, and Trial Infrastructure 240
11.25.2 Strategic SWOT Analysis 241
11.25.3 Immune Checkpoint Inhibitor R&D Allocation, Cost Structure, and Market Potential 242
11.26 Adlai Nortye 243
11.26.1 Corporate Profile, Oncology Clinical Assets, and Trial Infrastructure 243
11.26.2 Strategic SWOT Analysis 244
11.26.3 Immune Checkpoint Inhibitor R&D Allocation, Cost Structure, and Market Potential 245
11.27 HanX Biopharma 246
11.27.1 Corporate Profile, Oncology Clinical Assets, and Trial Infrastructure 246
11.27.2 Strategic SWOT Analysis 247
11.27.3 Immune Checkpoint Inhibitor R&D Allocation, Cost Structure, and Market Potential 248
11.28 YZY Biopharma 249
11.28.1 Corporate Profile, Oncology Clinical Assets, and Trial Infrastructure 249
11.28.2 Strategic SWOT Analysis 250
11.28.3 Immune Checkpoint Inhibitor R&D Allocation, Cost Structure, and Market Potential 251
11.29 RemeGen 252
11.29.1 Corporate Profile, Oncology Clinical Assets, and Trial Infrastructure 252
11.29.2 Strategic SWOT Analysis 253
11.29.3 Immune Checkpoint Inhibitor R&D Allocation, Cost Structure, and Market Potential 254
11.30 Mabpharm 255
11.30.1 Corporate Profile, Oncology Clinical Assets, and Trial Infrastructure 255
11.30.2 Strategic SWOT Analysis 256
11.30.3 Immune Checkpoint Inhibitor R&D Allocation, Cost Structure, and Market Potential 257
11.31 Apollomics 258
11.31.1 Corporate Profile, Oncology Clinical Assets, and Trial Infrastructure 258
11.31.2 Strategic SWOT Analysis 259
11.31.3 Immune Checkpoint Inhibitor R&D Allocation, Cost Structure, and Market Potential 260
11.32 Replimune Group 261
11.32.1 Corporate Profile, Oncology Clinical Assets, and Trial Infrastructure 261
11.32.2 Strategic SWOT Analysis 262
11.32.3 Immune Checkpoint Inhibitor R&D Allocation, Cost Structure, and Market Potential 263
11.33 Transgene 264
11.33.1 Corporate Profile, Oncology Clinical Assets, and Trial Infrastructure 264
11.33.2 Strategic SWOT Analysis 265
11.33.3 Immune Checkpoint Inhibitor R&D Allocation, Cost Structure, and Market Potential 266
11.34 BioInvent International AB 267
11.34.1 Corporate Profile, Oncology Clinical Assets, and Trial Infrastructure 267
11.34.2 Strategic SWOT Analysis 268
11.34.3 Immune Checkpoint Inhibitor R&D Allocation, Cost Structure, and Market Potential 269
11.35 TransCode Therapeutics 270
11.35.1 Corporate Profile, Oncology Clinical Assets, and Trial Infrastructure 270
11.35.2 Strategic SWOT Analysis 271
11.35.3 Immune Checkpoint Inhibitor R&D Allocation, Cost Structure, and Market Potential 272
11.36 PharmaEssentia 273
11.36.1 Corporate Profile, Oncology Clinical Assets, and Trial Infrastructure 273
11.36.2 Strategic SWOT Analysis 274
11.36.3 Immune Checkpoint Inhibitor R&D Allocation, Cost Structure, and Market Potential 275
11.37 Xuanzhu Biopharm 276
11.37.1 Corporate Profile, Oncology Clinical Assets, and Trial Infrastructure 276
11.37.2 Strategic SWOT Analysis 277
11.37.3 Immune Checkpoint Inhibitor R&D Allocation, Cost Structure, and Market Potential 278
11.38 AskGene 279
11.38.1 Corporate Profile, Oncology Clinical Assets, and Trial Infrastructure 279
11.38.2 Strategic SWOT Analysis 280
11.38.3 Immune Checkpoint Inhibitor R&D Allocation, Cost Structure, and Market Potential 281
11.39 Kintor Pharm 282
11.39.1 Corporate Profile, Oncology Clinical Assets, and Trial Infrastructure 282
11.39.2 Strategic SWOT Analysis 283
11.39.3 Immune Checkpoint Inhibitor R&D Allocation, Cost Structure, and Market Potential 284
11.40 Sana Biotechnology 285
11.40.1 Corporate Profile, Oncology Clinical Assets, and Trial Infrastructure 285
11.40.2 Strategic SWOT Analysis 286
11.40.3 Immune Checkpoint Inhibitor R&D Allocation, Cost Structure, and Market Potential 287
11.41 Imugene 288
11.41.1 Corporate Profile, Oncology Clinical Assets, and Trial Infrastructure 288
11.41.2 Strategic SWOT Analysis 289
11.41.3 Immune Checkpoint Inhibitor R&D Allocation, Cost Structure, and Market Potential 290
11.42 Adagene 291
11.42.1 Corporate Profile, Oncology Clinical Assets, and Trial Infrastructure 291
11.42.2 Strategic SWOT Analysis 292
11.42.3 Immune Checkpoint Inhibitor R&D Allocation, Cost Structure, and Market Potential 293
11.43 ALX Oncology 294
11.43.1 Corporate Profile, Oncology Clinical Assets, and Trial Infrastructure 294
11.43.2 Strategic SWOT Analysis 295
11.43.3 Immune Checkpoint Inhibitor R&D Allocation, Cost Structure, and Market Potential 296
11.44 Arcus Biosciences 297
11.44.1 Corporate Profile, Oncology Clinical Assets, and Trial Infrastructure 297
11.44.2 Strategic SWOT Analysis 298
11.44.3 Immune Checkpoint Inhibitor R&D Allocation, Cost Structure, and Market Potential 299
11.45 BioAtla 300
11.45.1 Corporate Profile, Oncology Clinical Assets, and Trial Infrastructure 300
11.45.2 Strategic SWOT Analysis 301
11.45.3 Immune Checkpoint Inhibitor R&D Allocation, Cost Structure, and Market Potential 302
11.46 Bolt Biotherapeutics 303
11.46.1 Corporate Profile, Oncology Clinical Assets, and Trial Infrastructure 303
11.46.2 Strategic SWOT Analysis 304
11.46.3 Immune Checkpoint Inhibitor R&D Allocation, Cost Structure, and Market Potential 305
11.47 Compass Therapeutics 306
11.47.1 Corporate Profile, Oncology Clinical Assets, and Trial Infrastructure 306
11.47.2 Strategic SWOT Analysis 307
11.47.3 Immune Checkpoint Inhibitor R&D Allocation, Cost Structure, and Market Potential 308
11.48 Compugen 309
11.48.1 Corporate Profile, Oncology Clinical Assets, and Trial Infrastructure 309
11.48.2 Strategic SWOT Analysis 310
11.48.3 Immune Checkpoint Inhibitor R&D Allocation, Cost Structure, and Market Potential 311
11.49 Curis 312
11.49.1 Corporate Profile, Oncology Clinical Assets, and Trial Infrastructure 312
11.49.2 Strategic SWOT Analysis 313
11.49.3 Immune Checkpoint Inhibitor R&D Allocation, Cost Structure, and Market Potential 314
11.50 Purple Biotech 315
11.50.1 Corporate Profile, Oncology Clinical Assets, and Trial Infrastructure 315
11.50.2 Strategic SWOT Analysis 316
11.50.3 Immune Checkpoint Inhibitor R&D Allocation, Cost Structure, and Market Potential 317
11.51 Genexine 318
11.51.1 Corporate Profile, Oncology Clinical Assets, and Trial Infrastructure 318
11.51.2 Strategic SWOT Analysis 319
11.51.3 Immune Checkpoint Inhibitor R&D Allocation, Cost Structure, and Market Potential 320
11.52 Aptevo Therapeutics 321
11.52.1 Corporate Profile, Oncology Clinical Assets, and Trial Infrastructure 321
11.52.2 Strategic SWOT Analysis 322
11.52.3 Immune Checkpoint Inhibitor R&D Allocation, Cost Structure, and Market Potential 323
11.53 Curocell 324
11.53.1 Corporate Profile, Oncology Clinical Assets, and Trial Infrastructure 324
11.53.2 Strategic SWOT Analysis 325
11.53.3 Immune Checkpoint Inhibitor R&D Allocation, Cost Structure, and Market Potential 326
11.54 Caribou Biosciences 327
11.54.1 Corporate Profile, Oncology Clinical Assets, and Trial Infrastructure 327
11.54.2 Strategic SWOT Analysis 328
11.54.3 Immune Checkpoint Inhibitor R&D Allocation, Cost Structure, and Market Potential 329
11.55 AIM ImmunoTech 330
11.55.1 Corporate Profile, Oncology Clinical Assets, and Trial Infrastructure 330
11.55.2 Strategic SWOT Analysis 331
11.55.3 Immune Checkpoint Inhibitor R&D Allocation, Cost Structure, and Market Potential 332
11.56 Eikon Therapeutics 333
11.56.1 Corporate Profile, Oncology Clinical Assets, and Trial Infrastructure 333
11.56.2 Strategic SWOT Analysis 334
11.56.3 Immune Checkpoint Inhibitor R&D Allocation, Cost Structure, and Market Potential 335
11.57 Candel Therapeutics 336
11.57.1 Corporate Profile, Oncology Clinical Assets, and Trial Infrastructure 336
11.57.2 Strategic SWOT Analysis 337
11.57.3 Immune Checkpoint Inhibitor R&D Allocation, Cost Structure, and Market Potential 338
11.58 Scholar Rock 339
11.58.1 Corporate Profile, Oncology Clinical Assets, and Trial Infrastructure 339
11.58.2 Strategic SWOT Analysis 340
11.58.3 Immune Checkpoint Inhibitor R&D Allocation, Cost Structure, and Market Potential 341
11.59 Zhejiang Huahai Pharmaceutical 342
11.59.1 Corporate Profile, Oncology Clinical Assets, and Trial Infrastructure 342
11.59.2 Strategic SWOT Analysis 343
11.59.3 Immune Checkpoint Inhibitor R&D Allocation, Cost Structure, and Market Potential 344
11.60 Johnson & Johnson 345
11.60.1 Corporate Profile, Oncology Clinical Assets, and Trial Infrastructure 345
11.60.2 Strategic SWOT Analysis 346
11.60.3 Immune Checkpoint Inhibitor R&D Allocation, Cost Structure, and Market Potential 347
11.61 Eli Lilly 348
11.61.1 Corporate Profile, Oncology Clinical Assets, and Trial Infrastructure 348
11.61.2 Strategic SWOT Analysis 349
11.61.3 Immune Checkpoint Inhibitor R&D Allocation, Cost Structure, and Market Potential 350
11.62 Otsuka Holdings 351
11.62.1 Corporate Profile, Oncology Clinical Assets, and Trial Infrastructure 351
11.62.2 Strategic SWOT Analysis 352
11.62.3 Immune Checkpoint Inhibitor R&D Allocation, Cost Structure, and Market Potential 353
11.63 Biocon Ltd 354
11.63.1 Corporate Profile, Oncology Clinical Assets, and Trial Infrastructure 354
11.63.2 Strategic SWOT Analysis 355
11.63.3 Immune Checkpoint Inhibitor R&D Allocation, Cost Structure, and Market Potential 356
11.64 SAMSUNG EPIS 357
11.64.1 Corporate Profile, Oncology Clinical Assets, and Trial Infrastructure 357
11.64.2 Strategic SWOT Analysis 358
11.64.3 Immune Checkpoint Inhibitor R&D Allocation, Cost Structure, and Market Potential 359
11.65 Alvotech 360
11.65.1 Corporate Profile, Oncology Clinical Assets, and Trial Infrastructure 360
11.65.2 Strategic SWOT Analysis 361
11.65.3 Immune Checkpoint Inhibitor R&D Allocation, Cost Structure, and Market Potential 362
11.66 Bio-Thera Solutions 363
11.66.1 Corporate Profile, Oncology Clinical Assets, and Trial Infrastructure 363
11.66.2 Strategic SWOT Analysis 364
11.66.3 Immune Checkpoint Inhibitor R&D Allocation, Cost Structure, and Market Potential 365
11.67 Shandong Boan Biotechnology 366
11.67.1 Corporate Profile, Oncology Clinical Assets, and Trial Infrastructure 366
11.67.2 Strategic SWOT Analysis 367
11.67.3 Immune Checkpoint Inhibitor R&D Allocation, Cost Structure, and Market Potential 368
11.68 Formycon AG 369
11.68.1 Corporate Profile, Oncology Clinical Assets, and Trial Infrastructure 369
11.68.2 Strategic SWOT Analysis 370
11.68.3 Immune Checkpoint Inhibitor R&D Allocation, Cost Structure, and Market Potential 371
Table 2 Macroeconomic Baselines, Foreign Exchange Equivalents, and Deflators (2021-2031) 5
Table 3 Global Immune Checkpoint Inhibitor Market Revenue and Volume Projections (2021-2031) 8
Table 4 Biomanufacturing Cost Breakdown per Gram of Monoclonal Antibody by Scale 22
Table 5 Patent Expiry and Anticipated Biosimilar Entry Dates for Major Commercial Checkpoint Inhibitors 27
Table 6 Global Immune Checkpoint Inhibitor Revenue by Receptor Target (2021-2031) 30
Table 7 Global Anti-PD-1 Monoclonal Antibody Revenue by Region (2021-2031) 32
Table 8 Global Anti-PD-L1 Monoclonal Antibody Revenue by Region (2021-2031) 34
Table 9 Global Anti-CTLA-4 Monoclonal Antibody Revenue by Region (2021-2031) 36
Table 10 Global Novel Monospecific and Co-Inhibitory Receptor Modulator Revenue by Class (2021-2031) 38
Table 11 Global Immune Checkpoint Inhibitor Revenue by Clinical Application (2021-2031) 39
Table 12 Global Primary Solid Tumor Market Revenue by Malignancy Subtype (2021-2031) 40
Table 13 Global Primary Hematological Malignancies Market Revenue by Subtype (2021-2031) 48
Table 14 Global Commercial Channel Sizing and Procurement Volume Share (2021-2031) 50
Table 15 Installed Bioreactor Capacity Dedicated to Checkpoint Inhibitor Manufacturing by Region (2026) 56
Table 16 Global Immune Checkpoint Inhibitor Revenue by Macro-Region (2021-2031) 62
Table 17 North America Immune Checkpoint Inhibitor Revenue by Country (2021-2031) 63
Table 18 Europe Immune Checkpoint Inhibitor Revenue by Country (2021-2031) 64
Table 19 Asia-Pacific Immune Checkpoint Inhibitor Revenue by Country (2021-2031) 66
Table 20 Latin America and Middle East & Africa Checkpoint Inhibitor Revenue by Country (2021-2031) 67
Table 21 AstraZeneca Immune Checkpoint Inhibitor Revenue, Cost and Gross Margin (2021-2026) 70
Table 22 Roche Immune Checkpoint Inhibitor Revenue, Cost and Gross Margin (2021-2026) 73
Table 23 Sanofi Immune Checkpoint Inhibitor Revenue, Cost and Gross Margin (2021-2026) 76
Table 24 Merck & Co. Immune Checkpoint Inhibitor Revenue, Cost and Gross Margin (2021-2026) 79
Table 25 Merck KGaA Immune Checkpoint Inhibitor Revenue, Cost and Gross Margin (2021-2026) 82
Table 26 Pfizer Immune Checkpoint Inhibitor Revenue, Cost and Gross Margin (2021-2026) 85
Table 27 BeOne Medicines Immune Checkpoint Inhibitor Revenue, Cost and Gross Margin (2021-2026) 88
Table 28 Bristol Myers Squibb (BMS) Immune Checkpoint Inhibitor Revenue, Cost and Gross Margin (2021-2026) 91
Table 29 Ono Pharmaceutical Immune Checkpoint Inhibitor Revenue, Cost and Gross Margin (2021-2026) 94
Table 30 Regeneron Pharmaceuticals Immune Checkpoint Inhibitor Revenue, Cost and Gross Margin (2021-2026) 97
Table 31 Coherus Oncology Inc. Immune Checkpoint Inhibitor Revenue, Cost and Gross Margin (2021-2026) 100
Table 32 Fortress Biotech Inc. Immune Checkpoint Inhibitor Revenue, Cost and Gross Margin (2021-2026) 103
Table 33 GSK plc Immune Checkpoint Inhibitor Revenue, Cost and Gross Margin (2021-2026) 106
Table 34 INCYTE CORPORATION Immune Checkpoint Inhibitor Revenue, Cost and Gross Margin (2021-2026) 109
Table 35 Jiangsu Hengrui Pharmaceuticals Immune Checkpoint Inhibitor Revenue, Cost and Gross Margin (2021-2026) 112
Table 36 Lepu Biopharma Immune Checkpoint Inhibitor Revenue, Cost and Gross Margin (2021-2026) 115
Table 37 Shanghai Henlius Biotech Immune Checkpoint Inhibitor Revenue, Cost and Gross Margin (2021-2026) 118
Table 38 Shanghai Junshi Biosciences Immune Checkpoint Inhibitor Revenue, Cost and Gross Margin (2021-2026) 121
Table 39 Sichuan Kelun Pharmaceutical Immune Checkpoint Inhibitor Revenue, Cost and Gross Margin (2021-2026) 124
Table 40 Simcere Pharmaceutical Immune Checkpoint Inhibitor Revenue, Cost and Gross Margin (2021-2026) 127
Table 41 Sino Biopharmaceutical Limited Immune Checkpoint Inhibitor Revenue, Cost and Gross Margin (2021-2026) 130
Table 42 Sun Pharmaceutical Industries Ltd Immune Checkpoint Inhibitor Revenue, Cost and Gross Margin (2021-2026) 133
Table 43 Innovent Biologics Immune Checkpoint Inhibitor Revenue, Cost and Gross Margin (2021-2026) 136
Table 44 Akeso Immune Checkpoint Inhibitor Revenue, Cost and Gross Margin (2021-2026) 139
Table 45 3D Medicines Immune Checkpoint Inhibitor Revenue, Cost and Gross Margin (2021-2026) 142
Table 46 Alphamab Oncology Immune Checkpoint Inhibitor Revenue, Cost and Gross Margin (2021-2026) 145
Table 47 CStone Pharmaceuticals Immune Checkpoint Inhibitor Revenue, Cost and Gross Margin (2021-2026) 148
Table 48 Lee's Pharmaceutical Immune Checkpoint Inhibitor Revenue, Cost and Gross Margin (2021-2026) 151
Table 49 Sandoz Immune Checkpoint Inhibitor Revenue, Cost and Gross Margin (2021-2026) 154
Table 50 Celltrion Immune Checkpoint Inhibitor Revenue, Cost and Gross Margin (2021-2026) 157
Table 51 Beijing SinoCellTech Group Immune Checkpoint Inhibitor Revenue, Cost and Gross Margin (2021-2026) 160
Table 52 CSPC Pharmaceutical Group Immune Checkpoint Inhibitor Revenue, Cost and Gross Margin (2021-2026) 163
Table 53 Zydus Lifesciences Immune Checkpoint Inhibitor Revenue, Cost and Gross Margin (2021-2026) 166
Table 54 AbbVie Immune Checkpoint Inhibitor Revenue, Cost and Gross Margin (2021-2026) 169
Table 55 Amgen Immune Checkpoint Inhibitor Revenue, Cost and Gross Margin (2021-2026) 172
Table 56 Bayer Immune Checkpoint Inhibitor Revenue, Cost and Gross Margin (2021-2026) 175
Table 57 Novartis AG Immune Checkpoint Inhibitor Revenue, Cost and Gross Margin (2021-2026) 178
Table 58 Biocytogen Pharmaceuticals Immune Checkpoint Inhibitor Revenue, Cost and Gross Margin (2021-2026) 181
Table 59 BioNTech SE Immune Checkpoint Inhibitor Revenue, Cost and Gross Margin (2021-2026) 184
Table 60 Daewoong Pharmaceutical Immune Checkpoint Inhibitor Revenue, Cost and Gross Margin (2021-2026) 187
......
......
Table 121 Formycon AG Immune Checkpoint Inhibitor Revenue, Cost and Gross Margin (2021-2026) 370
Figure 1 Immune Checkpoint Inhibitor Research and Market Sizing Architecture 2
Figure 2 Global Immune Checkpoint Inhibitor Market Size and Year-on-Year Growth (2021-2031) 8
Figure 3 Upstream and Downstream Biomanufacturing Process Architecture 16
Figure 4 Immune Checkpoint Value Chain Margin Pool Distribution (2026) 21
Figure 5 Checkpoint Inhibitor Loss of Exclusivity and Biosimilar Erosion S-Curves 28
Figure 6 Global Market Share by Receptor Target Mechanism (2021-2031) 31
Figure 7 Global Market Share by Clinical Indication (2026) 41
Figure 8 Commercial Distribution Flow and Hospital Procurement Ecosystem 52
Figure 9 Geographic Map of Global Monoclonal Antibody Bioreactor Capacities (2026) 57
Figure 10 Global Regional Demand Breakdown for Immune Checkpoint Inhibitors (2026) 62
Figure 11 AstraZeneca Immune Checkpoint Inhibitor Market Share (2021-2026) 71
Figure 12 Roche Immune Checkpoint Inhibitor Market Share (2021-2026) 74
Figure 13 Sanofi Immune Checkpoint Inhibitor Market Share (2021-2026) 77
Figure 14 Merck & Co. Immune Checkpoint Inhibitor Market Share (2021-2026) 80
Figure 15 Merck KGaA Immune Checkpoint Inhibitor Market Share (2021-2026) 83
Figure 16 Pfizer Immune Checkpoint Inhibitor Market Share (2021-2026) 86
Figure 17 BeOne Medicines Immune Checkpoint Inhibitor Market Share (2021-2026) 89
Figure 18 Bristol Myers Squibb (BMS) Immune Checkpoint Inhibitor Market Share (2021-2026) 92
Figure 19 Ono Pharmaceutical Immune Checkpoint Inhibitor Market Share (2021-2026) 95
Figure 20 Regeneron Pharmaceuticals Immune Checkpoint Inhibitor Market Share (2021-2026) 98
Figure 21 Coherus Oncology Inc. Immune Checkpoint Inhibitor Market Share (2021-2026) 101
Figure 22 Fortress Biotech Inc. Immune Checkpoint Inhibitor Market Share (2021-2026) 104
Figure 23 GSK plc Immune Checkpoint Inhibitor Market Share (2021-2026) 107
Figure 24 INCYTE CORPORATION Immune Checkpoint Inhibitor Market Share (2021-2026) 110
Figure 25 Jiangsu Hengrui Pharmaceuticals Immune Checkpoint Inhibitor Market Share (2021-2026) 113
Figure 26 Lepu Biopharma Immune Checkpoint Inhibitor Market Share (2021-2026) 116
Figure 27 Shanghai Henlius Biotech Immune Checkpoint Inhibitor Market Share (2021-2026) 119
Figure 28 Shanghai Junshi Biosciences Immune Checkpoint Inhibitor Market Share (2021-2026) 122
Figure 29 Sichuan Kelun Pharmaceutical Immune Checkpoint Inhibitor Market Share (2021-2026) 125
Figure 30 Simcere Pharmaceutical Immune Checkpoint Inhibitor Market Share (2021-2026) 128
Figure 31 Sino Biopharmaceutical Limited Immune Checkpoint Inhibitor Market Share (2021-2026) 131
Figure 32 Sun Pharmaceutical Industries Ltd Immune Checkpoint Inhibitor Market Share (2021-2026) 134
Figure 33 Innovent Biologics Immune Checkpoint Inhibitor Market Share (2021-2026) 137
Figure 34 Akeso Immune Checkpoint Inhibitor Market Share (2021-2026) 140
Figure 35 3D Medicines Immune Checkpoint Inhibitor Market Share (2021-2026) 143
Figure 36 Alphamab Oncology Immune Checkpoint Inhibitor Market Share (2021-2026) 146
Figure 37 CStone Pharmaceuticals Immune Checkpoint Inhibitor Market Share (2021-2026) 149
Figure 38 Lee's Pharmaceutical Immune Checkpoint Inhibitor Market Share (2021-2026) 152
Figure 39 Sandoz Immune Checkpoint Inhibitor Market Share (2021-2026) 155
Figure 40 Celltrion Immune Checkpoint Inhibitor Market Share (2021-2026) 158
Figure 41 Beijing SinoCellTech Group Immune Checkpoint Inhibitor Market Share (2021-2026) 161
Figure 42 CSPC Pharmaceutical Group Immune Checkpoint Inhibitor Market Share (2021-2026) 164
Figure 43 Zydus Lifesciences Immune Checkpoint Inhibitor Market Share (2021-2026) 167
Figure 44 AbbVie Immune Checkpoint Inhibitor Market Share (2021-2026) 170
Figure 45 Amgen Immune Checkpoint Inhibitor Market Share (2021-2026) 173
Figure 46 Bayer Immune Checkpoint Inhibitor Market Share (2021-2026) 176
Figure 47 Novartis AG Immune Checkpoint Inhibitor Market Share (2021-2026) 179
Figure 48 Biocytogen Pharmaceuticals Immune Checkpoint Inhibitor Market Share (2021-2026) 182
Figure 49 BioNTech SE Immune Checkpoint Inhibitor Market Share (2021-2026) 185
Figure 50 Daewoong Pharmaceutical Immune Checkpoint Inhibitor Market Share (2021-2026) 188
Figure 51 Exelixis Immune Checkpoint Inhibitor Market Share (2021-2026) 191
Figure 52 Gilead Sciences Immune Checkpoint Inhibitor Market Share (2021-2026) 194
Figure 53 3SBio Inc. Immune Checkpoint Inhibitor Market Share (2021-2026) 197
Figure 54 HUTCHMED (China) Ltd. Immune Checkpoint Inhibitor Market Share (2021-2026) 200
Figure 55 ImmuneOncia Therapeutics Immune Checkpoint Inhibitor Market Share (2021-2026) 203
Figure 56 ImmunityBio Inc. Immune Checkpoint Inhibitor Market Share (2021-2026) 206
Figure 57 Iovance Biotherapeutics Immune Checkpoint Inhibitor Market Share (2021-2026) 209
Figure 58 Ipsen S.A. Immune Checkpoint Inhibitor Market Share (2021-2026) 212
Figure 59 JEIL Pharmaceutical Immune Checkpoint Inhibitor Market Share (2021-2026) 215
Figure 60 Shenzhen Chipscreen Biosciences Immune Checkpoint Inhibitor Market Share (2021-2026) 218
.......
.......
Figure 111 Formycon AG Immune Checkpoint Inhibitor Market Share (2021-2026) 371
Research Methodology
- Market Estimated Methodology:
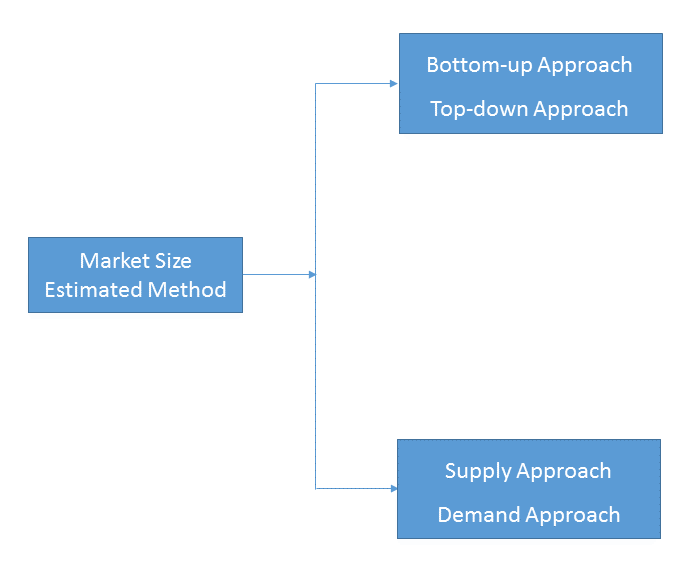
Bottom-up & top-down approach, supply & demand approach are the most important method which is used by HDIN Research to estimate the market size.
1)Top-down & Bottom-up Approach
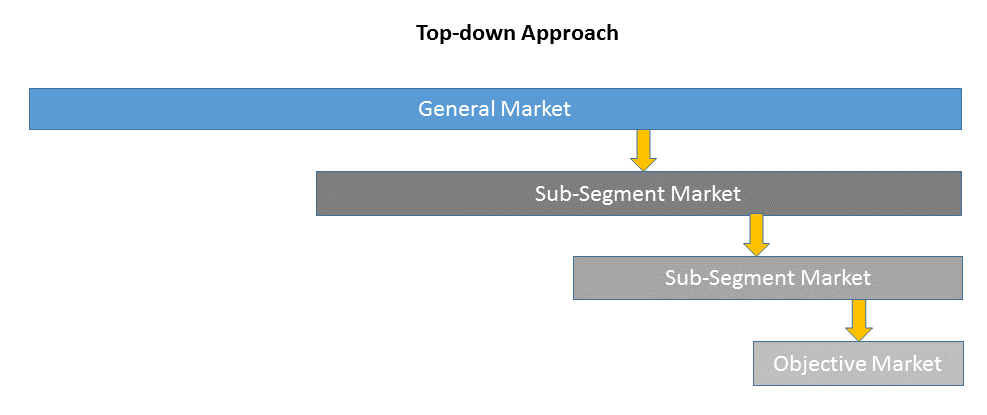
Top-down approach uses a general market size figure and determines the percentage that the objective market represents.
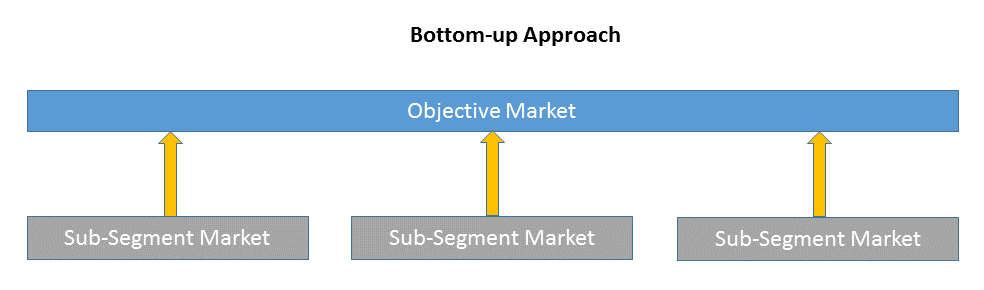
Bottom-up approach size the objective market by collecting the sub-segment information.
2)Supply & Demand Approach
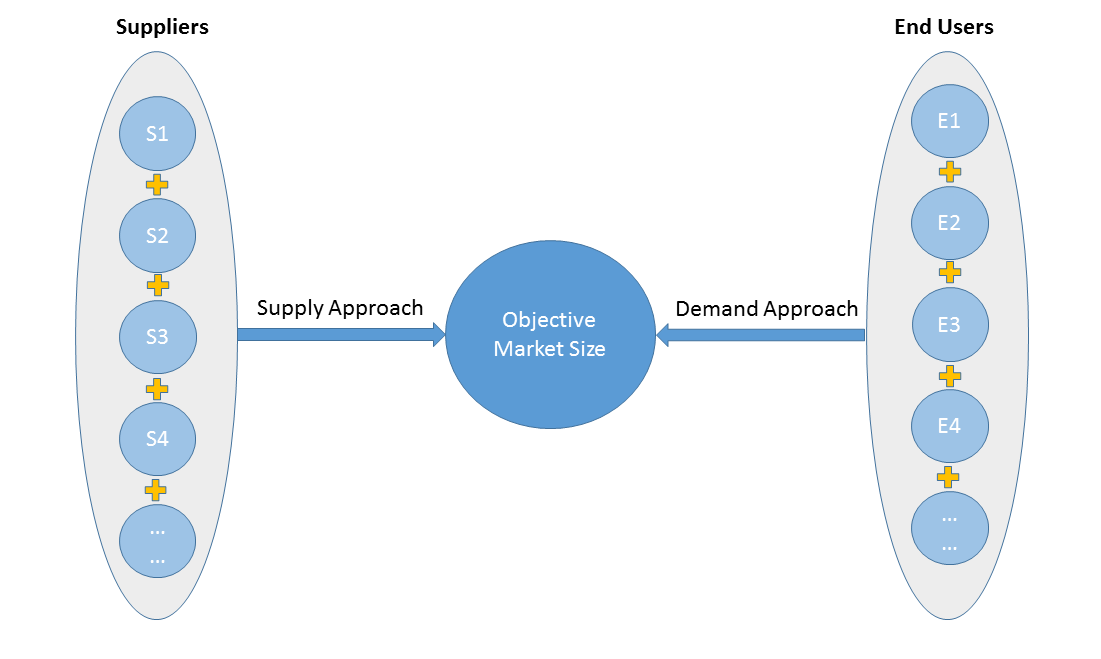
Supply approach is based on assessments of the size of each competitor supplying the objective market.
Demand approach combine end-user data within a market to estimate the objective market size. It is sometimes referred to as bottom-up approach.
- Forecasting Methodology
- Numerous factors impacting the market trend are considered for forecast model:
- New technology and application in the future;
- New project planned/under contraction;
- Global and regional underlying economic growth;
- Threatens of substitute products;
- Industry expert opinion;
- Policy and Society implication.
- Analysis Tools
1)PEST Analysis
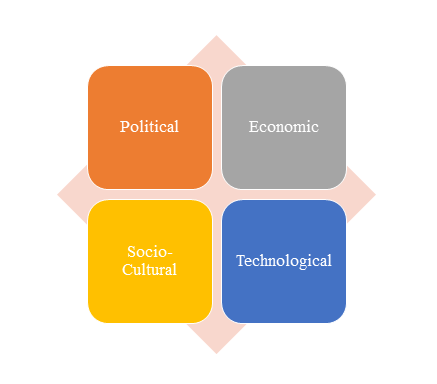
PEST Analysis is a simple and widely used tool that helps our client analyze the Political, Economic, Socio-Cultural, and Technological changes in their business environment.
- Benefits of a PEST analysis:
- It helps you to spot business opportunities, and it gives you advanced warning of significant threats.
- It reveals the direction of change within your business environment. This helps you shape what you’re doing, so that you work with change, rather than against it.
- It helps you avoid starting projects that are likely to fail, for reasons beyond your control.
- It can help you break free of unconscious assumptions when you enter a new country, region, or market; because it helps you develop an objective view of this new environment.
2)Porter’s Five Force Model Analysis
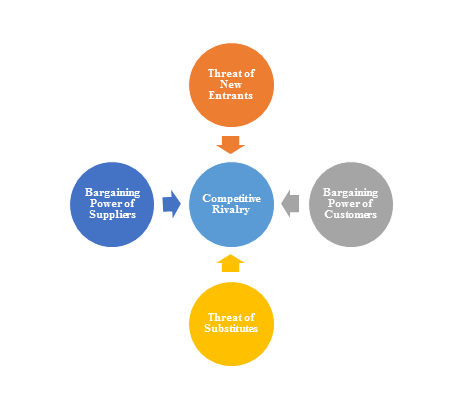
The Porter’s Five Force Model is a tool that can be used to analyze the opportunities and overall competitive advantage. The five forces that can assist in determining the competitive intensity and potential attractiveness within a specific area.
- Threat of New Entrants: Profitable industries that yield high returns will attract new firms.
- Threat of Substitutes: A substitute product uses a different technology to try to solve the same economic need.
- Bargaining Power of Customers: the ability of customers to put the firm under pressure, which also affects the customer's sensitivity to price changes.
- Bargaining Power of Suppliers: Suppliers of raw materials, components, labor, and services (such as expertise) to the firm can be a source of power over the firm when there are few substitutes.
- Competitive Rivalry: For most industries the intensity of competitive rivalry is the major determinant of the competitiveness of the industry.
3)Value Chain Analysis
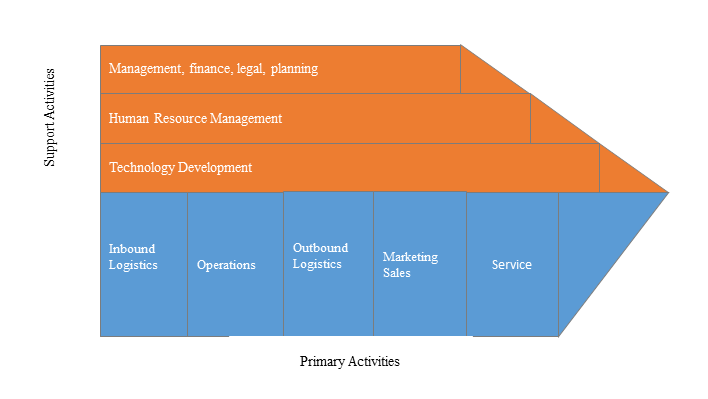
Value chain analysis is a tool to identify activities, within and around the firm and relating these activities to an assessment of competitive strength. Value chain can be analyzed by primary activities and supportive activities. Primary activities include: inbound logistics, operations, outbound logistics, marketing & sales, service. Support activities include: technology development, human resource management, management, finance, legal, planning.
4)SWOT Analysis
SWOT analysis is a tool used to evaluate a company's competitive position by identifying its strengths, weaknesses, opportunities and threats. The strengths and weakness is the inner factor; the opportunities and threats are the external factor. By analyzing the inner and external factors, the analysis can provide the detail information of the position of a player and the characteristics of the industry.
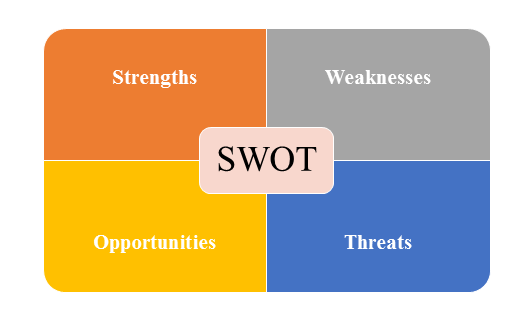
- Strengths describe what the player excels at and separates it from the competition
- Weaknesses stop the player from performing at its optimum level.
- Opportunities refer to favorable external factors that the player can use to give it a competitive advantage.
- Threats refer to factors that have the potential to harm the player.
- Data Sources
| Primary Sources | Secondary Sources |
|---|---|
| Face to face/Phone Interviews with market participants, such as: Manufactures; Distributors; End-users; Experts. Online Survey |
Government/International Organization Data: Annual Report/Presentation/Fact Book Internet Source Information Industry Association Data Free/Purchased Database Market Research Report Book/Journal/News |