Reusable Packaging Pooling Market: Global Forecast 2026-2031
- Single User License (1 Users) $ 3,500
- Team License (2~5 Users) $ 4,500
- Corporate License (>5 Users) $ 5,500
The global reusable packaging pooling market size is valued at 22 - 32 billion USD in 2026, with a compound annual growth rate within the range of 4.5% to 6.5% through 2031. This expansion is governed by two tailwinds: systemic labor shortages necessitating strict dimensional conformity for Automated Storage and Retrieval Systems (ASRS), and an escalating regulatory drag on single-use transport packaging led by supranational sustainability directives.
Packaging pooling addresses the economic and material inefficiencies of captive asset management. Linear supply chains generate millions of tons of municipal solid waste while exposing downstream retailers to severe warehouse bottlenecks caused by irregular, damaged, single-use whitewood platforms. By retaining legal ownership of standardized transport assets—including wooden pallets, high-density polyethylene pallets, reusable plastic crates, intermediate bulk containers, and attached lid containers—pooling providers convert capital expenditure burdens into variable operational expenditure for manufacturers. Concurrently, the operating environment faces headwinds. Input cost inflation across sawmilling and transport sectors, combined with acute skilled labor shortages across regional fulfillment depots, has tested network capacity. The margin profile of operators is increasingly defined by asset recovery efficiency, where the containment of asset leakage and the deployment of sensorized telematics govern long-term capital returns. The competitive playing field is consolidating rapidly into an oligopoly of cross-border operators flanked by agile, regional champions capturing localized manufacturing corridors.
SYSTEMIC MARKET ARCHITECTURE AND OPERATIONAL MODELS
Reusable packaging pooling operates as a business-to-business circular sharing ecosystem. The core asset base is held on the balance sheet of the pooling administrator, which deploys, tracks, retrieves, sanitizes, and repairs millions of standardized logistical units across high-velocity supply networks.
● Classification By Asset Form
- Wooden Pallets:
Engineered primarily from sustainably harvested softwoods and hardwoods, standardized wooden platforms represent the primary volume base of the pooling industry, absorbing over 90% of global pallet deployments. Standard dimensions—such as the 1200x1000mm footprint dominant in North America and Western Europe and the 1100x1100mm standard in East Asia—are engineered to interface seamlessly with heavy dynamic racking loads and high-throughput material handling equipment. Major players rely heavily on wooden platforms for their structural repairability and lower upfront procurement cost compared to polymers.
- Plastic Pallets:
Fabricated via high-pressure injection molding or structural foam processing of virgin or recycled high-density polyethylene and polypropylene. Plastic pallets address regulated industries requiring aggressive sanitation, including pharmaceutical distribution, cold-chain protein distribution, and cleanroom food processing. Plastic assets eliminate moisture absorption, pest infestation risks, and wood splinters that cause sorting jams in automated logistics hubs.
- Reusable Plastic Crates:
Collapsible, ventilated structural containers engineered specifically for fresh agriculture and grocery retail. Reusable plastic crates replace single-use corrugated cardboard boxes, mitigating vertical compression failures during refrigerated transit, improving airflow during pre-cooling cycles, and collapsing flat on backhauls to optimize reverse logistics volume ratios.
- Intermediate Bulk Containers:
Comprising composite, folding plastic, and rigid stainless steel units engineered for liquid food ingredients, specialty chemicals, personal care bases, and bulk pharmaceuticals. These assets eliminate single-use drum waste and streamline industrial processing connections through standardized discharge valves.
- Attached Lid Containers:
Nestable, tamper-evident plastic containers equipped with intermeshing hinged lids. Deployed predominantly in high-security third-party logistics fulfillment, e-commerce order routing, and retail store replenishment networks to mitigate internal merchandise theft and protect high-value stock-keeping units.
- Other Specialized Load Carriers:
Encompasses heavy-duty metal roll cages (such as Japanese kago-cars), demountable steel stillages for automotive powertrain transport, and modular nesting racks for high-density tire logistics.
● Classification By Operational and Circulation Model
- Managed Open-Loop Pooling:
The prevailing commercial model in high-velocity consumer goods logistics. The pooling operator functions as a clearinghouse and asset manager across a multi-tiered ecosystem. Assets are dispatched from regional service centers to consumer goods manufacturers, packed with inventory, routed through wholesale and retail distribution centers, and eventually collected by the pooling operator from retail receiving bays. Following collection, assets return to a centralized depot for inspection, robotic sorting, automated repair, and reissuance. Pricing structures bundle upfront issue fees, daily hire rates based on dwell time, and variable transaction fees for inter-depot movements.
- Closed-Loop Pooling:
Assets circulate through dedicated, pre-defined corridors between designated industrial partners, such as automotive assembly networks or specialized chemical refining channels. Equipment is engineered specifically for discrete manufacturing requirements, such as custom-dunnage engine cradles. Once emptied at the destination assembly plant, units return directly to the originating facility or a local captive consolidation hub.
- Fungible and Exchange Systems:
Supply chain participants trade unbranded, standardized pallets on a one-for-one transaction basis upon delivery. While eliminating administrative platform access fees, this unmanaged structure suffers from chronic asset quality degradation, elevated sorting overheads, dispute-heavy reconciliations, and elevated asset attrition rates, accelerating market migration toward managed open-loop networks.
SUPPLY CHAIN AND VALUE CHAIN ARCHITECTURE
The pooling value chain is an intricate ecosystem requiring precise capital allocation, reverse logistics routing, and automated asset conditioning. Value generation does not reside solely in asset leasing, but in reverse clearinghouse efficiency and total cycle velocity.
● Upstream Raw Material Procurement:
Industrial lumber forms the primary capital procurement category for wooden poolers, absorbing approximately 75% of new asset investment outlays. Responsible operators require chain-of-custody tracking under Forest Stewardship Council or Programme for the Endorsement of Forest Certification standards to insulate enterprise clients from deforestation risks. For polymer assets, operators balance high-density polyethylene resins with recycled post-consumer and circular polymers to control weight while ensuring structural rigidity across negative-temperature cold chains.
● Equipment Manufacturing and Assembly:
High-speed automated nailing lines convert raw timber into dimensional pallets at scale, while industrial injection-molding presses manufacture polymer crates and pallets. Several large industrial groups, such as China International Marine Containers, operate as vertically integrated equipment fabricators and pool operators, manufacturing specialized intermodal containers, liquid bulk tanks, and automotive cages in-house.
● Service Center Depots and Asset Conditioning:
The operational core of the pooling network resides in strategically distributed service centers positioned within 100 to 150 kilometers of major retail and manufacturing nodes. Modern facilities feature high-speed optical scanning, acoustic resonance evaluation for structural timber integrity, automated robotic nail clinching, ultrasonic wash bays for food containers, and automated sorting lanes. Maintenance and repair expenditures absorb between 22% and 26% of top-line operational cash flows, creating substantial barriers to scale for smaller operators.
● Downstream Customer Logistics:
Assets move outward from service centers into manufacturer plants to stage ambient and chilled consumer goods. Loaded platforms travel via third-party motor carriers, rail networks, or ocean freight to distribution centers. Standardized dimensional tolerance remains critical: any warpage or board protrusion can trigger system errors across automated high-bay warehouses, making pooled platform quality a non-negotiable operational metric for modern retailers.
● Reverse Logistics and Asset Recovery:
The reverse distribution loop governs economic sustainability. Operators execute collaborative backhauls, utilizing transport carriers returning from retail centers to collect empty platforms, thereby eliminating empty vehicle miles. At retail docks without formal clearing arrangements, pooling assets face the risk of unauthorized diversion or abandonment. Operators manage this leakage by maintaining internal forensic recovery teams, executing legal actions against unauthorized platform aggregators, and provisioning balance-sheet liabilities via irrecoverable pooling equipment allowances.
DOWNSTREAM APPLICATION DEMAND PATTERNS
● Fast-Moving Consumer Goods and Consumer Staples:
Fast-moving consumer goods absorb more than 80% of global pallet pooling issues. Demand remains highly defensive, tied directly to recurring consumer consumption of packaged foods, beverages, personal care, and domestic cleaning products. Enterprise clients rely on long-term master service agreements spanning three to five years to guarantee platform availability during seasonal demand spikes.
● Fresh Produce and Agriculture:
Agricultural pooling demand is characterized by seasonal harvest surges and cross-border produce movements. Reusable plastic crates dominate fresh fruit and vegetable distribution from agricultural packhouses in regions like Southern Europe, California, and Latin America into major urban retail networks. Reusable plastic crates minimize post-harvest crushing damage, enhance cold-chain ventilation efficiency, and reduce corrugated paper packaging waste.
● Automotive and Industrial Manufacturing:
Automotive manufacturing demands custom-engineered metal stillages, foldable plastic bulk bins, and heavy-duty steel containers designed to transport stamped body components, electronics, and powertrains between Tier-1 component suppliers and original equipment manufacturer assembly facilities. Precision dimensions and integrated custom interior dunnage ensure integration into robotic component assembly lines.
● Third-Party Logistics and Automated Retail Logistics:
Modern retail fulfillment centers rely entirely on automated guided vehicles, high-speed conveyor belts, and automated storage and retrieval systems. These automated interfaces cannot tolerate the dimensional instability or board defects common in unmanaged whitewood pallets. As a result, leading global retail chains mandate pooled, certified platforms for incoming palletized freight to maintain throughput speed and eliminate dock bottlenecks.
● Chemicals, Petrochemicals, and Regulated Industries:
Chemical and pharmaceutical distribution mandates specialized containment assets, including intermediate bulk containers and food-grade aseptic containers. Fleet assets must conform to hazardous material transport protocols and sanitary washdown standards, with tracking systems providing lot traceability for chemical and ingredient batches.
REGIONAL MARKET DYNAMICS
● North America:
North America represents the most capital-intensive pooling theater globally, anchored by high warehouse automation density and long line-haul freight lanes across the United States, Canada, and Mexico. The United States market is characterized by dominant retail mandates from supermarket and supercenter chains requiring pool-certified platforms. The operating environment has experienced capacity stresses stemming from depot labor availability constraints and transport cost inflation. When repair depot throughput slows, unrepaired inventory accumulates at regional service yards, tightening available asset pools and forcing operators to incur defensive capital expenditures for new platform procurement. Canada represents an integrated extension of this market, tied directly to trans-border consumer goods manufacturing corridors. Mexico functions as an industrial and agricultural export powerhouse, channeling millions of pooled wooden pallets and agricultural crates into the United States via border clearing hubs.
● Asia-Pacific:
Asia-Pacific demonstrates the most rapid structural expansion, characterized by state-backed logistics modernizations, new automated logistics construction, and cross-border trade integration.
China is transitioning away from captive asset ownership, catalyzed by government-backed logistics standardization initiatives and the integration of large-scale manufacturing container pools.
India represents an exceptional growth environment, driven by modern retail development, Goods and Services Tax consolidation that merged small fragmented warehouses into massive multi-modal logistics hubs, and national logistics infrastructure expansion. Market consolidation has concentrated regional pallet and container pool operations under dominant domestic asset managers.
In Japan, the market is structurally mature yet technologically sophisticated. The implementation of 2024 logistics labor reforms, which placed legally binding caps on commercial truck driver overtime, has created immediate driver deficits. The Japanese Ministry of Land, Infrastructure, Transport and Tourism is actively enforcing standardized unit-load palletization to compress dock loading and unloading times. Japanese poolers deploy smart RFID-tagged and GPS-tracked equipment alongside modular metal roll cages to maximize transport velocity.
The Australian and New Zealand markets operate with near-universal retail pooling penetration, serving as mature testing beds for advanced digital network orchestration. Southeast Asian manufacturing corridors—spanning Vietnam, Thailand, Malaysia, and Indonesia—are expanding their regional pool networks to service inter-regional consumer goods and automotive supply chains.
● Europe:
Europe represents a mature and heavily regulated pooling market, governed by comprehensive circular economy directives, standardized pallet clearing frameworks, and trans-continental retail distribution systems. The United Kingdom, Germany, and France form the core industrial markets, characterized by high penetration of both wooden pallet pools and reusable plastic grocery crates. In Southern Europe, including Spain and Italy, agricultural export velocity underpins vast seasonal deployments of reusable plastic crates feeding northern European retail markets. Central and Eastern European logistics hubs continue to absorb pooled platforms as modern distribution facilities expand across Poland, the Czech Republic, and Romania. Türkiye serves as a critical manufacturing and fresh produce conduit bridging European and Middle Eastern logistics channels.
● South America:
South America presents an expanding addressable market, supported by massive agricultural export trade flows and the gradual modernization of domestic consumer goods retail channels. Brazil represents the leading regional market, absorbing large volumes of pooled wooden pallets across multinational consumer goods distribution networks and food manufacturing. Argentina maintains high underlying baseline demand for consumer staples logistics despite persistent macroeconomic volatility and currency revaluations. Chile operates as an innovation testbed for advanced digital asset tracking, serving as a pioneer for full-scale serialization programs where every pooled platform is digitally tracked to eliminate manual accounting reconciliations.
● Middle East and Africa:
The Middle East and Africa represents an emerging pooling frontier benefiting from multi-billion-dollar state infrastructure investments and national industrial diversification programs. The Gulf Cooperation Council region, led by the Kingdom of Saudi Arabia and the United Arab Emirates, is witnessing a structural shift toward standardized supply chain operations. Major state-backed programs, such as Saudi Vision 2030, are funding logistics zones and modern manufacturing complexes, generating greenfield demand for managed pooling networks. In South Africa, established consumer goods and agricultural sectors sustain a mature managed pooling ecosystem, which serves as an operational base for long-haul logistics corridors extending into neighboring Sub-Saharan African economies.
COMPETITIVE PROFILES
● Brambles Limited: Operating globally under the CHEP brand, Brambles maintains the preeminent market position in international reusable asset pooling, managing an asset pool of approximately 352 million units spanning approximately 60 countries. The enterprise focuses on managed open-loop pallet, crate, and container pooling across fast-moving consumer goods, fresh grocery, and industrial distribution networks. Its operational moat is built on network density: an expansive ecosystem of more than 750 service depots that minimizes empty transit miles for customer returns. Strategic pivots focus on enterprise-wide digitization under the Serialisation+ initiative, deploying continuous data capture to automate asset auditing, reduce leakage provisions, and generate supply chain analytics.
● LEAP India Limited: The dominant asset pooling operator in the Indian domestic market, managing over 14.7 million assets across 29 fulfillment hubs and more than 10,000 customer touchpoints. The company provides wooden pallets, plastic platforms, heavy-duty industrial containers, and agricultural crates. LEAP completed a major strategic consolidation by acquiring and merging the Indian operations of CHEP, cementing its control over domestic automotive container pooling and national consumer goods distribution channels. The enterprise is expanding its footprint internationally, establishing dedicated operational entities in Saudi Arabia and the United Arab Emirates to capture GCC industrial supply chains.
● uPR Corporation:A leading Japanese logistics equipment rental and telematics enterprise managing an operational fleet of approximately 5.28 million units across 10 regional sales offices and approximately 200 logistical depots. uPR commercializes standardized wooden and plastic pallets, modular metal nesting racks, wire-mesh roll cages, and assistive logistics exoskeletons. Its strategic moat centers on proprietary digital IoT solutions, including specialized active RFID and GPS tracking platforms designed to eliminate asset loss and satisfy Japanese 2024 logistics reform efficiency mandates. The company operates international subsidiaries across Southeast Asia, including entities in Singapore, Thailand, Malaysia, and Vietnam.
● China International Marine Containers (Group) Co., Ltd.: A diversified industrial conglomerate listed on the Shenzhen and Hong Kong stock exchanges, operating an integrated Circular Carrier division. CIMC represents a vertically integrated manufacturer-operator, utilizing internal engineering capabilities to fabricate and pool heavy-duty metal pallet boxes, liquid tank containers, intermediate bulk containers, and 35-ton intermodal railway boxes. Its operational moat relies on low-cost internal manufacturing integration and deep penetration into automotive supply chains, industrial liquid chemicals, and multimodal rail-sea logistics channels across mainland Asia.
● Loscam: A major returnable package pooling enterprise operating across the Asia-Pacific region, commanding deep market penetration in Australia, New Zealand, Greater China, and Southeast Asia. The company manages extensive managed open-loop pools of standardized wooden and plastic pallets, retail display platforms, and bulk containers servicing consumer staples and manufacturing corridors. In mainland China, its market footprint was reinforced through the combination of its operations with CHEP China, consolidating regional clearing scale.
● PECO Pallet: A major North American pallet pooling operator managing a distinct fleet of red-painted wooden platforms. PECO operates an extensive depot network across the United States, Canada, and Mexico, competing directly in the grocery, consumer packaged goods, and beverage manufacturing sectors. Its strategic positioning emphasizes specialized customer service, automated depot sorting capabilities, and rigorous pallet quality sorting to prevent line stoppages in high-throughput warehouse environments.
● Euro Pool Group: Europe's leading logistics service provider of reusable packaging, operating through two specialized divisions: Euro Pool System (EPS) and La Palette Rouge (LPR). The EPS division controls the dominant pool of folding reusable plastic crates servicing European fresh produce grocery logistics, replacing single-use cardboard packaging. The LPR division operates a major red wooden pallet pool servicing consumer staples manufacturers across Western and Central Europe, interfacing directly with leading retail distribution chains.
● Faber Group: A major European family-owned circular load carrier and pooling service enterprise. Faber operates across two primary commercial segments: the IPP pooling network, which manages open and closed pallet pools for consumer goods and retail supply chains, and the PRS Return System, which operates an international circular pallet pool dedicated to polymer producers and chemical processors across Europe. The enterprise focuses on sustainable forestry integration, circular timber asset recovery, and long-term customer partnerships.
● IFCO Systems: The world's preeminent specialized operator of Reusable Packaging Containers (RPCs), maintaining an asset pool of hundreds of millions of foldable plastic crates deployed across international fresh grocery supply chains. IFCO operates an extensive, automated sanitation and service center network spanning Europe, North America, South America, and Asia. Its operational moat rests on long-term partnerships with supermarket retailers, hygienic wash certification protocols, and collapsible crate designs that optimize backhaul transport density.
● Tosca Services LLC: A prominent North American and European provider of reusable packaging and pooling services, operating across the grocery, protein, poultry, dairy, and agricultural sectors. Tosca manages a diversified circular asset fleet comprising reusable plastic containers, heavy-duty bulk bins, and hygienic plastic pallets. The enterprise has executed inorganic acquisitions to expand its footprint in high-density polymer pallets, challenging traditional wood platforms in automated retail logistics.
● Goodpack: The premier global operator of specialized intermediate bulk container fleets, controlling an asset pool of galvanized steel foldable IBCs. Goodpack provides closed-loop and open-loop pooling solutions servicing synthetic and natural rubber processing, bulk food ingredients, juices, liquid chemicals, and specialty industrial components. Its operational moat resides in high-load structural steel containers that replace disposable wooden crates and corrugated drums across trans-oceanic shipping corridors.
● MStar Holdings Corporation (MicroStar Logistics): The leading global outsourced supply chain asset and pooling provider for the alcoholic beverage sector, managing a shared circular pool of millions of reusable stainless steel beer kegs. MicroStar operates an extensive reverse clearinghouse across North American and European craft and industrial brewing networks, repairing, sanitizing, and tracking steel kegs to eliminate capital asset hoarding for commercial breweries.
● iGPS Logistics: A specialized North American pooling operator providing plastic pallets embedded with RFID telematics. iGPS positions its plastic platform as a modern alternative to traditional wood, highlighting lighter tare weights, zero moisture retention, uniform dimensional accuracy for automated storage systems, and the elimination of wood splinters and nail pops in consumer goods shipping.
● Japan Pallet Rental Corporation: A foundational logistics equipment rental enterprise in Japan, operating an extensive nationwide pallet pool serving the food, beverage, chemical, and retail distribution sectors. JPR functions as an open-clearing platform across the Japanese archipelago, enabling intermodal transport interoperability and operating joint logistics clearing systems to support dock efficiency initiatives.
● Nippon Pallet Pool: A primary nationwide pallet pooling and rental enterprise in Japan, operating an extensive standardized pallet fleet that supports intermodal rail and road transit across the chemical, paper, food, and heavy industrial manufacturing sectors. Nippon Pallet Pool maintains dense depot facilities across Japanese industrial ports and freight terminals.
● LogisALL Group: South Korea's dominant logistics asset pooling enterprise, operating through its Korea Pallet Pool (KPP) and Korea Container Pool (KCP) divisions. LogisALL manages nationwide rental pools of standardized pallets, foldable containers, and automotive stillages. The enterprise has pioneered global smart pallet operations utilizing Recycled Reusable Plastic Pallets (RRPP) integrated with RFID and IoT telematics across the Asia-Pacific consumer goods, automotive, and semiconductor supply chains.
● Horen Group: An international engineering and smart returnable transit packaging operator, providing IoT-enabled foldable intermediate bulk containers, drop-door plastic bulk bins, and specialized automotive packaging. Horen focuses on digital platform tracking, combining specialized container manufacturing with automated telemetry services for industrial liquid and component supply chains.
● EXZOD India Pvt Ltd: An emerging Indian supply chain asset management enterprise providing outsourced pallet pooling, manufacturing, and reverse logistics solutions. EXZOD services domestic FMCG, pharmaceutical, third-party logistics, and manufacturing distribution networks, capitalizing on the rapid modernization and automation of Indian logistics infrastructure.
OPPORTUNITIES AND STRUCTURAL CEILINGS
● Strategic Growth Catalysts
- Asset Digitization and the Data Monetization Shift:
The integration of ultra-low-power Bluetooth Low Energy beacons, active cellular RFID, and serialized machine vision is transforming pooled assets from physical commodities into continuous supply chain observation nodes. Historically, operators absorbed significant unbilled equipment losses because they lacked visibility into when pallets exited designated retail corridors. Comprehensive fleet serialization allows operators to pinpoint dwell-time bottlenecks, identify unauthorized asset hoarding by uncontracted distributors, and offer enterprise clients real-time shipment condition and transit speed analytics.
- Automated Warehouse and ASRS Mandates:
The rapid proliferation of automated high-bay warehouses and ASRS installations provides a structural demand floor for standardized pooled assets. Modern automated facilities operate on tight dimensional tolerances. Non-standardized, degraded, or warped single-use whitewood pallets frequently cause mechanical jams, triggering costly downtime for automated stacker cranes and conveyor systems. Retailers are increasingly penalizing shippers that deliver freight on substandard platforms, directly incentivizing manufacturers to adopt certified, dimensionally uniform pooled pallets.
- Regulatory Replacement of Single-Use Secondary Packaging:
International legislative actions targeting packaging waste represent a permanent secular catalyst for reusable pooling platforms. As directives like the European Union PPWR tighten allowable packaging waste thresholds, the economic viability of single-use corrugated containers and disposable shipping platforms will erode. Managed pooling networks provide shippers with an established, compliant alternative that avoids environmental non-compliance fees and shifts capital expenditure into predictable operational cost structures.
● Critical Structural Challenges
- Depot Labor Vulnerability and Conditioning Bottlenecks:
The primary operational vulnerability of managed open-loop pooling resides in service center labor dependencies. Inspecting, sorting, and repairing tens of millions of returned platforms remains fundamentally labor-intensive. When local labor markets tighten or depot turnover spikes, repair output drops, stranding millions of damaged assets in regional holding yards. This inventory bottleneck quickly constrains regional network capacity, forcing operators to execute costly emergency capital purchases of virgin pallets to meet committed customer demand, directly impairing operational profit margins.
- Timber Supply Volatility and Capital Outlay Risks:
Because industrial sawn timber represents approximately three-quarters of annual asset capital expenditures for wooden poolers, operators remain directly exposed to forestry supply shocks, sawmill capacity ceilings, and raw lumber price volatility. When timber prices spike, the capital cost per new platform escalates, compressing short-term returns on invested capital. This vulnerability necessitates long-term contractual indexation mechanisms that pass lumber cost fluctuations through to downstream enterprise shippers.
- Asset Attrition and Uncompensated Leakage:
The financial health of any pooling network is governed by its asset loss rate. Standardized wooden pallets possess utility outside formal contracted channels, leaving them vulnerable to diversion by unauthorized recyclers, small independent transport operators, and uncontracted wholesalers. When platforms enter informal recycling streams, pooling operators face substantial balance-sheet write-downs via irrecoverable pooling equipment provisions. Controlling asset leakage requires sustained expenditure on field asset auditors, automated vehicle gate scanning, and proactive legal enforcement of platform ownership rights.
1.1 Report Architecture and Definitional Boundaries of Reusable Packaging Pooling 1
1.2 Market Segmentation Schema: Asset Forms, Circulation Architectures, and Applications 2
1.3 Research Methodology: Triangulated Primary Telemetry and Secondary Corroboration 3
1.4 Analytical Assumptions: Asset Float Calibration, Turn Velocities, and Dwell-Time Metrics 4
1.5 Acronyms and Unit Metrics 5
Chapter 2 Global Reusable Packaging Pooling Industry Dynamics and Structural Evolution 6
2.1 Macroeconomic Environment, Supply Chain Resiliency, and Circular Economy Mandates 6
2.2 Global Market Size and Growth Trajectory: Fleet Volume and Revenue (2021-2031) 7
2.3 Total Cost of Ownership (TCO) Comparison: Asset Pooling vs. One-Way Linear Packaging 8
2.4 Regulatory Drivers: Extended Producer Responsibility (EPR) and Scope 3 Decarbonization Targets 9
2.5 Smart Asset Infrastructure: Commercialization of RFID, BLE, and Cellular IoT Tracking 10
2.6 Structural Inhibitors: Asset Shrinkage, Drift Liability, and Capital Allocation Friction 11
Chapter 3 Global Supply Chain, Upstream Manufacturing, and Service Depot Ecosystem 12
3.1 End-to-End Value Chain Map: Upstream Fabrication to Reverse Redistribution 12
3.2 Raw Material Dynamics: Virgin/Recycled HDPE Polymers and Industrial Hardwood Lumber 13
3.3 Asset Manufacturing Ecosystem: High-Tonnage Injection Molding and Structural Foam Tooling 14
3.4 Service Center Operations: Automated Washing, Decontamination, and Acoustic Pallet Inspection 15
3.5 Reverse Logistics Infrastructure: Dedicated Pooling Depots, 4PL Orchestration, and Cross-Dock Nodes 16
3.6 Fleet Software Architecture: Asset Reconciliation, Digital Twin Tracking, and Dwell-Time Billing 17
Chapter 4 Global Reusable Packaging Pooling Market Breakdown by Asset Form 18
4.1 Comparative Asset Taxonomy: Durability Profiles, Payload Capacities, and Capital Expenditure 18
4.2 Wooden Pallet Pooling 19
4.3 Plastic Pallet Pooling 21
4.4 Reusable Plastic Crates (RPCs) Pooling 22
4.5 Intermediate Bulk Containers (IBCs) Pooling 24
4.6 Attached Lid Containers (ALCs) Pooling 25
4.7 Other Asset Forms (Foldable Large Containers, Dollies, and Metal Roll Cages) 26
Chapter 5 Global Reusable Packaging Pooling Market by Operational and Circulation Model 27
5.1 Operational Architecture Matrix: Float Requirements, Reconciliation Risk, and Network Density 27
5.2 Managed Open-Loop Pooling (Issue-Deposit-Collect Model) 28
5.3 Dedicated Closed-Loop Pooling (Captive Return Model) 30
5.4 Fungible / Exchange Open System (Interchange and Voucher Clearing Model) 32
Chapter 6 Global Reusable Packaging Pooling Market Breakdown by Downstream Application 34
6.1 Downstream Demand Heterogeneity: Cycle Velocity and Regulatory Hygiene Mandates 34
6.2 Fast-Moving Consumer Goods (FMCG) and Packaged Foods 35
6.3 Fresh Produce and Agricultural Cold Chain 37
6.4 Automotive and Industrial Component Manufacturing 39
6.5 Third-Party Logistics (3PL), E-Commerce Fulfillment, and Retail Logistics 41
6.6 Other Applications (Specialty Chemicals, Pharmaceuticals, and Heavy Processing) 42
Chapter 7 Global Asset Fleet Trade, Cross-Border Flows, and Fleet Repatriation 43
7.1 Global Flow Patterns: Primary Asset Production Hubs vs. Net Inflow Consumption Hubs 43
7.2 Regulatory Tariffs, Phytosanitary Standards (ISPM 15), and Transboundary RTI Clearing 44
7.3 Reverse Cross-Border Repatriation Dynamics and Deadhead Repositioning Economics 45
7.4 Regional Nearshoring Footprints and North American / European Rebalancing 46
7.5 Maritime Containerized Pooling Flows and Deep-Sea Asset Repositioning Friction 47
7.6 Customs Regimes: Temporary Importation Procedures for Reusable Transport Items (RTIs) 48
Chapter 8 Regional Production Hubs and Consumption Markets 49
8.1 North America 49
8.1.1 United States: Retail Consolidation, Asset Digitization, and Automated ASRS Alignment 50
8.1.2 Canada: Interprovincial Timber Pallet Systems and Trans-Border Fresh Cold Chains 51
8.1.3 Mexico: Bajio Automotive Corridor and Cross-Border Agricultural Export Loops 52
8.2 Europe 53
8.2.1 Germany: Stringent Packaging Waste Directives (PPWR) and Industrial Standardization 54
8.2.2 France: Agrifood Retail Consignment Networks and Standardized Logistics Ecosystems 55
8.2.3 United Kingdom: Post-Brexit Biosecurity Protocols and Supermarket Pooling Penetration 56
8.2.4 Spain and Italy: Mediterranean Horticultural Export Corridors and RPC Networks 57
8.2.5 Netherlands, Poland & Rest of Europe: Pan-European Multimodal Distribution Depots and Manufacturing Hubs 58
8.3 Asia-Pacific 59
8.3.1 China: Belt and Road Logistical Corridors, Standard Pallet Subsidies, and Domestic Networks 60
8.3.2 Japan and South Korea: Pallet 2024 Logistics Reform, Labor Constraints, and Rental Models 61
8.3.3 India: Modern Retail Proliferation, Dedicated Freight Corridors, and FMCG Expansion 62
8.3.4 Australia and Southeast Asia: Agritech Cold Chains and Industrial Hubs 63
8.4 South America & Middle East and Africa64
8.4.1 Brazil, Chile, and Argentina: Agricultural Export Chains and Protein Processing Loops 64
8.4.2 Saudi Arabia, United Arab Emirates, and South Africa: Petrochemical Bulk and Modern Retail 65
Chapter 9 Industry Competitive Landscape and Market Concentration 66
9.1 Market Concentration Analysis: CR4, CR8, and Herfindahl-Hirschman Index (HHI) (2021-2026) 66
9.2 Competitive Strategies: Network Density Expansion, Mergers, and Depot Automation 67
9.3 Barriers to Entry: CapEx Moats, Asset Dwell Algorithms, and Retail Acceptance Agreements 68
Chapter 10 Corporate Intelligence and Competitive Profiles 69
10.1 Brambles Limited 69
10.1.1 Corporate Footprint, Circular Operating Strategy, and Asset Density 69
10.1.2 Smart Asset Fleet Initiatives, Service Depot Automation, and Decarbonization Roadmap 69
10.1.3 SWOT Matrix 70
10.1.4 Product-Specific Operational and Financial Metrics 71
10.2 PECO Pallet 73
10.2.1 Corporate Footprint, North American FMCG Focus, and Distribution Hubs 73
10.2.2 Fleet Maintenance Protocols, Depot Network Scale, and Carrier Alliances 73
10.2.3 SWOT Matrix 74
10.2.4 Product-Specific Operational and Financial Metrics 75
10.3 Faber Group 77
10.3.1 Corporate Footprint, Multi-Division Strategy (IPP, PRS, PAKi), and Circular Logistics 77
10.3.2 Cross-Border Clearing Infrastructure and Payload Circularity Platforms 77
10.3.3 SWOT Matrix 78
10.3.4 Product-Specific Operational and Financial Metrics 79
10.4 Loscam 81
10.4.1 Corporate Footprint, Asia-Pacific Supply Chain Focus, and Depots 81
10.4.2 Standard Pallet Promotion, E-Commerce Integration, and Sub-Depot Densification 81
10.4.3 SWOT Matrix 82
10.4.4 Product-Specific Operational and Financial Metrics 83
10.5 MStar Holdings Corporation 85
10.5.1 Corporate Footprint, Industrial Intermediate Packaging, and Closed-Loop Logistics 85
10.5.2 Automotive Heavy-Duty Fleet Governance and Custom Engineered Dwell Systems 85
10.5.3 SWOT Matrix 86
10.5.4 Product-Specific Operational and Financial Metrics 87
10.6 LEAP India Limited 89
10.6.1 Corporate Footprint, Multi-Modal Asset Pooling Expansion, and Tier-1 Infrastructure 89
10.6.2 FMCG Network Aggregation, Foldable Large Container Deployment, and Depots 89
10.6.3 SWOT Matrix 90
10.6.4 Product-Specific Operational and Financial Metrics 91
10.7 IFCO Systems 93
10.7.1 Corporate Footprint, Global Perishable Supply Chain RPC Pooling Dominance 93
10.7.2 SmartCrate Digital Tracking, Automated Sanitation Depots, and Retail Integration 93
10.7.3 SWOT Matrix 94
10.7.4 Product-Specific Operational and Financial Metrics 95
10.8 Tosca Services LLC 97
10.8.1 Corporate Footprint, End-to-End Perishable and Protein Packaging Operations 97
10.8.2 Polymer Container Innovation, IoT Real-Time Telemetry, and Acquisition Synergies 97
10.8.3 SWOT Matrix 98
10.8.4 Product-Specific Operational and Financial Metrics 99
10.9 Goodpack 101
10.9.1 Corporate Footprint, Global Steel Intermediate Bulk Container (IBC) Fleet Architecture 101
10.9.2 Bulk Synthetic/Natural Rubber Logistics, Liquid Bulk Food, and Industrial Chemical Solutions 101
10.9.3 SWOT Matrix 102
10.9.4 Product-Specific Operational and Financial Metrics 103
10.10 Horen Group 105
10.10.1 Corporate Footprint, Foldable IBC Technology, and Smart Bulk Fluid Pooling Depots 105
10.10.2 Sensor Integration, Aseptic Liner Capabilities, and Intercontinental Reverse Channels 105
10.10.3 SWOT Matrix 106
10.10.4 Product-Specific Operational and Financial Metrics 107
10.11 China International Marine Containers (CIMC) 109
10.11.1 Corporate Footprint, CIMC Wetrans Modular Transport Integration, and Global Hubs 109
10.11.2 Industrial Vehicle Packaging, Auto-Parts Pooling Modules, and Steel Rack Logistics 109
10.11.3 SWOT Matrix 110
10.11.4 Product-Specific Operational and Financial Metrics 111
10.12 iGPS Logistics 113
10.12.1 Corporate Footprint, All-Plastic Pallet Pooling in North American FMCG 113
10.12.2 Embedded RFID Tracking, Automation Compatibility, and Sanitation Advantages 113
10.12.3 SWOT Matrix 114
10.12.4 Product-Specific Operational and Financial Metrics 115
10.13 Euro Pool Group 117
10.13.1 Corporate Footprint, Continental European Fresh Food Logistics and Retail Depots 117
10.13.2 Smart Reverse Logistics (Euro Pool System) and Reverse Pallet Clearing (LPR) 117
10.13.3 SWOT Matrix 118
10.13.4 Product-Specific Operational and Financial Metrics 119
10.14 Japan Pallet Rental Corporation 121
10.14.1 Corporate Footprint, Nationwide Joint Recovery Networks, and Standard T11 Pallet Base 121
10.14.2 RFID Logistical Interconnection, White Logistics Reform, and Truck Dwell Mitigation 121
10.14.3 SWOT Matrix 122
10.14.4 Product-Specific Operational and Financial Metrics 123
10.15 uPR Corporation 125
10.15.1 Corporate Footprint, Active Smart Pallet Ecosystems, and Multi-Industry Asset Rental 125
10.15.2 Connected Logistics Telemetry, Temperature Tracking, and Depot Footprint Expansion 125
10.15.3 SWOT Matrix 126
10.15.4 Product-Specific Operational and Financial Metrics 127
10.16 Nippon Pallet Pool 129
10.16.1 Corporate Footprint, Chemical and Heavy Industrial Shared Logistics Networks 129
10.16.2 Standardized Exchange Systems, Industrial Depot Optimization, and Fleet Allocation 129
10.16.3 SWOT Matrix 130
10.16.4 Product-Specific Operational and Financial Metrics 131
10.17 LogisALL Group 133
10.17.1 Corporate Footprint, Korea Pallet Pool (KPP) and Korea Container Pool (KCP) Scale 133
10.17.2 Cross-Border Asia-Pacific Joint Logistics, Industrial IoT, and Automated Cleaning Depots 133
10.17.3 SWOT Matrix 134
10.17.4 Product-Specific Operational and Financial Metrics 135
10.18 EXZOD India Pvt Ltd 137
10.18.1 Corporate Footprint, Indian Modern Warehousing and Automated Pallet Infrastructure 137
10.18.2 Strategic Regional Hub Siting, AMC Service Infrastructure, and Timber Pool Scalability 137
10.18.3 SWOT Matrix 138
10.18.4 Product-Specific Operational and Financial Metrics 138
Table 2 Quantitative TCO Matrix: Pooling Systems vs. Purchase-and-Disposal One-Way Packaging 8
Table 3 Upstream High-Density Polyethylene and Engineered Hardwood Raw Material Cost Indices (2021-2026) 13
Table 4 Global Reusable Packaging Pooling Market Revenue by Asset Form (2021-2031) (USD Million) 18
Table 5 Global Reusable Packaging Pooling Market Fleet Volume by Asset Form (2021-2031) (Million Units) 19
Table 6 Global Wooden Pallet Pooling Revenue by Region (2021-2031) (USD Million) 20
Table 7 Global Plastic Pallet Pooling Revenue by Region (2021-2031) (USD Million) 21
Table 8 Global Reusable Plastic Crates (RPCs) Pooling Revenue by Region (2021-2031) (USD Million) 23
Table 9 Global Intermediate Bulk Containers (IBCs) Pooling Revenue by Region (2021-2031) (USD Million) 24
Table 10 Global Attached Lid Containers (ALCs) Pooling Revenue by Region (2021-2031) (USD Million) 25
Table 11 Global Other Asset Forms Pooling Revenue by Region (2021-2031) (USD Million) 26
Table 12 Global Reusable Packaging Pooling Market Revenue by Operational Model (2021-2031) (USD Million) 27
Table 13 Global Managed Open-Loop Pooling Market Revenue by Region (2021-2031) (USD Million) 29
Table 14 Global Closed-Loop Pooling Market Revenue by Region (2021-2031) (USD Million) 31
Table 15 Global Fungible / Exchange Open System Market Revenue by Region (2021-2031) (USD Million) 33
Table 16 Global Reusable Packaging Pooling Market Revenue by Downstream Application (2021-2031) (USD Million) 34
Table 17 Fast-Moving Consumer Goods (FMCG) Pooling Revenue by Region (2021-2031) (USD Million) 36
Table 18 Fresh Produce and Agriculture Pooling Revenue by Region (2021-2031) (USD Million) 38
Table 19 Automotive and Industrial Manufacturing Pooling Revenue by Region (2021-2031) (USD Million) 40
Table 20 3PL, E-Commerce, and Retail Logistics Pooling Revenue by Region (2021-2031) (USD Million) 41
Table 21 Other Downstream Applications Pooling Revenue by Region (2021-2031) (USD Million) 42
Table 22 North America Reusable Packaging Pooling Revenue by Asset Form (2021-2031) (USD Million) 49
Table 23 United States Reusable Packaging Pooling Market Metrics by Segment (2021-2031) 50
Table 24 Canada Reusable Packaging Pooling Market Metrics by Segment (2021-2031) 51
Table 25 Mexico Reusable Packaging Pooling Market Metrics by Segment (2021-2031) 52
Table 26 Europe Reusable Packaging Pooling Revenue by Asset Form (2021-2031) (USD Million) 53
Table 27 Germany Reusable Packaging Pooling Market Metrics by Segment (2021-2031) 54
Table 28 France Reusable Packaging Pooling Market Metrics by Segment (2021-2031) 55
Table 29 United Kingdom Reusable Packaging Pooling Market Metrics by Segment (2021-2031) 56
Table 30 Spain and Italy Reusable Packaging Pooling Market Metrics by Segment (2021-2031) 57
Table 31 Netherlands and Poland Reusable Packaging Pooling Market Metrics by Segment (2021-2031) 58
Table 32 Asia-Pacific Reusable Packaging Pooling Revenue by Asset Form (2021-2031) (USD Million) 59
Table 33 China Reusable Packaging Pooling Market Metrics by Segment (2021-2031) 60
Table 34 Japan and South Korea Reusable Packaging Pooling Market Metrics by Segment (2021-2031) 61
Table 35 India Reusable Packaging Pooling Market Metrics by Segment (2021-2031) 62
Table 36 Australia and Southeast Asia Reusable Packaging Pooling Market Metrics by Segment (2021-2031) 63
Table 37 South America Reusable Packaging Pooling Revenue by Asset Form (2021-2031) (USD Million) 64
Table 38 Middle East and Africa Reusable Packaging Pooling Revenue by Asset Form (2021-2031) (USD Million) 65
Table 39 Global Reusable Packaging Pooling Market Share Concentration (CR4, CR8, HHI) (2021-2026) 66
Table 40 Brambles Limited Reusable Packaging Pooling Revenue, Cost, and Gross Margin (2021-2026) 71
Table 41 PECO Pallet Reusable Packaging Pooling Revenue, Cost, and Gross Margin (2021-2026) 75
Table 42 Faber Group Reusable Packaging Pooling Revenue, Cost, and Gross Margin (2021-2026) 79
Table 43 Loscam Reusable Packaging Pooling Revenue, Cost, and Gross Margin (2021-2026) 83
Table 44 MStar Holdings Corporation Reusable Packaging Pooling Revenue, Cost, and Gross Margin (2021-2026) 87
Table 45 LEAP India Limited Reusable Packaging Pooling Revenue, Cost, and Gross Margin (2021-2026) 91
Table 46 IFCO Systems Reusable Packaging Pooling Revenue, Cost, and Gross Margin (2021-2026) 95
Table 47 Tosca Services LLC Reusable Packaging Pooling Revenue, Cost, and Gross Margin (2021-2026) 99
Table 48 Goodpack Reusable Packaging Pooling Revenue, Cost, and Gross Margin (2021-2026) 103
Table 49 Horen Group Reusable Packaging Pooling Revenue, Cost, and Gross Margin (2021-2026) 107
Table 50 China International Marine Containers (CIMC) Reusable Packaging Pooling Revenue, Cost, and Gross Margin (2021-2026) 111
Table 51 iGPS Logistics Reusable Packaging Pooling Revenue, Cost, and Gross Margin (2021-2026) 115
Table 52 Euro Pool Group Reusable Packaging Pooling Revenue, Cost, and Gross Margin (2021-2026) 119
Table 53 Japan Pallet Rental Corporation Reusable Packaging Pooling Revenue, Cost, and Gross Margin (2021-2026) 123
Table 54 uPR Corporation Reusable Packaging Pooling Revenue, Cost, and Gross Margin (2021-2026) 127
Table 55 Nippon Pallet Pool Reusable Packaging Pooling Revenue, Cost, and Gross Margin (2021-2026) 131
Table 56 LogisALL Group Reusable Packaging Pooling Revenue, Cost, and Gross Margin (2021-2026) 135
Table 57 EXZOD India Pvt Ltd Reusable Packaging Pooling Revenue, Cost, and Gross Margin (2021-2026) 138
Figure 1 Reusable Packaging Pooling Value Chain Architecture and Material Flow 2
Figure 2 Research Methodology Framework and Multi-Source Data Triangulation Process 3
Figure 3 Global Reusable Packaging Pooling Market Size and Growth Trajectory (2021-2031) (USD Billion) 7
Figure 4 Fleet Smart Asset Connectivity Penetration Curve: RFID vs. Cellular IoT (2021-2031) 10
Figure 5 Raw Material Supply Chain Flow: Virgin vs. Post-Consumer Recycled Plastics and Engineered Timber 13
Figure 6 Reverse Logistics Depot Network Architecture: Automated Sorting, Washing, and Repair Cycles 16
Figure 7 Global Reusable Packaging Pooling Market Share by Asset Form (2026 vs. 2031) 18
Figure 8 Wooden Pallet Fleet Utilization and Annual Turn Velocity Dynamics (2021-2026) 20
Figure 9 Reusable Plastic Crates (RPCs) vs. Corrugated Boxes: Cycle Life and Carbon Equivalent Abatement 22
Figure 10 Intermediate Bulk Container Fleet Growth in Chemical and Food Processing Sectors (2021-2031) 24
Figure 11 Global Reusable Packaging Pooling Market Share by Operational Model (2026) 27
Figure 12 Managed Open-Loop (Issue-Deposit-Collect) Structural Velocity and Clearings Architecture 28
Figure 13 Dedicated Closed-Loop Captive Flow Diagram: Automotive and High-Integrity Manufacturing 30
Figure 14 Fungible / Exchange Open Model: Pallet Bank Voucher and Direct Interchange Mechanics 32
Figure 15 Global Reusable Packaging Pooling Market Share by Downstream Application (2026) 34
Figure 16 FMCG and Packaged Foods Pooling Adoption Velocity across Tier-1 Retail Channels (2021-2031) 36
Figure 17 Agricultural Field-to-Store Cold Chain Integration Architecture for Pooling Assets 38
Figure 18 Automotive Supply Chain Just-In-Time Component Packaging Pooling Architecture 40
Figure 19 Global Trade Corridor Asset Flow Imbalances and Transpacific/Transatlantic Repositioning Routes 43
Figure 20 Reverse Cross-Border Deadhead Mileage Mitigation Framework 45
Figure 21 Regional Market Share Distribution: North America, Europe, Asia-Pacific, South America, and MEA (2026) 49
Figure 22 North American Pallet and Container Fleet Concentration by Sub-Region (2021-2031) 50
Figure 23 European Circular Logistics Penetration Post-PPWR Enforcement (2021-2031) 53
Figure 24 Asia-Pacific Reusable Packaging Pooling Velocity: China and India Growth vs. Mature Japan/Korea Markets 59
Figure 25 Global Reusable Packaging Pooling Market Competitor Positioning Tiering (2026) 67
Figure 26 Brambles Limited Reusable Packaging Pooling Market Share (2021-2026) 72
Figure 27 PECO Pallet Reusable Packaging Pooling Market Share (2021-2026) 76
Figure 28 Faber Group Reusable Packaging Pooling Market Share (2021-2026) 80
Figure 29 Loscam Reusable Packaging Pooling Market Share (2021-2026) 84
Figure 30 MStar Holdings Corporation Reusable Packaging Pooling Market Share (2021-2026) 88
Figure 31 LEAP India Limited Reusable Packaging Pooling Market Share (2021-2026) 92
Figure 32 IFCO Systems Reusable Packaging Pooling Market Share (2021-2026) 96
Figure 33 Tosca Services LLC Reusable Packaging Pooling Market Share (2021-2026) 100
Figure 34 Goodpack Reusable Packaging Pooling Market Share (2021-2026) 104
Figure 35 Horen Group Reusable Packaging Pooling Market Share (2021-2026) 108
Figure 36 China International Marine Containers (CIMC) Reusable Packaging Pooling Market Share (2021-2026) 112
Figure 37 iGPS Logistics Reusable Packaging Pooling Market Share (2021-2026) 116
Figure 38 Euro Pool Group Reusable Packaging Pooling Market Share (2021-2026) 120
Figure 39 Japan Pallet Rental Corporation Reusable Packaging Pooling Market Share (2021-2026) 124
Figure 40 uPR Corporation Reusable Packaging Pooling Market Share (2021-2026) 128
Figure 41 Nippon Pallet Pool Reusable Packaging Pooling Market Share (2021-2026) 132
Figure 42 LogisALL Group Reusable Packaging Pooling Market Share (2021-2026) 136
Figure 43 EXZOD India Pvt Ltd Reusable Packaging Pooling Market Share (2021-2026) 138
Research Methodology
- Market Estimated Methodology:
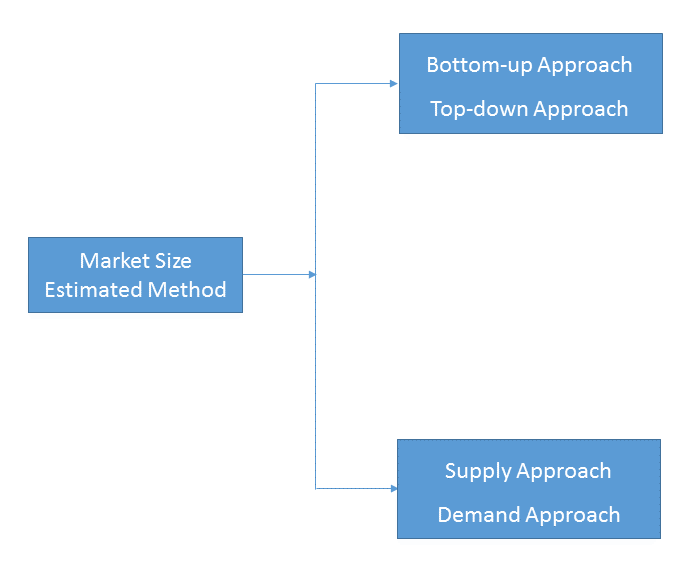
Bottom-up & top-down approach, supply & demand approach are the most important method which is used by HDIN Research to estimate the market size.
1)Top-down & Bottom-up Approach
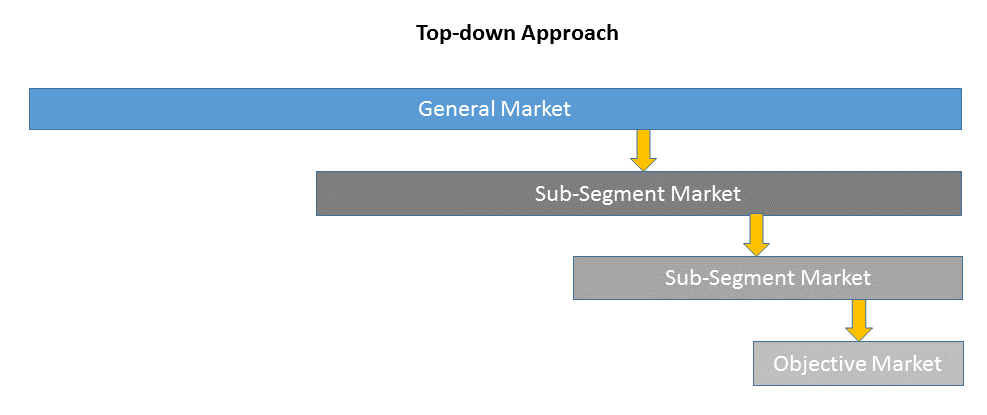
Top-down approach uses a general market size figure and determines the percentage that the objective market represents.
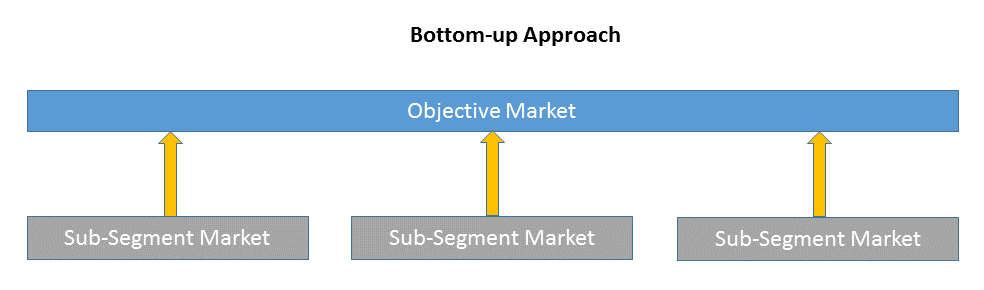
Bottom-up approach size the objective market by collecting the sub-segment information.
2)Supply & Demand Approach
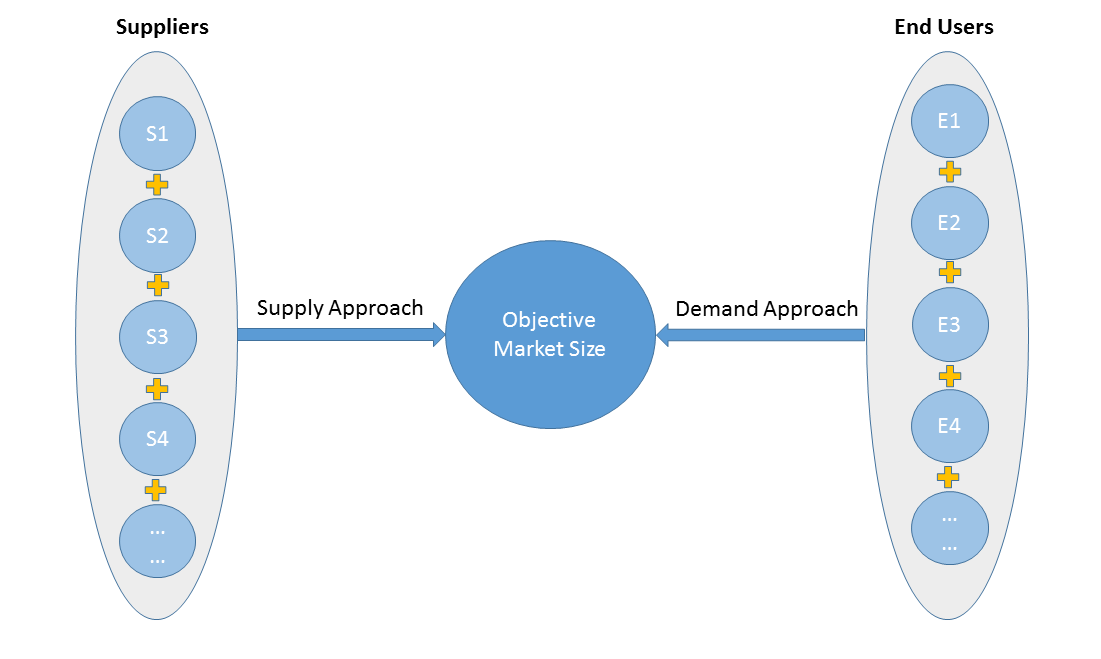
Supply approach is based on assessments of the size of each competitor supplying the objective market.
Demand approach combine end-user data within a market to estimate the objective market size. It is sometimes referred to as bottom-up approach.
- Forecasting Methodology
- Numerous factors impacting the market trend are considered for forecast model:
- New technology and application in the future;
- New project planned/under contraction;
- Global and regional underlying economic growth;
- Threatens of substitute products;
- Industry expert opinion;
- Policy and Society implication.
- Analysis Tools
1)PEST Analysis
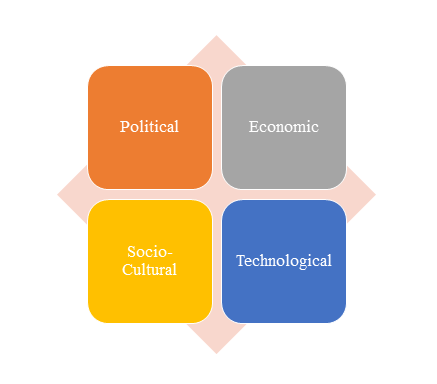
PEST Analysis is a simple and widely used tool that helps our client analyze the Political, Economic, Socio-Cultural, and Technological changes in their business environment.
- Benefits of a PEST analysis:
- It helps you to spot business opportunities, and it gives you advanced warning of significant threats.
- It reveals the direction of change within your business environment. This helps you shape what you’re doing, so that you work with change, rather than against it.
- It helps you avoid starting projects that are likely to fail, for reasons beyond your control.
- It can help you break free of unconscious assumptions when you enter a new country, region, or market; because it helps you develop an objective view of this new environment.
2)Porter’s Five Force Model Analysis
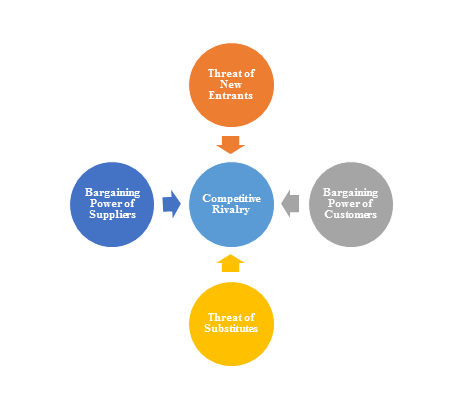
The Porter’s Five Force Model is a tool that can be used to analyze the opportunities and overall competitive advantage. The five forces that can assist in determining the competitive intensity and potential attractiveness within a specific area.
- Threat of New Entrants: Profitable industries that yield high returns will attract new firms.
- Threat of Substitutes: A substitute product uses a different technology to try to solve the same economic need.
- Bargaining Power of Customers: the ability of customers to put the firm under pressure, which also affects the customer's sensitivity to price changes.
- Bargaining Power of Suppliers: Suppliers of raw materials, components, labor, and services (such as expertise) to the firm can be a source of power over the firm when there are few substitutes.
- Competitive Rivalry: For most industries the intensity of competitive rivalry is the major determinant of the competitiveness of the industry.
3)Value Chain Analysis
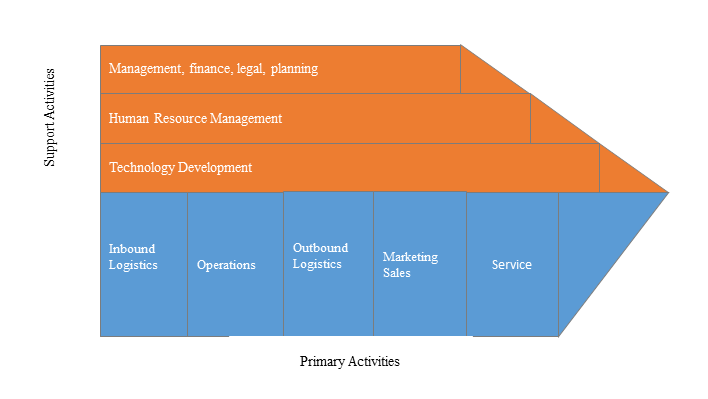
Value chain analysis is a tool to identify activities, within and around the firm and relating these activities to an assessment of competitive strength. Value chain can be analyzed by primary activities and supportive activities. Primary activities include: inbound logistics, operations, outbound logistics, marketing & sales, service. Support activities include: technology development, human resource management, management, finance, legal, planning.
4)SWOT Analysis
SWOT analysis is a tool used to evaluate a company's competitive position by identifying its strengths, weaknesses, opportunities and threats. The strengths and weakness is the inner factor; the opportunities and threats are the external factor. By analyzing the inner and external factors, the analysis can provide the detail information of the position of a player and the characteristics of the industry.
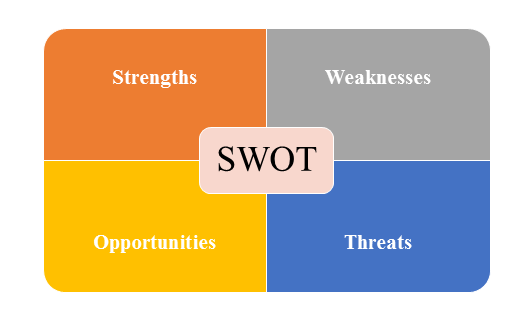
- Strengths describe what the player excels at and separates it from the competition
- Weaknesses stop the player from performing at its optimum level.
- Opportunities refer to favorable external factors that the player can use to give it a competitive advantage.
- Threats refer to factors that have the potential to harm the player.
- Data Sources
| Primary Sources | Secondary Sources |
|---|---|
| Face to face/Phone Interviews with market participants, such as: Manufactures; Distributors; End-users; Experts. Online Survey |
Government/International Organization Data: Annual Report/Presentation/Fact Book Internet Source Information Industry Association Data Free/Purchased Database Market Research Report Book/Journal/News |