Lead-Acid Battery Market Strategy & Outlook
- Single User License (1 Users) $ 3,500
- Team License (2~5 Users) $ 4,500
- Corporate License (>5 Users) $ 5,500
The global lead-acid battery market size is valued at an estimated 42 billion to 46 billion USD in 2026. The sector is projected to expand at a compound annual growth rate (CAGR) of 2.2% to 4.2% through 2031, propelled by high-margin structural upgrades rather than purely volumetric expansion. Traditional flooded battery volumes are entering a cyclical plateau, while advanced Valve-Regulated Lead-Acid (VRLA), Absorbed Glass Mat (AGM), Thin Plate Pure Lead (TPPL), and Lead-Carbon (Pb-C) architectures experience accelerated value capture. Despite aggressive encroachment from lithium iron phosphate (LFP) and nascent sodium-ion chemistries, lead-acid technology retains an unassailable moat in specific high-reliability domains. This resilience is anchored by zero thermal runaway risk, superior high-rate instantaneous pulse discharge for artificial intelligence data centers (AIDC) and 12V automotive starting, low initial capital expenditure, and a closed-loop circular supply chain achieving 95% to 99% secondary recovery rates under strict Extended Producer Responsibility (EPR) regimes. A consolidated oligopoly of global tier-one manufacturers—led by Clarios, EnerSys, GS Yuasa Corporation, Exide Industries Ltd, Tianneng Battery Group, Chaowei Power Holdings Limited, East Penn Manufacturing Company, and Leoch International Technology Limited—dominates the global electrochemical reserve and starting power apparatus. Asia-Pacific commands the largest volumetric share, anchored by China's massive manufacturing base and Southeast Asian export hubs like Thailand. North America and Europe represent high-value margin sanctuaries driven by data center buildouts and strict vehicular Start-Stop mandates.
Electrochemical Architecture & Structural Taxonomy
The durability of the lead-acid battery ecosystem rests on a mature, highly predictable reversible redox reaction between a Lead Dioxide (PbO2) cathode, a high-purity Sponge Lead (Pb) anode, and an aqueous sulfuric acid (H2SO4) electrolyte. During discharge, active materials convert to Lead Sulfate (PbSO4), reversing seamlessly upon electrical charge input. The primary arena for technological differentiation has shifted from fundamental chemistry to mechanical grid engineering and electrolyte immobilization:
- Grid Metallurgy and Stamping: Legacy gravity casting of Lead-Antimony (Pb-Sb) alloys is steadily yielding to continuous high-speed punch-grid stamping utilizing Lead-Calcium-Tin (Pb-Ca-Sn) and Lead-Silver (Pb-Ag) alloys. This metallurgical shift minimizes gassing, curtails self-discharge, and resists positive grid corrosion under high-temperature operating envelopes.
- Active Mass Formulation: Ball-milled lead oxide powder is combined with specialized organic expanders (such as lignosulfonates), barium sulfate, and conductive carbon additives before undergoing tightly controlled hydrothermal curing and chemical conversion coating.
- Separator and Containment Matrix: Microporous Polyethylene (PE) envelopes and compressed borosilicate micro-glass fiber (AGM) mats prevent dendritic short-circuiting while optimizing ionic transport. Containers molded from high-impact Polypropylene (PP) utilize CAD/CAM-engineered heat-sealed double lids fitted with elastomeric one-way Bunsen relief valves to eliminate acid stratification and electrolyte evaporation.
● Market Taxonomy by Functional Profile:
- SLI Batteries (Starting, Lighting, and Ignition): Engineered with thin plates to maximize surface area and minimize internal resistance, delivering instantaneous cold-cranking amperage (CCA) bursts. Crucial for internal combustion engine (ICE) ignition and indispensable as the 12V low-voltage auxiliary power source in Battery Electric Vehicles (BEVs) to govern electronic control units (ECUs), Advanced Driver Assistance Systems (ADAS), and high-voltage contactor relays.
- Power Batteries (Motive Power and Traction): Constructed with thick flat or tubular positive plates armored in braided gauntlets to withstand repetitive deep-cycle discharges (up to 80% Depth of Discharge). Primary deployments include warehouse electric forklifts (where battery mass simultaneously serves as vital mechanical counterweight), Automated Guided Vehicles (AGVs), and light electric mobility fleets (E-bikes and E-trikes).
- Stationary Batteries (Reserve and Standby Power): Optimized for continuous float-charge longevity and high-rate short-duration discharge. Deployed across hyperscale cloud installations, AI compute clusters, 4G/5G telecommunications base stations, nuclear and fossil utility switchgear, and off-grid hybrid renewable micro-grids.
● Market Taxonomy by Electrolyte and Sealing Structure:
- Flooded Lead-Acid Batteries: Utilize liquid sulfuric acid bathing Pb-Sb or Pb-Ca plates. While requiring periodic distilled water replenishment due to electrolysis gassing, they remain the dominant architecture for cost-sensitive automotive starting, agricultural machinery, marine applications, and residential inverter backup across developing economies due to high thermal and overcharge tolerance.
- Valve-Regulated Lead-Acid (VRLA) Batteries: Divided into AGM Batteries and Gel Batteries. AGM immobilizes the electrolyte within fiberglass mats, enabling oxygen recombination cycles that yield maintenance-free, spill-proof operation with ultra-low internal resistance—ideal for automotive Start-Stop systems and high-rate data center Uninterruptible Power Supplies (UPS). Within the AGM tier, Thin Plate Pure Lead (TPPL) technology utilizes 99.99% virgin lead grids to achieve extreme power density and fast-charge acceptance for defense, aerospace, and premium industrial applications. Gel batteries immobilize acid via fumed silica (forming a thixotropic gel), frequently paired with tubular plates (OPzV) to prevent acid stratification and maximize deep-cycle resilience in high-ambient-temperature telecom and solar installations.
- Lead-Carbon (Pb-C) Batteries: Integrate activated carbon or nanoscale graphene directly into the negative active mass, creating an asymmetric supercapacitor-battery hybrid. This structural modification mitigates negative plate sulfation during Partial State of Charge (PSoC) cycling, extending cycle life three- to four-fold in utility frequency regulation and industrial peak-shaving applications.
Regional Market Dynamics & Cross-Border Trade Corridors
● Asia-Pacific: Asia-Pacific serves as the primary volumetric anchor and global export engine.
- China: Despite fierce domestic substitution from a lithium-ion apparatus that shipped 1,888 GWh in 2025, China remains the world's largest producer and consumer of lead-acid batteries. Demand is underpinned by a domestic automotive manufacturing output of 34.53 million vehicles in 2025 and an active national vehicle parc exceeding 366 million units. Furthermore, the enforcement of China's New National Standard for electric bicycles—combined with government trade-in subsidies favoring non-combustible chemistries—has solidified lead-acid dominance in the two- and three-wheeler motive segment, which turns over on a strict 18-to-24-month replacement cycle.
- India: Driven by rapid industrialization, erratic regional utility grids, and expanding commercial mobility, India exhibits robust expansion across SLI, home inverter tubular batteries, and railway signaling systems. Regulatory enforcement of the Battery Waste Management Rules (BWMR) is actively squeezing out unorganized street-side assemblers in favor of compliant giants like Exide Industries and Amara Raja Energy & Mobility.
- Southeast Asia: The ASEAN corridor functions as a critical global manufacturing and export node. In Thailand, annual lead-acid battery production reached 25.14 million units in 2025, supporting 13.97 million units in domestic absorptive capacity and 12.84 million units in export shipments, spearheaded by Thai Energy Storage Technology (TES / 3K) and Yuasa Battery (Thailand) PCL. In Vietnam, Dry Cell and Storage Battery JSC (PINACO) and Kung Long Batteries leverage competitive labor and trade agreements to dominate local two-wheeler and automotive replacement channels while scaling exports to the Middle East.
- Taiwan (China): Manufacturers in Taiwan, China—most notably Kung Long Batteries and CSB Energy Technology—have deliberately bypassed low-margin commoditized automotive SLI segments to specialize in high-margin VRLA, AGM, and UPS backup blocks engineered for global data center integrators and medical mobility OEMs.
● North America
The North American corridor (United States, Canada, Mexico) is characterized by rapid value migration toward premium AGM and TPPL configurations. An aging domestic vehicle fleet alongside high penetration of Start-Stop micro-hybrid powertrains drives high-margin Replacement Equipment Market (REM) turnover. Furthermore, the United States sits at the epicenter of global AI data center construction, triggering acute demand for high-rate VRLA UPS cabinets. To bypass tariff barriers and shorten logistics chains for North American automotive OEMs and hyperscale cloud clients, Asian producers are aggressively nearshoring; notably, Leoch International has established a major manufacturing footprint in Mexico, while Amara Raja has incorporated a dedicated operating subsidiary in the United States to transition from a direct-export model to localized distribution.
● Europe
Europe represents a mature, highly regulated market dominated by premium EFB (Enhanced Flooded Battery) and AGM automotive replacements, alongside specialized industrial traction and rail reserve power. Growth is heavily dictated by compliance with the European Union Batteries Regulation 2023/1542, which enforces mandatory carbon footprint declarations and strict recycled lead content minimums. Additionally, the European Waste Catalogue (EWC) Code 16.06 update—adopted via EU Delegated Decision on March 5, 2025, and taking full effect across Member States in November 2026—tightens hazardous waste tracking protocols across cross-border recycling corridors, insulating established European players with captive smelting capacity (such as Seri Industrial S.p.A. and Clarios) from low-cost imports.
● Middle East & Africa
MEA presents a high-growth arbitrage window driven by rising motorization rates, extreme climatic stress on vehicular electrical systems, and chronic utility grid instability requiring solar-hybrid and diesel-generator starting backup. High ambient temperatures accelerate positive grid corrosion, shortening battery lifespans and accelerating replacement velocity. Turkish manufacturers—specifically Yiğit Akü, Mutlu Akü, and Esan Akü—leverage geographic proximity to export automotive SFB, EFB, and AGM units across over 100 countries in the region. Concurrently, Asian contenders are entrenching local footprints: Amara Raja operates a regional hub in Sharjah, UAE (Amara Raja Batteries Middle East FZE), Leoch has rolled out specialized high-temperature corrosion-resistant VRLA lines across Africa, and Vietnam's PINACO has established recurring export channels into Saudi Arabia, Qatar, Bahrain, Kuwait, and Nigeria.
● South America
South America functions primarily as an automotive aftermarket and mining/agricultural motive power market. High import tariffs on finished vehicles prolong the operational life of the regional ICE fleet, sustaining baseline demand for conventional flooded and EFB starter batteries. Global suppliers like Leoch and Amara Raja are actively expanding dealer networks across Brazil, Argentina, and Chile, utilizing newly commissioned Mexican and regional logistics hubs to compress delivery lead times.
Downstream Application Matrix & Value Migration
● Datacenters & AI Cloud Infrastructure (The High-Margin Growth Engine)
The rapid proliferation of generative artificial intelligence workloads and hyperscale cloud computing has fundamentally altered data center power architectures. Server racks transitioning from 10-15 kW to 50-100+ kW densities require immediate, massive pulse power during utility grid sags or transfer-switch transitions to backup generators. High-rate VRLA AGM and TPPL batteries remain the default specification for Tier-3 and Tier-4 data center UPS integrators (such as Eaton, Vertiv, Schneider Electric, and Delta). Unlike lithium-ion systems—which face stringent municipal fire code restrictions, thermal runaway anxieties, and expensive liquid-cooling requirements in dense urban colocation facilities—lead-acid UPS banks offer intrinsic thermal stability and superior 5-to-15-minute high-rate discharge economics.
● Automotive Sector (ICE, Start-Stop Hybrids, and BEV 12V Auxiliary)
The automotive vertical operates on a two-speed commercial model: narrow-margin Original Equipment Manufacturer (OEM) first-fit contracts (supplying assembly lines for Toyota, Volkswagen, BMW, and BYD) and high-margin Replacement Equipment Market (REM) aftermarket channels (executed through master distributors and retail service chains like B-Quik in Thailand). While pure ICE vehicle sales face long-term secular headwinds, the expansion of micro-hybrid Start-Stop systems forces a mandatory consumer upgrade from standard flooded batteries to higher-priced EFB and AGM units, expanding revenue per vehicle. Crucially, the rise of Battery Electric Vehicles (BEVs) does not eliminate the lead-acid battery; virtually all BEVs retain a 12V low-voltage lead-acid auxiliary battery to provide fail-safe power for autonomous braking, steering, door actuators, and high-voltage lithium pack wake-up relays should the main traction battery fault.
● Light Electric Mobility (E-Bikes, E-Trikes, and Micro-EVs)
In China, India, and Southeast Asia, commercial delivery fleets, agricultural three-wheelers, and urban commuters rely heavily on deep-cycle motive lead-acid batteries. Although LFP and sodium-ion cells compete for high-end consumer e-bikes, lead-acid retains an estimated 70%+ share in the utility two- and three-wheeler space. The value proposition is anchored by an upfront acquisition cost less than half that of lithium equivalents, zero risk of catastrophic fires during indoor residential charging, and high residual scrap value. Because a spent lead-acid pack retains substantial intrinsic metallic value, consumers easily finance replacements through ""trade-in"" swaps every 18 to 24 months.
● Industrial Motive Power & Heavy Logistics Equipment
In automated warehousing, port logistics, and heavy manufacturing, electric counterbalance forklifts, airport ground support equipment, and mining locomotives rely on heavy-duty tubular and flat-plate traction batteries. In class-1, -2, and -3 electric forklifts, the extreme mass density of lead-acid battery packs is an engineering asset rather than a liability, serving as the mandatory physical counterweight required to balance heavy pallet loads at high mast elevations.
● Telecommunications Infrastructure (4G/5G Base Stations)
The telecommunications vertical represents the primary battleground of chemistry substitution. Major telecom tower operators in China and India have largely transitioned urban macro-cells to LFP battery banks to capitalize on higher cycle life under frequent grid blackouts. However, deep-cycle VRLA Gel and tubular OPzV batteries retain a persistent foothold in remote off-grid base stations, extreme sub-zero or desert climates where lithium battery management systems (BMS) fault without auxiliary heating/cooling, and regions plagued by high battery theft (where modular lithium packs are prime targets for illicit resale).
● Specialized Defense, Rail, and Off-Grid Storage
High barriers to entry protect specialized niches from commoditization. In naval defense, conventional diesel-electric submarines rely on massive, specialized lead-acid battery banks capable of high-capacity discharge under extreme submerged atmospheric pressure without risking toxic gas venting or unquenchable lithium fires; this ultra-high-margin niche is dominated by players like GS Yuasa, Exide Industries, HBL Engineering, and High Energy Batteries (India) Ltd. Concurrently, railway signaling, hospital operating room backup, and rural solar home inverters continue to absorb steady volumes of tubular Gel and Lead-Carbon systems.
Supply Chain Architecture & The Closed-Loop Circular Moat
The lead-acid battery industry are governed by upstream commodity exposure and downstream reverse-logistics integration. Refined primary lead and secondary recycled lead constitute 70% to 80% of direct cell manufacturing costs. Because raw lead pricing is tethered to the London Metal Exchange (LME), unhedged manufacturers face severe margin compression during commodity spikes or foreign exchange fluctuations—compounded by price volatility in secondary inputs such as Tin (Sn), Antimony (Sb), Silver (Ag), Copper (Cu), and Polypropylene (PP) copolymer resins.
To insulate operating margins from LME volatility and comply with tightening environmental mandates, tier-one manufacturers have constructed the world's most successful industrial circular economy. Unlike lithium-ion recycling—which remains plagued by complex hydrometallurgical extraction costs and fluctuating black-mass economics—lead-acid batteries achieve a global collection and recovery rate of 95% to 99%.
● Bottleneck Resilience and Vertical Smelting Integration
Strategic audits confirm that captive secondary lead smelting is the single most decisive operational moat in the modern battery industry. Under Extended Producer Responsibility (EPR) frameworks—such as India's BWMR 2022/2023 Amendments and China's green manufacturing mandates—producers must operate ""Buy One, Reclaim One"" reverse logistics networks, utilizing their forward wholesale distribution channels to backhaul Used Lead-Acid Batteries (ULAB) to licensed rotary or reverberatory smelters.
● Midstream Manufacturing Bottlenecks
Within the cell assembly plant, capital intensity is concentrated in two critical bottlenecks: Continuous Grid Stamping and Tank/Container Formation. Transitioning from legacy book-mold gravity casting to high-speed continuous precision stamping requires substantial upfront capital expenditure (CAPEX), systematically pricing out smaller tier-three assemblers. Furthermore, the electrochemical formation step—where pasted and cured PbO grids are electrically charged in sulfuric acid baths for 24 to 72 hours—is highly energy-intensive and subject to strict environmental air-scrubbing audits for acid mist emissions. Environmental compliance inspections in China, Europe, and North America have effectively frozen greenfield smelting and formation permits, handing an insurmountable structural advantage to incumbent operators possessing grandfathered environmental licenses.
Competitive Landscape & Strategic Company Dossiers
● Global Conglomerates
- Clarios: As the world's largest automotive battery manufacturer (producing roughly one-third of the automotive industry's output globally under brands including VARTA, OPTIMA, and LTH), Clarios commands unmatched OEM first-fit integration and a closed-loop North American and European recycling network. Aggressively shifting production capacity away from standard flooded SLI units toward high-margin AGM and EFB architectures tailored for Start-Stop platforms and software-defined BEV low-voltage auxiliary networks, positioning its AGM batteries as the essential safety redundancy layer for autonomous driving systems.
- EnerSys: The premier global authority in Thin Plate Pure Lead (TPPL) technology (marketed under the Odyssey, Hawker, and DataSafe brands). EnerSys maintains deep entrenchment within North American and European defense, aerospace, nuclear standby, and automated material handling sectors. Transitioning from a pure battery hardware vendor into an integrated energy management provider. EnerSys is pairing its maintenance-free NexSys TPPL motive and stationary blocks with proprietary high-frequency modular chargers and wireless IoT battery monitoring software to lock in enterprise warehouse and telecom clients on a lowest-Total-Cost-of-Ownership (TCO) basis.
- GS Yuasa Corporation: Commands dominant market share across Japanese OEM assembly lines (Toyota, Honda, Nissan) and Southeast Asian motorcycle and automotive replacement corridors (via subsidiaries like Yuasa Battery Thailand PCL). Possesses ultra-high-barrier technological monopolies in deep-submergence naval submarine batteries and civil aviation backup. Leveraging high cash flows from its cash-cow Asian lead-acid aftermarket operations to cross-subsidize dual-track R&D in high-rate data center VRLA UPS systems and next-generation solid-state/lithium automotive cells, while consolidating replacement market pricing power across ASEAN.
- Exide Industries Ltd: The undisputed market leader in the Indian sub-continent, reinforced by an expansive pan-Indian dealer network, deep institutional relationships with Indian Railways and the Ministry of Defence (submarine batteries), and 346 KMT of captive secondary smelting via Chloride Metals Limited. Executing a dual-engine capital allocation strategy—maximizing free cash flow and EPR-compliant cost leadership in core lead-acid automotive, solar tubular, and home inverter verticals while scaling a massive greenfield LFP cell manufacturing gigafactory in Bengaluru to hedge long-term EV powertrain transition risks.
- East Penn Manufacturing Company & Stryten Energy: Privately held East Penn (operating the massive single-site manufacturing and smelting complex in Lyon Station, Pennsylvania, under the Deka brand) and Stryten Energy form the backbone of the domestic US automotive aftermarket, commercial trucking, and military reserve supply chain. Capitalizing on US domestic content incentives and data center security mandates by expanding high-rate AGM and tubular motive production, insulating North American retail auto-parts chains and logistics operators from trans-Pacific maritime freight volatility.
● European Industrial Specialists
- FIAMM Energy Technology S.p.A., Banner Group, & Midac: Deeply entrenched in the European OEM first-fit corridor (supplying German, Italian, and French automakers) and the continental Start-Stop replacement aftermarket. Banner Group (Austria) and FIAMM (Italy, backed by Resonac/Showa Denko heritage) command strong brand equity in harsh winter CCA performance, while Midac excels in heavy-duty European forklift traction cells. Re-engineering product portfolios to achieve full compliance with EU Regulation 2023/1542 carbon passport mandates, focusing capital on high-cycle EFB and AGM lines to service Europe's rapidly expanding micro-hybrid vehicle parc.
- BAE Batterien GmbH & HOPPECKE Batterien GmbH & Co. KG: German industrial engineering specialists commanding high margins in ultra-long-life stationary tubular Gel (OPzV) and flooded (OPzS) architectures. HOPPECKE and BAE are specification standards for European utility substations, railway signaling interlocks, and off-grid industrial micro-grids. Integrating smart battery management controllers and hybridizing lead-acid reserve banks with lithium peak-shaving modules to provide turnkey grid-stabilization packages for European renewable energy operators.
- Seri Industrial S.p.A.: Unique vertical integration across the Italian and European value chain, combining Repiombo's secondary lead smelting (92% internal self-sufficiency) and Seri Plast's polypropylene recycling with FIB's industrial and motive battery manufacturing. Utilizing EU circular economy subsidies and strict waste transport regulations (EWC Code 16.06) to capture market share from non-integrated European competitors struggling with raw material compliance costs.
● Chinese & Asian High-Volume Titans
- Tianneng Battery Group & Chaowei Power Holdings Limited: The global duopoly governing light electric mobility motive power. Together, Tianneng and Chaowei control over 80% of China's massive electric two- and three-wheeler battery market, underpinned by unmatched economies of scale, automated continuous grid-casting lines, and capillary village-level distribution and trade-in networks. Aggressively commercializing graphene-enhanced Lead-Carbon (Pb-C) motive batteries to boost energy density and cycle life, successfully defending their core E-bike turf against low-cost LFP and sodium-ion encroachments while expanding manufacturing bases into Vietnam and Southeast Asia.
- Camel Group: China's premier automotive SLI and Start-Stop battery producer, holding dominant domestic OEM share alongside an 860,000-ton/year closed-loop national recycling infrastructure Accelerating international aftermarket expansion across Belt and Road corridors and Europe, while rapidly scaling 12V/24V/48V low-voltage auxiliary battery solutions (both advanced AGM and low-voltage lithium) for global EV manufacturers.
- Leoch International Technology Limited: China's most globally diversified lead-acid exporter, operating a nimble multi-country manufacturing footprint across China, Malaysia, Vietnam, India, and Mexico. A primary global supplier of telecom VRLA and data center AGM batteries. Executing aggressive geographic arbitrage by ramping up its Mexican manufacturing plant to capture North American data center UPS and automotive OEM contracts, alongside deploying high-temperature-resistant VRLA chemistries to capture telecom and solar backup market share across the Middle East and Africa.
- Shuangdeng Group, Narada Power, Shenzhen Kstar, & Vision Group: Deeply embedded in the global ICT, telecommunications, and hyperscale data center supply chains. Narada and Shuangdeng are pioneers in utility-scale Lead-Carbon energy storage and telecom reserve power, while Kstar and Vision Group combine battery manufacturing with power electronics (UPS hardware) integration. Pivoting heavily away from commoditized domestic telecom base station tenders toward high-margin global AI data center (AIDC) buildouts.
- Kung Long Batteries, CSB Energy Technology, Sacred Sun, & Ritar International: Specialized VRLA and AGM manufacturers with deep, multi-decade B2B qualification locks with global UPS OEMs (Schneider/APC, Eaton, Vertiv) and medical mobility equipment makers. Shifting product mixes toward high-rate-discharge, flame-retardant VRLA blocks and TPPL variants specifically engineered for compact, high-density edge computing servers and hospital critical-care infrastructure.
● Regional Champions (APAC, India, & MEA)
- Amara Raja Energy & Mobility Limited & HBL Engineering Limited (India): Amara Raja (Amaron brand) forms a powerful duopoly with Exide in India's automotive and industrial sectors, backed by 88.27% recycled lead integration. HBL Engineering commands high-margin niches in Indian railway electronics, defense aviation, and industrial nickel-cadmium/lead-acid TPPL systems.
Strategic Pivot: Amara Raja is aggressively internationalizing—establishing a US corporate entity and leveraging its Sharjah (UAE) hub to penetrate MENA and Americas aftermarket channels, while HBL scales specialized defense and rail signaling power systems.
- Hankook & Company Co. Ltd. & Sebang Global Battery (South Korea): Export-oriented South Korean powerhouses (producing the AtlasBX and Rocket brands) utilizing highly automated, zero-defect manufacturing facilities to supply global automotive OEMs (Hyundai-Kia, GM) and premium aftermarket distributors across over 150 countries.
Strategic Pivot: Expanding domestic and overseas AGM production capacity to capture the global surge in Start-Stop replacement demand and commercial trucking auxiliary power.
- Yiğit Akü, Mutlu Akü, & Esan Akü (Turkey): Strategic geographic positioning at the crossroads of Europe, the Middle East, and North Africa, supported by integrated domestic lead smelting and robust export logistics reaching over 100 countries. Upgrading production lines toward heavy-duty commercial vehicle EFB and passenger AGM formats to serve as the primary nearshore aftermarket supplier for European and MENA distribution networks.
● Specialized Contenders: PINACO (Vietnam), TES / 3K and Thai Bellco (Thailand), Century Battery, Yokohama Batteries, and ABM Fujiya (Malaysia), alongside specialized players like C&D Technologies (US industrial/telecom), Crown Battery (US motive/renewable), Fengfan/CSSC (Chinese military/automotive), Chongqing Wanli, Dynavolt Tech (motorcycle starters), Eastman Auto & Power (Indian solar/e-rickshaw), Goldstar Power, and Metindustrial (South Africa). These regional leaders defend localized geographic moats through agile aftermarket distribution, climate-adapted flooded/EFB formulations, and government tender insulation.
1.1 Executive Summary and Core Value Migration Trends 1
1.2 Research Methodology and Analytical Architecture 2
1.2.1 Primary and Secondary Data Sourcing Protocols 2
1.2.2 Macroeconomic and Industry-Specific Forecasting Assumptions 4
1.3 Nomenclature and Technical Abbreviations 6
Chapter 2 Global Lead Acid Battery Market Architecture and Macro Dynamics 7
2.1 Global Market Size, Capacity, and Production Trajectory (2021-2031) 7
2.2 Supply-Demand Equilibrium and Capacity Utilization Rates 9
2.3 Regulatory Frameworks, Circular Economy Mandates, and Extended Producer Responsibility (EPR) 11
2.4 Total Cost of Ownership (TCO) Benchmarking: Lead Acid vs. Lithium-Ion and Sodium-Ion Chemistries 13
Chapter 3 Value Chain Architecture, Raw Material Bottlenecks, and Logistics 15
3.1 End-to-End Value Chain Configuration and Margin Pool Distribution 15
3.2 Upstream Raw Material Dynamics: Primary vs. Secondary (Recycled) Lead Smelting 17
3.3 Critical Component Supply Chains: Sulfuric Acid, AGM Separators, and ABS Casings 19
3.4 Global Trade Flows, Tariff Structures, and Cross-Border Logistics (2021-2026) 21
Chapter 4 Technological Evolution, Manufacturing Processes, and Patent Landscape 25
4.1 Grid Manufacturing Advancements: Continuous Casting, Punched Grid, and Expanded Metal Technologies 25
4.2 Electrochemical Innovations: Bipolar Lead Acid and Advanced Carbon Additives 27
4.3 Global Patent Filing Trajectories and Intellectual Property White Space (2021-2026) 29
4.4 Manufacturing Cost Structure Breakdown and Energy Intensity Audits 31
Chapter 5 Global Lead Acid Battery Market Segmentation by Functional Architecture 33
5.1 Global Market Overview by Function: Production, Consumption, and Revenue (2021-2031) 33
5.2 Starting, Lighting, and Ignition (SLI) Batteries 35
5.3 Power Batteries (Motive and Deep-Cycle) 37
5.4 Stationary Batteries (Standby and Energy Storage Systems) 39
Chapter 6 Global Lead Acid Battery Market Segmentation by Electrolyte and Sealing Structure 41
6.1 Global Market Overview by Electrolyte and Sealing Structure (2021-2031) 41
6.2 Flooded Lead-Acid Batteries (VLA) 43
6.3 Valve-Regulated Lead-Acid Batteries (VRLA) 45
6.4 Lead-Carbon (Pb-C) Batteries: Partial State of Charge (PSoC) Applications and Utility Storage 48
Chapter 7 Downstream Application Demand Centers and Value Migration 50
7.1 Global Consumption and Market Size by Application (2021-2031) 50
7.2 Automotive (Internal Combustion Engine, xEV Auxiliary 12V Systems, Commercial Vehicles) 52
7.3 Light Electric Mobility (E-Bikes, E-Tricycles, Low-Speed EVs) 54
7.4 Datacenters & AI Cloud Infrastructure (Uninterruptible Power Supply, Hyperscale Backup) 56
7.5 Telecommunications (5G Base Stations, Off-Grid Tower Backup) 58
7.6 Industrial Motive Power & Heavy Logistics Equipment (Forklifts, Automated Guided Vehicles, Mining) 60
7.7 Other Applications (Marine, Defense, Railways, Renewable Grid Stabilization) 61
Chapter 8 Regional Production Hubs and Consumption Markets (2021-2031) 62
8.1 Global Geographic Hierarchy: Supply Hubs vs. Demand Centers 62
8.2 Asia-Pacific Market Dynamics 64
8.2.1 China 65
8.2.2 India 66
8.2.3 Japan 67
8.2.4 South Korea 68
8.2.5 Taiwan (China) 69
8.2.6 Thailand 70
8.2.7 Vietnam 71
8.2.8 Malaysia 71
8.3 North America Market Dynamics 72
8.3.1 United States 73
8.3.2 Mexico 74
8.3.3 Canada 74
8.4 Europe Market Dynamics 75
8.4.1 Germany 76
8.4.2 Italy 77
8.4.3 Turkey 78
8.4.4 Austria 79
8.4.5 United Kingdom & Rest of Europe 79
8.5 Latin America & Middle East & Africa Market Dynamics 80
8.5.1 Brazil 80
8.5.2 South Africa 81
8.5.3 Saudi Arabia & UAE 82
Chapter 9 Global Competitive Landscape and Market Concentration 83
9.1 Global Tier-1, Tier-2, and Regional Player Matrix (2021-2026) 83
9.2 Global Capacity and Production Share by Manufacturer 85
9.3 Global Revenue and Market Share Concentration (CR5, CR10 Analysis) 86
9.4 Strategic M&A, Vertical Integration in Lead Recycling, and Capacity Expansion Tracker 87
Chapter 10 Corporate Intelligence: Global Multi-Application & North American Leaders 88
10.1 Clarios 88
10.1.1 Corporate Profile and Global Manufacturing Footprint 88
10.1.2 SWOT Analysis 89
10.1.3 Lead Acid Battery Operational Metrics: Capacity, Production, Price, Cost, and Gross Margin 90
10.1.4 Low-Voltage xEV Architecture Strategy 91
10.2 EnerSys 92
10.2.1 Corporate Profile and Thin Plate Pure Lead (TPPL) Technology 92
10.2.2 SWOT Analysis 93
10.2.3 Lead Acid Battery Operational Metrics: Capacity, Production, Price, Cost, and Gross Margin 94
10.2.4 Datacenter and Defense Sector Go-To-Market Strategy 95
10.3 East Penn Manufacturing Company 96
10.3.1 Corporate Profile and Single-Site Integrated Manufacturing Complex 96
10.3.2 SWOT Analysis 97
10.3.3 Lead Acid Battery Operational Metrics: Capacity, Production, Price, Cost, and Gross Margin 98
10.3.4 Closed-Loop Smelting and Aftermarket Distribution Network 99
10.4 Stryten Energy 100
10.4.1 Corporate Profile and Portfolio Restructuring 100
10.4.2 SWOT Analysis 101
10.4.3 Lead Acid Battery Operational Metrics: Capacity, Production, Price, Cost, and Gross Margin 102
10.4.4 Motive Power and Essential Power Division Performance 103
10.5 C&D Technologies Inc. (including Trojan Battery) 104
10.5.1 Corporate Profile and Deep-Cycle/Stationary Synergy 104
10.5.2 SWOT Analysis 105
10.5.3 Lead Acid Battery Operational Metrics: Capacity, Production, Price, Cost, and Gross Margin 106
10.5.4 Hyperscale Datacenter UPS Positioning 107
10.6 Crown Battery 108
10.6.1 Corporate Profile and Automated Assembly Operations 108
10.6.2 SWOT Analysis 109
10.6.3 Lead Acid Battery Operational Metrics: Capacity, Production, Price, Cost, and Gross Margin 110
10.6.4 Heavy-Duty Motive and Renewable Off-Grid Focus 111
Chapter 11 Corporate Intelligence: European & Turkish Manufacturing Leaders 112
11.1 HOPPECKE Batterien GmbH & Co. KG 112
11.1.1 Corporate Profile and Industrial Energy Storage Systems 112
11.1.2 SWOT Analysis 113
11.1.3 Lead Acid Battery Operational Metrics: Capacity, Production, Price, Cost, and Gross Margin 114
11.1.4 Railway and Intralogistics Fleet Management Solutions 115
11.2 BAE Batterien GmbH 116
11.2.1 Corporate Profile and Stationary Tubular Plate Expertise 116
11.2.2 SWOT Analysis 117
11.2.3 Lead Acid Battery Operational Metrics: Capacity, Production, Price, Cost, and Gross Margin 118
11.2.4 Utility and Power Generation Backup Market Penetration 119
11.3 Banner Group 120
11.3.1 Corporate Profile and European Automotive OEM Partnerships 120
11.3.2 SWOT Analysis 121
11.3.3 Lead Acid Battery Operational Metrics: Capacity, Production, Price, Cost, and Gross Margin 122
11.3.4 AGM and EFB Start-Stop Capacity Allocations 123
11.4 Seri Industrial S.p.A. (FIB S.p.A. / FAAM) 124
11.4.1 Corporate Profile and Vertically Integrated Italian Operations 124
11.4.2 SWOT Analysis 125
11.4.3 Lead Acid Battery Operational Metrics: Capacity, Production, Price, Cost, and Gross Margin 126
11.4.4 Traction and Standby Market Operations 127
11.5 FIAMM Energy Technology S.p.A. 128
11.5.1 Corporate Profile and Hitachi Chemical / Resonac Heritage 128
11.5.2 SWOT Analysis 129
11.5.3 Lead Acid Battery Operational Metrics: Capacity, Production, Price, Cost, and Gross Margin 130
11.5.4 European Mobility and Reserve Power Performance 131
11.6 Midac 132
11.6.1 Corporate Profile and Multi-Sector Battery Manufacturing 132
11.6.2 SWOT Analysis 133
11.6.3 Lead Acid Battery Operational Metrics: Capacity, Production, Price, Cost, and Gross Margin 134
11.6.4 European Forklift and Industrial Motive Market Share 135
11.7 Yiğit Akü Malzemeleri A.Ş. 136
11.7.1 Corporate Profile and Turkish Export Operations 136
11.7.2 SWOT Analysis 137
11.7.3 Lead Acid Battery Operational Metrics: Capacity, Production, Price, Cost, and Gross Margin 138
11.7.4 Middle East, Africa, and European Distribution Channels 139
11.8 Mutlu Akü 140
11.8.1 Corporate Profile and Metair Investments Heritage / Ownership Transition 140
11.8.2 SWOT Analysis 141
11.8.3 Lead Acid Battery Operational Metrics: Capacity, Production, Price, Cost, and Gross Margin 142
11.8.4 Domestic OEM Dominance and Secondary Lead Smelting 143
11.9 Esan Akü 144
11.9.1 Corporate Profile and Commercial Vehicle Battery Focus 144
11.9.2 SWOT Analysis 145
11.9.3 Lead Acid Battery Operational Metrics: Capacity, Production, Price, Cost, and Gross Margin 146
11.9.4 Export Market Diversification Strategy 147
Chapter 12 Corporate Intelligence: Chinese Ecosystem Powerhouses 148
12.1 Tianneng Battery Group 148
12.1.1 Corporate Profile and Light Electric Mobility Market Dominance 148
12.1.2 SWOT Analysis 149
12.1.3 Lead Acid Battery Operational Metrics: Capacity, Production, Price, Cost, and Gross Margin 150
12.1.4 Lead-Carbon Chemistry R&D and Southeast Asian Expansion 151
12.2 Chaowei Power Holdings Limited 152
12.2.1 Corporate Profile and Two-Wheeler Motive Power Scale 152
12.2.2 SWOT Analysis 153
12.2.3 Lead Acid Battery Operational Metrics: Capacity, Production, Price, Cost, and Gross Margin 154
12.2.4 Graphene-Alloyed Lead Acid Technology Commercialization 155
12.3 Camel Group 156
12.3.1 Corporate Profile and Automotive SLI Leadership in Asia 156
12.3.2 SWOT Analysis 157
12.3.3 Lead Acid Battery Operational Metrics: Capacity, Production, Price, Cost, and Gross Margin 158
12.3.4 Global Recycling Network and Overseas Manufacturing Plants 159
12.4 Leoch International Technology Limited 160
12.4.1 Corporate Profile and Globalized Manufacturing Footprint 160
12.4.2 SWOT Analysis 161
12.4.3 Lead Acid Battery Operational Metrics: Capacity, Production, Price, Cost, and Gross Margin 162
12.4.4 Datacenter UPS and Telecom Reserve Power Global Exports 163
12.5 Narada Power 164
12.5.1 Corporate Profile and Stationary Energy Storage Transition 164
12.5.2 SWOT Analysis 165
12.5.3 Lead Acid Battery Operational Metrics: Capacity, Production, Price, Cost, and Gross Margin 166
12.5.4 Industrial Backup and Lead-Carbon Grid Storage Projects 167
12.6 Shenzhen Center Power Tech Co. Ltd. (Vision Group) 168
12.6.1 Corporate Profile and VRLA Product Architecture 168
12.6.2 SWOT Analysis 169
12.6.3 Lead Acid Battery Operational Metrics: Capacity, Production, Price, Cost, and Gross Margin 170
12.6.4 High-Rate Discharge UPS Battery Positioning for AI Datacenters 171
12.7 Chongqing Wanli New Energy Co. Ltd. 172
12.7.1 Corporate Profile and Southwestern China Automotive Hub 172
12.7.2 SWOT Analysis 173
12.7.3 Lead Acid Battery Operational Metrics: Capacity, Production, Price, Cost, and Gross Margin 174
12.7.4 Regional OEM Supply Agreements and Capacity Utilization 175
12.8 Shenzhen Kstar Science & Technology Co. Ltd 176
12.8.1 Corporate Profile and Integrated UPS-Battery Ecosystem 176
12.8.2 SWOT Analysis 177
12.8.3 Lead Acid Battery Operational Metrics: Capacity, Production, Price, Cost, and Gross Margin 178
12.8.4 Critical Infrastructure and Datacenter Turnkey Solutions 179
12.9 Shandong Sacred Sun Power Sources Co. Ltd. 180
12.9.1 Corporate Profile and Reserve Power Specialization 180
12.9.2 SWOT Analysis 181
12.9.3 Lead Acid Battery Operational Metrics: Capacity, Production, Price, Cost, and Gross Margin 182
12.9.4 Telecom and Renewable Energy Storage Deployments 183
12.10 Shuangdeng Group (Sacred Sun / Shoto) 184
12.10.1 Corporate Profile and Communications Base Station Leadership 184
12.10.2 SWOT Analysis 185
12.10.3 Lead Acid Battery Operational Metrics: Capacity, Production, Price, Cost, and Gross Margin 186
12.10.4 Global Telecom Operator Procurement Contracts 187
12.11 Ritar International Group 188
12.11.1 Corporate Profile and Export-Oriented VRLA Manufacturing 188
12.11.2 SWOT Analysis 189
12.11.3 Lead Acid Battery Operational Metrics: Capacity, Production, Price, Cost, and Gross Margin 190
12.11.4 Vietnam Manufacturing Base and Tariff Mitigation Strategy 191
12.12 Fengfan Co. Ltd./China CSSC Holdings Limited 192
12.12.1 Corporate Profile and Defense/Automotive Dual-Use Heritage 192
12.12.2 SWOT Analysis 193
12.12.3 Lead Acid Battery Operational Metrics: Capacity, Production, Price, Cost, and Gross Margin 194
12.12.4 Naval, Heavy Duty, and Passenger Vehicle OEM Supply 195
12.13 Dynavolt Tech Co. Ltd 196
12.13.1 Corporate Profile and Powersports/Motorcycle Battery Specialization 196
12.13.2 SWOT Analysis 197
12.13.3 Lead Acid Battery Operational Metrics: Capacity, Production, Price, Cost, and Gross Margin 198
12.13.4 Global Two-Wheeler Aftermarket Brand Positioning 199
Chapter 13 Corporate Intelligence: Japanese, Korean & Taiwan (China) Champions 200
13.1 GS Yuasa Corporation 200
13.1.1 Corporate Profile and Global Joint Venture Network 200
13.1.2 SWOT Analysis 201
13.1.3 Lead Acid Battery Operational Metrics: Capacity, Production, Price, Cost, and Gross Margin 202
13.1.4 Japanese OEM Integration and Industrial Standby Operations 203
13.2 Furukawa Battery 204
13.2.1 Corporate Profile and UltraBattery Lead-Carbon Technology 204
13.2.2 SWOT Analysis 205
13.2.3 Lead Acid Battery Operational Metrics: Capacity, Production, Price, Cost, and Gross Margin 206
13.2.4 Railway, Aviation, and ASEAN Automotive Market Operations 207
13.3 Hankook & Company Co. Ltd. (formerly Hankook AtlasBX) 208
13.3.1 Corporate Profile and Maintenance-Free SLI Innovation 208
13.3.2 SWOT Analysis 209
13.3.3 Lead Acid Battery Operational Metrics: Capacity, Production, Price, Cost, and Gross Margin 210
13.3.4 US Manufacturing Plant (Tennessee) and Global Export Strategy 211
13.4 Sebang Global Battery 212
13.4.1 Corporate Profile and "Rocket" Brand Global Footprint 212
13.4.2 SWOT Analysis 213
13.4.3 Lead Acid Battery Operational Metrics: Capacity, Production, Price, Cost, and Gross Margin 214
13.4.4 Korean Automotive OEM and Global Aftermarket Penetration 215
13.5 Kung Long Batteries Industrial Co. Ltd. 216
13.5.1 Corporate Profile and Taiwan (China)-Vietnam Dual Manufacturing Base 216
13.5.2 SWOT Analysis 217
13.5.3 Lead Acid Battery Operational Metrics: Capacity, Production, Price, Cost, and Gross Margin 218
13.5.4 Global UPS OEM Supply Chain Integration (APC, Eaton) 219
13.6 CSB Energy Technology Co. Ltd. 220
13.6.1 Corporate Profile and High-Rate VRLA Specialization 220
13.6.2 SWOT Analysis 221
13.6.3 Lead Acid Battery Operational Metrics: Capacity, Production, Price, Cost, and Gross Margin 222
13.6.4 Datacenter and Critical Power Backup Market Share 223
Chapter 14 Corporate Intelligence: South Asian, Southeast Asian & African Key Players 224
14.1 Exide Industries Ltd 224
14.1.1 Corporate Profile and Indian Subcontinent Market Leadership 224
14.1.2 SWOT Analysis 225
14.1.3 Lead Acid Battery Operational Metrics: Capacity, Production, Price, Cost, and Gross Margin 226
14.1.4 Automotive, Inverter, and Industrial Infrastructure Dominance 227
14.2 Amara Raja Energy & Mobility Limited 228
14.2.1 Corporate Profile and "Amaron" Brand Positioning 228
14.2.2 SWOT Analysis 229
14.2.3 Lead Acid Battery Operational Metrics: Capacity, Production, Price, Cost, and Gross Margin 230
14.2.4 Indian Telecom Tower Backup and Automotive Aftermarket Expansion 231
14.3 Goldstar Power Limited 232
14.3.1 Corporate Profile and Tubular Inverter Battery Manufacturing 232
14.3.2 SWOT Analysis 233
14.3.3 Lead Acid Battery Operational Metrics: Capacity, Production, Price, Cost, and Gross Margin 234
14.3.4 Export Operations to Middle East and African Markets 235
14.4 High Energy Batteries (India) Ltd 236
14.4.1 Corporate Profile and Defense/Aerospace Specialized Batteries 236
14.4.2 SWOT Analysis 237
14.4.3 Lead Acid Battery Operational Metrics: Capacity, Production, Price, Cost, and Gross Margin 238
14.4.4 Niche Heavy-Duty and Military Procurement Contracts 239
14.5 Eastman Auto & Power Ltd 240
14.5.1 Corporate Profile and E-Rickshaw / Solar Tubular Battery Focus 240
14.5.2 SWOT Analysis 241
14.5.3 Lead Acid Battery Operational Metrics: Capacity, Production, Price, Cost, and Gross Margin 242
14.5.4 Last-Mile Electric Mobility Penetration in South Asia 243
14.6 HBL Engineering Limited (formerly HBL Power Systems) 244
14.6.1 Corporate Profile and Industrial/Railway Battery Engineering 244
14.6.2 SWOT Analysis 245
14.6.3 Lead Acid Battery Operational Metrics: Capacity, Production, Price, Cost, and Gross Margin 246
14.6.4 Pure Lead Tin (PLT) Technology for Defense and Telecom 247
14.7 Dry Cell and Storage Battery JSC (PINACO) 248
14.7.1 Corporate Profile and Vietnamese State-Backed Market Leadership 248
14.7.2 SWOT Analysis 249
14.7.3 Lead Acid Battery Operational Metrics: Capacity, Production, Price, Cost, and Gross Margin 250
14.7.4 Motorcycle and Automotive OEM Partnerships in Vietnam 251
14.8 Yuasa Battery (Thailand) PCL 252
14.8.1 Corporate Profile and Thai Automotive Ecosystem Integration 252
14.8.2 SWOT Analysis 253
14.8.3 Lead Acid Battery Operational Metrics: Capacity, Production, Price, Cost, and Gross Margin 254
14.8.4 ASEAN Regional Aftermarket Distribution 255
14.9 Thai Energy Storage Technology Public Company Limited (TES / 3K Battery) 256
14.9.1 Corporate Profile and Resonac/GS Yuasa Consolidation 256
14.9.2 SWOT Analysis 257
14.9.3 Lead Acid Battery Operational Metrics: Capacity, Production, Price, Cost, and Gross Margin 258
14.9.4 Commercial Vehicle and Passenger Car SLI Operations 259
14.10 Thai Bellco Battery Co. Ltd. 260
14.10.1 Corporate Profile and Thailand Manufacturing Operations 260
14.10.2 SWOT Analysis 261
14.10.3 Lead Acid Battery Operational Metrics: Capacity, Production, Price, Cost, and Gross Margin 262
14.10.4 Regional Export and Private Label Production 263
14.11 ABM Fujiya Berhad 264
14.11.1 Corporate Profile and Malaysian Automotive Battery Manufacturing 264
14.11.2 SWOT Analysis 265
14.11.3 Lead Acid Battery Operational Metrics: Capacity, Production, Price, Cost, and Gross Margin 266
14.11.4 Asia-Pacific Aftermarket Supply Chain 267
14.12 Century Battery Malaysia 268
14.12.1 Corporate Profile and Malaysian SLI Market Leadership 268
14.12.2 SWOT Analysis 269
14.12.3 Lead Acid Battery Operational Metrics: Capacity, Production, Price, Cost, and Gross Margin 270
14.12.4 Retail Distribution and Rapid Replacement Services 271
14.13 Yokohama Batteries (Yokohama Industries Berhad) 272
14.13.1 Corporate Profile and Malaysian Integrated Smelting & Manufacturing 272
14.13.2 SWOT Analysis 273
14.13.3 Lead Acid Battery Operational Metrics: Capacity, Production, Price, Cost, and Gross Margin 274
14.13.4 Secondary Lead Cost Advantage and Regional Exports 275
14.14 Metindustrial (Pty) Ltd (First National Battery) 276
14.14.1 Corporate Profile and South African Automotive & Mining Focus 276
14.14.2 SWOT Analysis 277
14.14.3 Lead Acid Battery Operational Metrics: Capacity, Production, Price, Cost, and Gross Margin 278
14.14.4 Underground Mining Cap Lamp and Locomotive Traction Dominance 279
Chapter 15 Strategic Market Outlook and Value Migration Scenarios (2026-2031) 280
Table 2 Global Regulatory Matrix: Lead Emission Limits and Recycling Mandates by Region 11
Table 3 Total Cost of Ownership (TCO) Comparison: Flooded, AGM, Lead-Carbon vs. LFP and Sodium-Ion (2026) 13
Table 4 Primary vs. Secondary Lead Cost Structure and Smelting Margin Analysis (2021-2026) 17
Table 5 Global Lead Acid Battery Import and Export Volumes by Major Trading Nations (2021-2026) 21
Table 6 Tariff Rates and Trade Barriers for Lead Acid Batteries Across Key Corridors (2026) 23
Table 7 Grid Manufacturing Technology Comparison: Capital Expenditure, Lead Consumption, and Cycle Life 25
Table 8 Key Global Patents in Bipolar Lead Acid and Carbon Additive Formulations (2021-2026) 29
Table 9 Global Lead Acid Battery Manufacturing Cost Breakdown (Raw Materials, Energy, Labor, Depreciation) 31
Table 10 Global Lead Acid Battery Production and Market Size by Function (2021-2031) 33
Table 11 Global SLI Battery Demand: OEM vs. Aftermarket Split (2021-2031) 36
Table 12 Global Power Battery Consumption by Motive Sub-Segments (2021-2031) 37
Table 13 Global Stationary Battery Market Size by Backup Duration Requirements (2021-2031) 39
Table 14 Global Lead Acid Battery Production and Revenue by Electrolyte and Sealing Structure (2021-2031) 41
Table 15 Global Flooded Lead-Acid Battery Capacity and Production Forecast (2021-2031) 43
Table 16 Global VRLA Battery Market Split: AGM vs. Gel Batteries (2021-2031) 45
Table 17 Global Lead-Carbon (Pb-C) Battery Installations and Revenue Trajectory (2021-2031) 48
Table 18 Global Lead Acid Battery Consumption and Market Size by Application (2021-2031) 50
Table 19 Automotive Application Demand: ICE Start-Stop vs. BEV/PHEV 12V Auxiliary Batteries (2021-2031) 52
Table 20 Light Electric Mobility Lead Acid Battery Consumption by Vehicle Type (2021-2031) 54
Table 21 Datacenters & AI Cloud Infrastructure UPS Lead Acid Battery Demand (2021-2031) 56
Table 22 Telecommunications Base Station Backup Battery Consumption (2021-2031) 58
Table 23 Industrial Motive Power & Heavy Logistics Battery Market Size (2021-2031) 60
Table 24 Global Lead Acid Battery Production, Consumption, and Revenue by Macro-Region (2021-2031) 62
Table 25 Asia-Pacific Lead Acid Battery Market Size and Production by Country (2021-2031) 64
Table 26 North America Lead Acid Battery Market Size and Production by Country (2021-2031) 72
Table 27 Europe Lead Acid Battery Market Size and Production by Country (2021-2031) 75
Table 28 Latin America and Middle East & Africa Lead Acid Battery Market Size by Country (2021-2031) 80
Table 29 Global Lead Acid Battery Capacity and Production by Key Manufacturers (2021-2026) 85
Table 30 Global Lead Acid Battery Revenue and Market Share by Key Manufacturers (2021-2026) 86
Table 31 Clarios Lead Acid Battery Capacity, Production, Price, Cost and Gross Profit Margin (2021-2026) 90
Table 32 EnerSys Lead Acid Battery Capacity, Production, Price, Cost and Gross Profit Margin (2021-2026) 94
Table 33 East Penn Manufacturing Company Lead Acid Battery Capacity, Production, Price, Cost and Gross Profit Margin (2021-2026) 98
Table 34 Stryten Energy Lead Acid Battery Capacity, Production, Price, Cost and Gross Profit Margin (2021-2026) 102
Table 35 C&D Technologies Inc. Lead Acid Battery Capacity, Production, Price, Cost and Gross Profit Margin (2021-2026) 106
Table 36 Crown Battery Lead Acid Battery Capacity, Production, Price, Cost and Gross Profit Margin (2021-2026) 110
Table 37 HOPPECKE Batterien GmbH & Co. KG Lead Acid Battery Capacity, Production, Price, Cost and Gross Profit Margin (2021-2026) 114
Table 38 BAE Batterien GmbH Lead Acid Battery Capacity, Production, Price, Cost and Gross Profit Margin (2021-2026) 118
Table 39 Banner Group Lead Acid Battery Capacity, Production, Price, Cost and Gross Profit Margin (2021-2026) 122
Table 40 Seri Industrial S.p.A. Lead Acid Battery Capacity, Production, Price, Cost and Gross Profit Margin (2021-2026) 126
Table 41 FIAMM Energy Technology S.p.A. Lead Acid Battery Capacity, Production, Price, Cost and Gross Profit Margin (2021-2026) 130
Table 42 Midac Lead Acid Battery Capacity, Production, Price, Cost and Gross Profit Margin (2021-2026) 134
Table 43 Yiğit Akü Malzemeleri A.Ş. Lead Acid Battery Capacity, Production, Price, Cost and Gross Profit Margin (2021-2026) 138
Table 44 Mutlu Akü Lead Acid Battery Capacity, Production, Price, Cost and Gross Profit Margin (2021-2026) 142
Table 45 Esan Akü Lead Acid Battery Capacity, Production, Price, Cost and Gross Profit Margin (2021-2026) 146
Table 46 Tianneng Battery Group Lead Acid Battery Capacity, Production, Price, Cost and Gross Profit Margin (2021-2026) 150
Table 47 Chaowei Power Holdings Limited Lead Acid Battery Capacity, Production, Price, Cost and Gross Profit Margin (2021-2026) 154
Table 48 Camel Group Lead Acid Battery Capacity, Production, Price, Cost and Gross Profit Margin (2021-2026) 158
Table 49 Leoch International Technology Limited Lead Acid Battery Capacity, Production, Price, Cost and Gross Profit Margin (2021-2026) 162
Table 50 Narada Power Lead Acid Battery Capacity, Production, Price, Cost and Gross Profit Margin (2021-2026) 166
Table 51 Shenzhen Center Power Tech Co. Ltd. (Vision Group) Lead Acid Battery Capacity, Production, Price, Cost and Gross Profit Margin (2021-2026) 170
Table 52 Chongqing Wanli New Energy Co. Ltd. Lead Acid Battery Capacity, Production, Price, Cost and Gross Profit Margin (2021-2026) 174
Table 53 Shenzhen Kstar Science & Technology Co. Ltd Lead Acid Battery Capacity, Production, Price, Cost and Gross Profit Margin (2021-2026) 178
Table 54 Shandong Sacred Sun Power Sources Co. Ltd. Lead Acid Battery Capacity, Production, Price, Cost and Gross Profit Margin (2021-2026) 182
Table 55 Shuangdeng Group Lead Acid Battery Capacity, Production, Price, Cost and Gross Profit Margin (2021-2026) 186
Table 56 Ritar International Group Lead Acid Battery Capacity, Production, Price, Cost and Gross Profit Margin (2021-2026) 190
Table 57 Fengfan Co. Ltd./China CSSC Holdings Limited Lead Acid Battery Capacity, Production, Price, Cost and Gross Profit Margin (2021-2026) 194
Table 58 Dynavolt Tech Co. Ltd Lead Acid Battery Capacity, Production, Price, Cost and Gross Profit Margin (2021-2026) 198
Table 59 GS Yuasa Corporation Lead Acid Battery Capacity, Production, Price, Cost and Gross Profit Margin (2021-2026) 202
Table 60 Furukawa Battery Lead Acid Battery Capacity, Production, Price, Cost and Gross Profit Margin (2021-2026) 206
Table 61 Hankook & Company Co. Ltd. Lead Acid Battery Capacity, Production, Price, Cost and Gross Profit Margin (2021-2026) 210
Table 62 Sebang Global Battery Lead Acid Battery Capacity, Production, Price, Cost and Gross Profit Margin (2021-2026) 214
Table 63 Kung Long Batteries Industrial Co. Ltd. Lead Acid Battery Capacity, Production, Price, Cost and Gross Profit Margin (2021-2026) 218
Table 64 CSB Energy Technology Co. Ltd. Lead Acid Battery Capacity, Production, Price, Cost and Gross Profit Margin (2021-2026) 222
Table 65 Exide Industries Ltd Lead Acid Battery Capacity, Production, Price, Cost and Gross Profit Margin (2021-2026) 226
Table 66 Amara Raja Energy & Mobility Limited Lead Acid Battery Capacity, Production, Price, Cost and Gross Profit Margin (2021-2026) 230
Table 67 Goldstar Power Limited Lead Acid Battery Capacity, Production, Price, Cost and Gross Profit Margin (2021-2026) 234
Table 68 High Energy Batteries (India) Ltd Lead Acid Battery Capacity, Production, Price, Cost and Gross Profit Margin (2021-2026) 238
Table 69 Eastman Auto & Power Ltd Lead Acid Battery Capacity, Production, Price, Cost and Gross Profit Margin (2021-2026) 242
Table 70 HBL Engineering Limited Lead Acid Battery Capacity, Production, Price, Cost and Gross Profit Margin (2021-2026) 246
Table 71 Dry Cell and Storage Battery JSC (PINACO) Lead Acid Battery Capacity, Production, Price, Cost and Gross Profit Margin (2021-2026) 250
Table 72 Yuasa Battery (Thailand) PCL Lead Acid Battery Capacity, Production, Price, Cost and Gross Profit Margin (2021-2026) 254
Table 73 Thai Energy Storage Technology Public Company Limited (TES) Lead Acid Battery Capacity, Production, Price, Cost and Gross Profit Margin (2021-2026) 258
Table 74 Thai Bellco Battery Co. Ltd. Lead Acid Battery Capacity, Production, Price, Cost and Gross Profit Margin (2021-2026) 262
Table 75 ABM Fujiya Berhad Lead Acid Battery Capacity, Production, Price, Cost and Gross Profit Margin (2021-2026) 266
Table 76 Century Battery Malaysia Lead Acid Battery Capacity, Production, Price, Cost and Gross Profit Margin (2021-2026) 270
Table 77 Yokohama Batteries Lead Acid Battery Capacity, Production, Price, Cost and Gross Profit Margin (2021-2026) 274
Table 78 Metindustrial (Pty) Ltd Lead Acid Battery Capacity, Production, Price, Cost and Gross Profit Margin (2021-2026) 278
Figure 1 Lead Acid Battery Value Migration and Chemistry Substitution Curve (2021-2031) 1
Figure 2 Global Lead Acid Battery Capacity, Production, and Utilization Rate Trajectory (2021-2031) 8
Figure 3 Global Supply-Demand Gap Analysis by Macro-Region (2026 vs. 2031) 10
Figure 4 Closed-Loop Value Chain Architecture and Margin Pool Allocation in Lead Acid Batteries 15
Figure 5 LME Lead Price Volatility vs. Secondary Lead Smelting Spread (2021-2026) 18
Figure 6 Global Trade Flow Map: Major Exporting Hubs and Net Importing Markets (2026) 22
Figure 7 Patent Filing Velocity in Lead-Carbon and Bipolar Lead Acid Technologies (2021-2026) 30
Figure 8 Global Lead Acid Battery Market Share by Function (2021, 2026, 2031) 34
Figure 9 Global Lead Acid Battery Market Share by Electrolyte and Sealing Structure (2021, 2026, 2031) 42
Figure 10 AGM vs. Flooded Battery Price-to-Performance Positioning Matrix 46
Figure 11 Global Lead Acid Battery Consumption Share by Application (2021, 2026, 2031) 51
Figure 12 xEV 12V Auxiliary Battery Chemistry Penetration: AGM vs. Flooded vs. Lithium-Ion (2021-2031) 53
Figure 13 Hyperscale Datacenter UPS Backup Architecture: High-Rate VRLA/TPPL vs. Lithium-Ion TCO (2026) 57
Figure 14 Global Lead Acid Battery Production Share by Country (2026) 63
Figure 15 Global Competitive Positioning Matrix: Production Scale vs. Technological Specialization (2026) 84
Figure 16 Global Lead Acid Battery Market Concentration (CR5 and CR10) Evolution (2021-2026) 86
Figure 17 Clarios Lead Acid Battery Market Share (2021-2026) 90
Figure 18 EnerSys Lead Acid Battery Market Share (2021-2026) 94
Figure 19 East Penn Manufacturing Company Lead Acid Battery Market Share (2021-2026) 98
Figure 20 Stryten Energy Lead Acid Battery Market Share (2021-2026) 102
Figure 21 C&D Technologies Inc. Lead Acid Battery Market Share (2021-2026) 106
Figure 22 Crown Battery Lead Acid Battery Market Share (2021-2026) 110
Figure 23 HOPPECKE Batterien GmbH & Co. KG Lead Acid Battery Market Share (2021-2026) 114
Figure 24 BAE Batterien GmbH Lead Acid Battery Market Share (2021-2026) 118
Figure 25 Banner Group Lead Acid Battery Market Share (2021-2026) 122
Figure 26 Seri Industrial S.p.A. Lead Acid Battery Market Share (2021-2026) 126
Figure 27 FIAMM Energy Technology S.p.A. Lead Acid Battery Market Share (2021-2026) 130
Figure 28 Midac Lead Acid Battery Market Share (2021-2026) 134
Figure 29 Yiğit Akü Malzemeleri A.Ş. Lead Acid Battery Market Share (2021-2026) 138
Figure 30 Mutlu Akü Lead Acid Battery Market Share (2021-2026) 142
Figure 31 Esan Akü Lead Acid Battery Market Share (2021-2026) 146
Figure 32 Tianneng Battery Group Lead Acid Battery Market Share (2021-2026) 150
Figure 33 Chaowei Power Holdings Limited Lead Acid Battery Market Share (2021-2026) 154
Figure 34 Camel Group Lead Acid Battery Market Share (2021-2026) 158
Figure 35 Leoch International Technology Limited Lead Acid Battery Market Share (2021-2026) 162
Figure 36 Narada Power Lead Acid Battery Market Share (2021-2026) 166
Figure 37 Shenzhen Center Power Tech Co. Ltd. (Vision Group) Lead Acid Battery Market Share (2021-2026) 170
Figure 38 Chongqing Wanli New Energy Co. Ltd. Lead Acid Battery Market Share (2021-2026) 174
Figure 39 Shenzhen Kstar Science & Technology Co. Ltd Lead Acid Battery Market Share (2021-2026) 178
Figure 40 Shandong Sacred Sun Power Sources Co. Ltd. Lead Acid Battery Market Share (2021-2026) 182
Figure 41 Shuangdeng Group Lead Acid Battery Market Share (2021-2026) 186
Figure 42 Ritar International Group Lead Acid Battery Market Share (2021-2026) 190
Figure 43 Fengfan Co. Ltd./China CSSC Holdings Limited Lead Acid Battery Market Share (2021-2026) 194
Figure 44 Dynavolt Tech Co. Ltd Lead Acid Battery Market Share (2021-2026) 198
Figure 45 GS Yuasa Corporation Lead Acid Battery Market Share (2021-2026) 202
Figure 46 Furukawa Battery Lead Acid Battery Market Share (2021-2026) 206
Figure 47 Hankook & Company Co. Ltd. Lead Acid Battery Market Share (2021-2026) 210
Figure 48 Sebang Global Battery Lead Acid Battery Market Share (2021-2026) 214
Figure 49 Kung Long Batteries Industrial Co. Ltd. Lead Acid Battery Market Share (2021-2026) 218
Figure 50 CSB Energy Technology Co. Ltd. Lead Acid Battery Market Share (2021-2026) 222
Figure 51 Exide Industries Ltd Lead Acid Battery Market Share (2021-2026) 226
Figure 52 Amara Raja Energy & Mobility Limited Lead Acid Battery Market Share (2021-2026) 230
Figure 53 Goldstar Power Limited Lead Acid Battery Market Share (2021-2026) 234
Figure 54 High Energy Batteries (India) Ltd Lead Acid Battery Market Share (2021-2026) 238
Figure 55 Eastman Auto & Power Ltd Lead Acid Battery Market Share (2021-2026) 242
Figure 56 HBL Engineering Limited Lead Acid Battery Market Share (2021-2026) 246
Figure 57 Dry Cell and Storage Battery JSC (PINACO) Lead Acid Battery Market Share (2021-2026) 250
Figure 58 Yuasa Battery (Thailand) PCL Lead Acid Battery Market Share (2021-2026) 254
Figure 59 Thai Energy Storage Technology Public Company Limited (TES) Lead Acid Battery Market Share (2021-2026) 258
Figure 60 Thai Bellco Battery Co. Ltd. Lead Acid Battery Market Share (2021-2026) 262
Figure 61 ABM Fujiya Berhad Lead Acid Battery Market Share (2021-2026) 266
Figure 62 Century Battery Malaysia Lead Acid Battery Market Share (2021-2026) 270
Figure 63 Yokohama Batteries Lead Acid Battery Market Share (2021-2026) 274
Figure 64 Metindustrial (Pty) Ltd Lead Acid Battery Market Share (2021-2026) 278
Research Methodology
- Market Estimated Methodology:
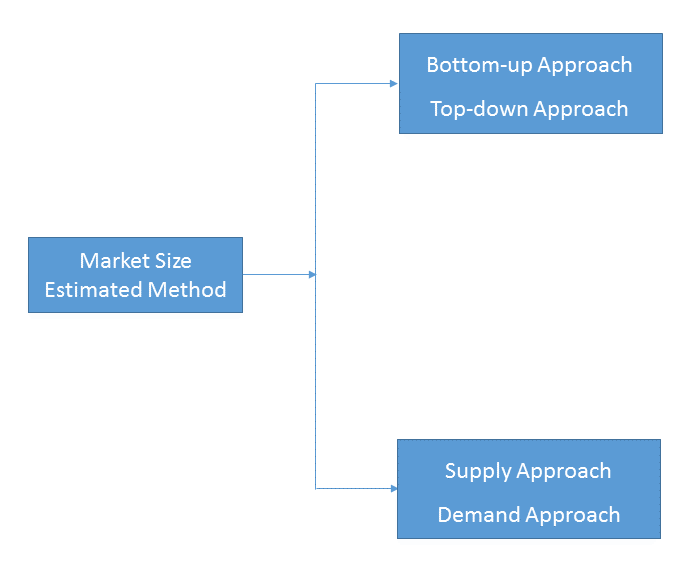
Bottom-up & top-down approach, supply & demand approach are the most important method which is used by HDIN Research to estimate the market size.
1)Top-down & Bottom-up Approach
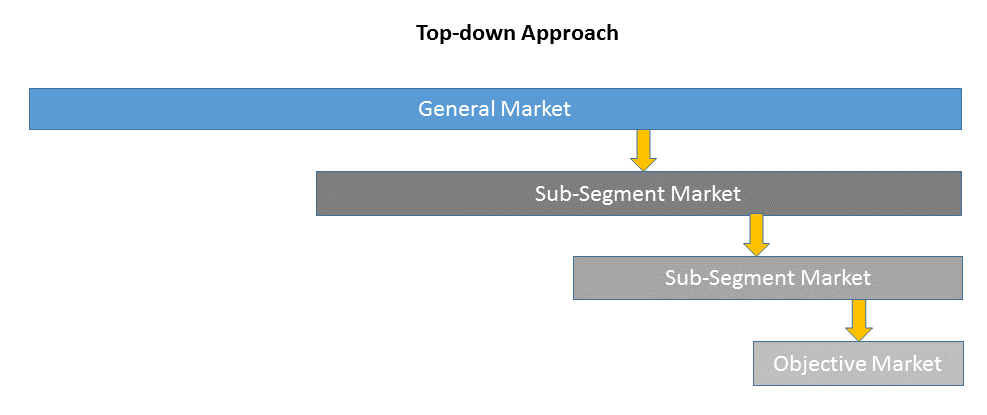
Top-down approach uses a general market size figure and determines the percentage that the objective market represents.
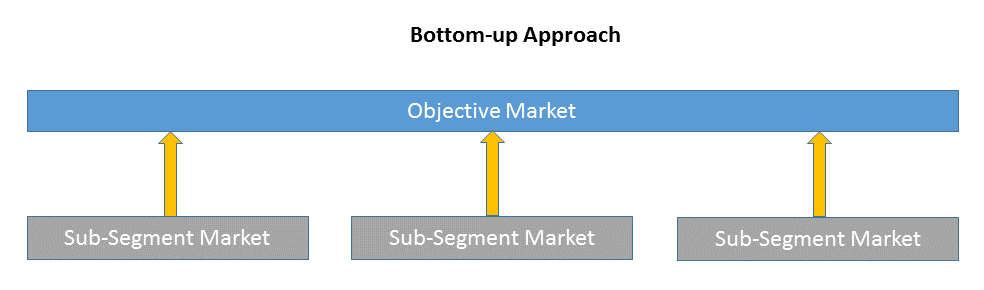
Bottom-up approach size the objective market by collecting the sub-segment information.
2)Supply & Demand Approach
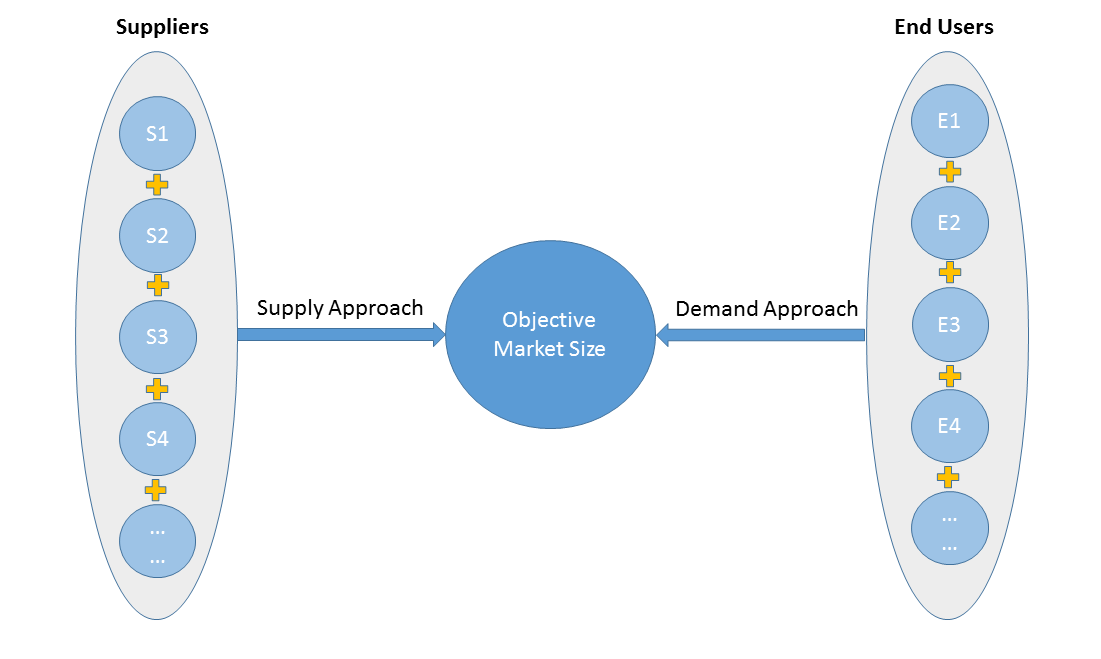
Supply approach is based on assessments of the size of each competitor supplying the objective market.
Demand approach combine end-user data within a market to estimate the objective market size. It is sometimes referred to as bottom-up approach.
- Forecasting Methodology
- Numerous factors impacting the market trend are considered for forecast model:
- New technology and application in the future;
- New project planned/under contraction;
- Global and regional underlying economic growth;
- Threatens of substitute products;
- Industry expert opinion;
- Policy and Society implication.
- Analysis Tools
1)PEST Analysis
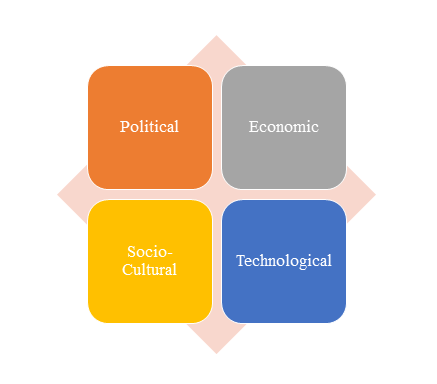
PEST Analysis is a simple and widely used tool that helps our client analyze the Political, Economic, Socio-Cultural, and Technological changes in their business environment.
- Benefits of a PEST analysis:
- It helps you to spot business opportunities, and it gives you advanced warning of significant threats.
- It reveals the direction of change within your business environment. This helps you shape what you’re doing, so that you work with change, rather than against it.
- It helps you avoid starting projects that are likely to fail, for reasons beyond your control.
- It can help you break free of unconscious assumptions when you enter a new country, region, or market; because it helps you develop an objective view of this new environment.
2)Porter’s Five Force Model Analysis
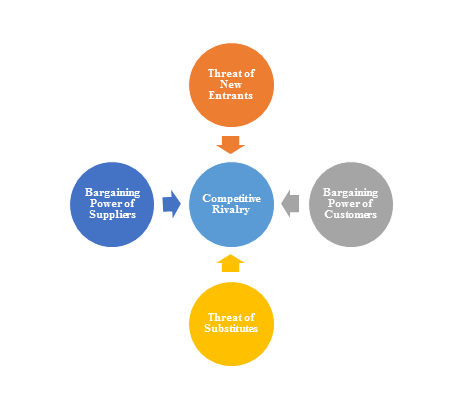
The Porter’s Five Force Model is a tool that can be used to analyze the opportunities and overall competitive advantage. The five forces that can assist in determining the competitive intensity and potential attractiveness within a specific area.
- Threat of New Entrants: Profitable industries that yield high returns will attract new firms.
- Threat of Substitutes: A substitute product uses a different technology to try to solve the same economic need.
- Bargaining Power of Customers: the ability of customers to put the firm under pressure, which also affects the customer's sensitivity to price changes.
- Bargaining Power of Suppliers: Suppliers of raw materials, components, labor, and services (such as expertise) to the firm can be a source of power over the firm when there are few substitutes.
- Competitive Rivalry: For most industries the intensity of competitive rivalry is the major determinant of the competitiveness of the industry.
3)Value Chain Analysis
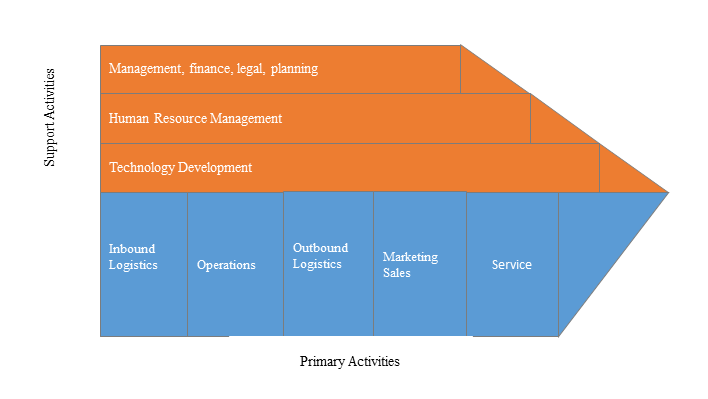
Value chain analysis is a tool to identify activities, within and around the firm and relating these activities to an assessment of competitive strength. Value chain can be analyzed by primary activities and supportive activities. Primary activities include: inbound logistics, operations, outbound logistics, marketing & sales, service. Support activities include: technology development, human resource management, management, finance, legal, planning.
4)SWOT Analysis
SWOT analysis is a tool used to evaluate a company's competitive position by identifying its strengths, weaknesses, opportunities and threats. The strengths and weakness is the inner factor; the opportunities and threats are the external factor. By analyzing the inner and external factors, the analysis can provide the detail information of the position of a player and the characteristics of the industry.
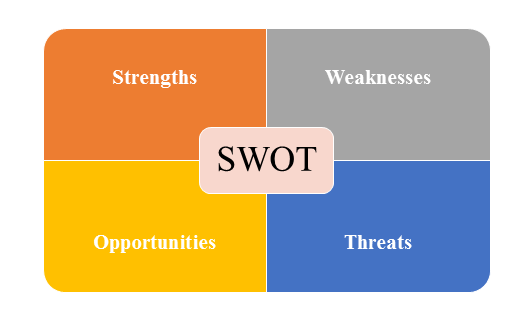
- Strengths describe what the player excels at and separates it from the competition
- Weaknesses stop the player from performing at its optimum level.
- Opportunities refer to favorable external factors that the player can use to give it a competitive advantage.
- Threats refer to factors that have the potential to harm the player.
- Data Sources
| Primary Sources | Secondary Sources |
|---|---|
| Face to face/Phone Interviews with market participants, such as: Manufactures; Distributors; End-users; Experts. Online Survey |
Government/International Organization Data: Annual Report/Presentation/Fact Book Internet Source Information Industry Association Data Free/Purchased Database Market Research Report Book/Journal/News |