Automotive SLI Battery Market 2021-2031 Strategic Report
- Single User License (1 Users) $ 3,500
- Team License (2~5 Users) $ 4,500
- Corporate License (>5 Users) $ 5,500
The global Automotive Starting, Lighting, and Ignition (SLI) battery market size is valued at USD 20 billion - USD 24 billion in 2026, with a Compound Annual Growth Rate (CAGR) of 2.8% to 4.8% through 2031. Contrary to market misconceptions that battery electric vehicle (BEV) adoption eliminates the 12V battery, vehicle electrification and the proliferation of Advanced Driver-Assistance Systems (ADAS) have intensified low-voltage auxiliary power demands. In internal combustion engine (ICE) and micro-hybrid platforms, stringent tailpipe emission mandates require Idle Start-Stop (ISS) functionality, demanding high Dynamic Charge Acceptance (DCA) and deep micro-cycling durability. In BEVs and plug-in hybrids (PHEVs), the 12V SLI battery transitions from an engine cranking device into a safety-critical auxiliary power hub, energizing high-voltage contactors, steer-by-wire systems, brake-by-wire actuators, and autonomous electronic control units (ECUs) in compliance with ISO 26262 functional safety standards. Market concentration is anchored by vertically integrated global and regional tier-1 leaders—including Clarios, Camel Group, GS Yuasa Corporation, East Penn Manufacturing, Exide Industries, Leoch International, SEBANG Global Battery, Amara Raja Energy & Mobility, EnerSys, and Stryten Energy. These incumbents leverage closed-loop secondary lead smelting and expansive Replacement Equipment Market (REM) distribution networks to insulate margins against raw material volatility. Manufacturing scale is heavily concentrated in the Asia-Pacific corridor (China, India, South Korea, Japan, Thailand, and Vietnam), which serves as both the primary growth engine for domestic vehicle parcs and the export manufacturing hub for Europe, the Middle East and Africa (MEA), and the Americas.
TECHNICAL ARCHITECTURE & PRODUCT TAXONOMY
Automotive SLI batteries are secondary electrochemical storage systems engineered to deliver high-rate pulse currents—measured in Cold Cranking Amperes (CCA), typically spanning 300A to over 1,000A—while stabilizing the onboard 12V (6 series-connected ~2.1V cells for passenger cars) or 24V (dual 12V blocks in series for heavy commercial vehicles) direct current (DC) bus.
Automotive SLI batteries can be divided into five categories.
● Flooded Lead-Acid Battery (Conventional / Low-Maintenance / CMF):
Utilizes liquid sulfuric acid electrolyte free-flowing around lead-antimony (Pb-Sb) or lead-calcium-tin (Pb-Ca-Sn) alloy grids. While low-maintenance Pb-Sb variants require periodic distilled water replenishment, modern Conventional Maintenance-Free (CMF) batteries employ Pb-Ca-Sn grids and double-lid labyrinth condensation chambers to suppress water loss. Despite severe cycle-life limitations under deep discharge, CMF batteries retain substantial volume in entry-level, non-start-stop ICE vehicles and commercial fleets across price-sensitive emerging markets in Latin America, MEA, and Southeast Asia.
● Enhanced Lead-Acid Battery (EFB - Enhanced Flooded Battery):
Engineered as a cost-optimized bridge for entry-level micro-hybrid and ISS passenger vehicles. EFB architectures modify conventional flooded designs by incorporating specialized carbon black, barium sulfate, and lignosulfonate expanders alongside silver/tin grid additives. The positive plates are reinforced with a high-density poly-mesh scrim and enveloped in low-resistance micro-porous Polyethylene (PE) separators. EFB units deliver 2x to 3x the cyclic longevity and vastly superior DCA compared to standard CMF units, avoiding the higher manufacturing capital expenditure of VRLA systems.
● Absorbed Glass Mat VRLA Battery (AGM / TPPL):
Represents the margin pinnacle of the lead-acid ecosystem. In AGM Valve-Regulated Lead-Acid (VRLA) assemblies, the sulfuric acid electrolyte is immobilized within ultra-fine porous borosilicate micro-glass fiber mats under high mechanical cell compression. Equipped with pressure-relief gas recombination valves and high-purity lead-calcium-tin or Thin Plate Pure Lead (TPPL) grids, AGM batteries offer 4x to 5x the cycle life of flooded baselines, zero electrolyte stratification, spill-proof orientation flexibility, and rapid charge recovery. AGM is mandatory for luxury ICE start-stop platforms, ADAS-heavy architectures, and 12V auxiliary safety backups in premium BEVs.
● Low-Voltage Lithium-Ion Battery (12V / 24V / 48V LFP & NMC):
Constructed primarily around prismatic or cylindrical Lithium Iron Phosphate (LiFePO4) cells—and selectively Nickel Manganese Cobalt (NMC)—integrated with an active solid-state Battery Management System (BMS). Low-voltage lithium solutions achieve a 60% to 70% weight reduction over lead-acid equivalents, 10+ year calendar life matching the vehicle lifecycle, and flat voltage discharge curves. Field intelligence indicates rapid OEM migration toward 12V LFP auxiliary batteries in New Energy Vehicles (NEVs) and 24V lithium packs for heavy-duty commercial truck starting and cabin parking air-conditioning systems.
● Sodium-Ion Battery (Na-Ion):
Transitioning from laboratory validation to early commercial industrialization during the 2025–2026 cycle. Utilizing abundant sodium-based cathodes (layered transition metal oxides or Prussian blue analogs) paired with hard carbon anodes and organic or solid-state electrolytes, Na-ion batteries eliminate lithium and cobalt feedstock bottlenecks. Their primary operational moat in the SLI sector is extreme thermal resilience—retaining over 85% discharge capacity at -40°C while demonstrating high intrinsic thermal runaway safety and rapid cranking power. Leading Asian conglomerates have already completed OEM sample validations for 12V 40Ah, 12V 60Ah, and 24V 60Ah start-stop sodium batteries, actively establishing IEC/TC21 international standards.
REGIONAL MARKET DYNAMICS
● Asia-Pacific:
Asia-Pacific anchors global SLI production and consumption. China represents the single largest market, supported by a domestic vehicle parc exceeding 366 million units. The Chinese market exhibits rapid value migration: domestic ICE and hybrid platforms are aggressively adopting EFB and AGM units, while domestic NEV manufacturers (such as BYD, Nio, Seres, and Li Auto) are standardizing 12V LFP auxiliary batteries. India is the fastest-growing major market; retail passenger vehicle sales reached 4.705 million units (+13% YoY) and commercial vehicles expanded by ~12% YoY in the 2025–2026 fiscal cycle. Supported by the INR 2,000 Crore (~USD 230 million) PM E-DRIVE infrastructure scheme and domestic giga-factory localization, Indian demand is shifting toward DIN-standard AGM/EFB units and commercial fleet batteries. Japan and South Korea remain mature, technologically advanced hubs; Japan is characterized by entrenched keiretsu OEM supply relationships and high hybrid penetration, while South Korea (led by SEBANG and DN Automotive) operates as an export powerhouse for maintenance-free AGM/EFB batteries. Southeast Asia serves as a vital manufacturing and export corridor. In Thailand, annual automotive and motorcycle battery production stood at 25.13 million units in 2025, with export volumes surging 17.80% YoY to 12.84 million units despite flat domestic assembly. Vietnam and Malaysia are similarly scaling CMF and EFB export capacities to circumvent trade barriers and supply ASEAN, Middle Eastern, and African distributors. Additionally, manufacturers in Taiwan, China continue to play a pivotal role in regional aftermarket distribution and specialized OEM supply chains.
● North America:
Comprising the United States, Canada, and Mexico, the North American market is driven by an expansive, aging vehicle parc with high average mileage and severe seasonal temperature variance (from Canadian winters to Sunbelt heat). Consumer preference for light trucks, SUVs, and ADAS-equipped vehicles sustains high average selling prices (ASPs) through rapid AGM adoption in the aftermarket. Furthermore, Class 8 heavy-duty commercial trucks across North American freight corridors are driving demand for dual-purpose 12V/24V AGM and lithium auxiliary batteries to power anti-idling cabin climate control systems. Tariff friction and US trade actions against Chinese and Southeast Asian imports have catalyzed near-shoring investments, with Asian producers establishing manufacturing footprints in Mexico and US domestic leaders (Clarios, East Penn, Stryten, EnerSys) expanding automated TPPL and AGM lines.
● Europe:
Europe represents the most stringently regulated and technically demanding SLI market globally. Near-100% penetration of micro-hybrid start-stop systems in new ICE/hybrid registrations and rapid BEV adoption have rendered conventional flooded batteries largely obsolete in the OEM channel, cementing AGM and EFB as the baseline standards. The EU’s heavy-duty vehicle CO2 emission standards (adopted in May 2024) are further accelerating the electrification of municipal buses and long-haul freight trucks. While OEM assembly volumes face macroeconomic headwinds, a vast accumulated vehicle parc guarantees steady aftermarket replacement volumes. Market dynamics are heavily dictated by compliance with EU Regulation 2023/1542, forcing non-integrated players out of the market due to carbon footprint and traceability costs.
● Middle East & Africa:
The MEA region is characterized by extreme ambient operating temperatures, which accelerate grid corrosion, water evaporation, and active material shedding in lead-acid cells. Consequently, battery replacement cycles in the Gulf Cooperation Council (GCC) and Sub-Saharan Africa are compressed to 18–30 months, compared to 36–60 months in temperate zones. This thermal degradation creates a lucrative, high-turnover aftermarket. Regional production is led by Turkish manufacturers (Mutlu Akü, Yiğit Akü, Esan Akü) and South African incumbents (Metindustrial / First National Battery), while Chinese, Indian, and Vietnamese exporters are aggressively capturing market share by introducing specialized high-temperature lead-silver and Pb-Ca-Sn alloy formulations across Saudi Arabia, the UAE, Qatar, Kuwait, and Nigeria.
● South America:
South America is a predominantly aftermarket-driven ecosystem anchored by Brazil, Argentina, Colombia, and Chile. The regional vehicle parc is dominated by older ICE passenger cars, ethanol/flex-fuel engines, and heavy agricultural/mining commercial vehicles, preserving strong baseline demand for conventional flooded CMF batteries alongside growing EFB demand in urban centers. To bypass volatile local currencies and import tariffs, Asian and European battery manufacturers are increasingly utilizing Latin American free-trade corridors—including Mexican production hubs—to distribute maintenance-free SLI units into South American wholesale networks.
SUPPLY CHAIN ARCHITECTURE, CHANNEL ECONOMICS & CIRCULARITY
● Upstream Feedstocks:
In lead-acid manufacturing, refined lead and lead alloys (Pb-Sb, Pb-Ca-Sn, Pb-Ag) represent 60% to 70% of total Bill of Materials (BOM) costs, indexing directly to London Metal Exchange (LME) settlement prices. Secondary cost drivers include virgin and recycled Polypropylene (PP) resin copolymer granules for injection-molded containers, high-purity sulfuric acid, and specialized separators. Field intelligence highlights the separator segment as a critical mid-tier bottleneck: while standard PE envelope separators are widely available, high-grade micro-glass fiber mats for AGM and polymeric scrims for EFB are concentrated among specialized chemical suppliers (such as Daramic), granting pricing power during capacity crunches.
● Midstream Cell & Pack Engineering:
Midstream manufacturing has transitioned from labor-intensive batch processing to continuous, automated lines to prevent occupational lead exposure and improve plate consistency. Core stages include Barton Pot or ball-mill lead oxide powder synthesis; continuous high-speed grid punching or expanded metal fabrication (which offers superior conductivity and corrosion resistance over traditional gravity casting); automated double-sided pasting and hydro-set humidity curing; element stacking with Cast-on-Strap (COS) automated group welding; thermal fusion container sealing; and containerized electrolyte formation charging. In low-voltage lithium/sodium lines, midstream value shifts toward electrode calendaring, cell formation, and the integration of automotive-grade BMS MOSFET switches and CAN/LIN bus communication interfaces.
● Closed-Loop Circularity:
The lead-acid SLI industry operates the world's most efficient industrial circular economy, achieving collection and recycling rates exceeding 99% in North America, Europe, and regulated Asian markets. Vertically integrated manufacturers operate automated Used Lead-Acid Battery (ULAB) crushing, hydro-metallurgical desulfurization, rotary furnace smelting, and plastic reprocessing plants (such as Seri Industrial's Serilene/Serifill PP recovery systems, Exide’s Chloride Metals subsidiary, and Camel Group’s 860,000-ton/year ULAB network).
● Asymmetric Channel Economics: OEM vs. Aftermarket (REM)
The SLI route-to-market is governed by asymmetric margin profiles between the Original Equipment Manufacturer (OEM) channel and the Replacement Equipment Market (REM):
* The OEM Channel (Strategic Loss-Leader / Volume Anchor):
Accounting for roughly 25% to 35% of global unit volume, direct B2B supply to automotive assembly plants requires navigating 18-to-36-month technical qualification audits and strict IATF 16949 quality compliance. Automakers leverage consolidated purchasing power to enforce raw-material indexation clauses, compressing battery manufacturer gross margins into the single digits or low teens. However, OEM fitment is strategically non-negotiable: it absorbs fixed factory overhead and establishes brand specification lock-in. Consumer behavior audits confirm that vehicle owners and dealership service centers overwhelmingly replace failed batteries with the exact chemistry and brand specification installed on the factory line.
* The REM Aftermarket (The Profit Engine):
Representing 65% to 75% of industry volume and the vast majority of operating profit, the aftermarket is insulated from cyclical new car registration slumps by the massive global installed vehicle parc and the inevitable electrochemical degradation of SLI batteries every 3 to 5 years. Traditional multi-tiered wholesale distribution (national distributors to regional jobbers to independent garages) is rapidly being disrupted by Digitalized Online-to-Offline (O2O) platforms. Leading manufacturers are forward-integrating into direct-to-consumer service networks—exemplified by digital dispatch ecosystems that link e-commerce portals (Tmall, JD, Amazon) and auto-service chains with tens of thousands of local retail terminals to deliver 24/7 doorstep battery testing, installation, and immediate ULAB core collection within 30 minutes.
REGULATORY FRAMEWORKS & COMPLIANCE MANDATES
Regulatory intervention has shifted from localized factory emission controls to end-to-end lifecycle traceability, erecting formidable capital barriers to entry.
● European Union Battery Regulation (EU 2023/1542) & Digital Product Passport (DPP):
Enforced in phases from February 2024 through 2033, this regulation fundamentally alters market access in Europe. Manufacturers must provide verified lifecycle carbon footprint declarations, comply with strict due diligence on raw material sourcing, and meet mandatory minimum recycled content thresholds (specifically targeting 85% recycled lead content alongside strict recovery mandates for lithium, nickel, and cobalt). By 2027, every industrial and automotive battery series placed on the EU market requires a QR-linked Digital Product Passport (DPP) detailing electrochemical composition, dismantling instructions, and recycled content provenance. Furthermore, effective November 2026, the EU Delegated Decision updating European Waste Catalogue (EWC 16.06) codes formally integrates lithium-based waste streams alongside traditional lead-acid classifications, tightening cross-border hazardous waste transport rules.
● India Battery Waste Management Rules (BWMR 2022) & Extended Producer Responsibility (EPR):
Administered by India's Central Pollution Control Board (CPCB), BWMR 2022 legally mandates that battery manufacturers fulfill progressively rising EPR collection and recycling quotas via a centralized digital portal. Producers must either operate internal CPCB-certified smelting infrastructure or purchase verified EPR certificates from registered recyclers, effectively eliminating the informal ""backyard"" smelting sector that historically distorted Indian aftermarket pricing. In the 2025–2026 compliance cycle, tier-1 leaders demonstrated full regulatory alignment: Exide Industries fulfilled an EPR obligation of 238.73 thousand metric tons (up from 164.90 thousand MT the prior year), while Amara Raja achieved an 88.27% secondary recycled lead utilization rate.
COMPETITIVE LANDSCAPE & COMPANY PROFILES
● Clarios: The undisputed global volume leader in low-voltage energy storage, commanding premier brand equity through VARTA (Europe/Asia) and OPTIMA (North America/Global). Clarios operates a unmatched global closed-loop recycling network, recovering thousands of used batteries per hour across its smelting footprint. Strategically, Clarios is pivoting from a pure-play lead-acid supplier to a chemistry-agnostic low-voltage systems integrator, supplying advanced AGM, EFB, and 12V/48V lithium-ion packs tailored for software-defined vehicles and autonomous driving redundancies.
● Camel Group: The dominant low-voltage battery manufacturer in China across both OEM and REM channels. In 2025, Camel Group operated ~35 million KVAh of domestic lead-acid capacity and ~5 million KVAh of overseas capacity, producing 39.14 million KVAh and selling 38.85 million KVAh, backed by 860,000 tons/year of ULAB recycling capacity. Its primary moat is its proprietary ""You Neng Da"" digital O2O aftermarket network, connecting over 3,400 service providers and ~125,000 retail terminal shops for rapid replacement and ULAB reverse logistics. Camel is executing an aggressive multi-chemistry pivot: in 2025, its automotive low-voltage lithium battery sales surged 200.05% YoY to 51.44 MWh (64.74 MWh produced), securing 60 new lithium OEM project nominations (including Volkswagen, Nio, Seres, Voyah, and Foton Daimler) alongside 100 new lead-acid OEM nominations (BMW, SAIC VW, Chery, Great Wall). Furthermore, Camel delivered 12V/24V start-stop sodium-ion samples in 2025, spearheading the IEC/TC21 international standard proposal, while expanding manufacturing in Malaysia and Morocco under its ""3+N"" globalization strategy.
● GS Yuasa Corporation & Yuasa Battery (Thailand) PCL: Headquartered in Kyoto, GS Yuasa leverages deep R&D integration with Japanese OEMs (Toyota, Honda, Nissan, Mitsubishi) to dominate Asian OEM fitment and global replacement markets. Its Southeast Asian footprint is anchored by joint ventures including Siam GS Battery, Yuasa Battery Thailand, and GS Battery Vietnam. In Thailand, the group controls ~65% of the motorcycle OEM market and leads the automotive REM sector via Siam GS Battery (with Yuasa Thailand holding an additional 5.9% automotive REM share). The company is actively upgrading its ASEAN and Japanese lines toward high-DCA EFB and AGM formats while developing auxiliary lithium-ion modules for hybrid and electric platforms.
● East Penn Manufacturing Company: Operates the world’s largest single-site, vertically integrated lead-acid battery manufacturing and smelting complex in Lyon Station, Pennsylvania. Marketing under the flagship Deka brand, East Penn’s operational moat lies in its centralized closed-loop manufacturing efficiency, proprietary computer-controlled grid casting/punching, and deep penetration across North American commercial trucking fleets, agricultural equipment, and independent aftermarket distributors. The company continues to invest heavily in automated AGM and EFB capacity to serve the North American SUV and light-truck parc.
● Exide Industries Limited: India’s largest storage battery producer, commanding dominant market share across domestic OEM passenger car, commercial vehicle, and two-wheeler segments under the Exide and SF Sonic brands. Exide’s structural moat is anchored by its wholly owned subsidiary, Chloride Metals Limited, which ensures 100% internal secondary lead self-sufficiency and full BWMR EPR compliance. Strategically, Exide has commercialized advanced DIN-standard SLI-AGM lines targeted at European, GCC, CIS, and ASEAN export corridors, while investing heavily in gigawatt-scale cylindrical and prismatic lithium-ion cell manufacturing via Exide Energy Solutions Limited (in technical collaboration with SVOLT) to capture India's burgeoning EV auxiliary and traction markets.
● Leoch International Technology Limited: A premier global exporter of SLI and industrial reserve batteries, operating expansive manufacturing bases across China (Jiangsu, Anhui, Guangdong) and Vietnam (Leoch Super Power Vietnam), alongside a burgeoning assembly footprint in Mexico. Leoch has engineered specialized high-temperature lead alloy formulations that have captured substantial aftermarket volume across the Middle East, Africa, and South America. Simultaneously, Leoch has commercialized 12V/24V LFP start-stop and auxiliary battery lines for global NEV and commercial fleet customers.
● SEBANG Global Battery Co., Ltd.: South Korea’s leading SLI battery exporter, globally recognized for its ""Rocket"" brand. Operating vast manufacturing complexes in Changwon and Gwangju, supplemented by Sebang Battery Vina in Vietnam and distribution subsidiaries in Germany and the United States, SEBANG acts as a primary OEM supplier to Hyundai Motor Group and global automakers. The company’s strategic focus centers on high-margin AGM and EFB start-stop exports to Europe and North America, insulating its revenue base from domestic market saturation.
● Amara Raja Energy & Mobility Limited: A tier-1 Indian manufacturer recognized for its high-margin ""Amaron"" and ""PowerZone"" brands, exporting to over 70 countries. Amara Raja disrupted the Indian aftermarket by pioneering extended-warranty, zero-maintenance calcium-silver alloy batteries Utilizing 88.27% recycled secondary lead, the company is aggressively expanding its punched-grid AGM and EFB capacities while constructing its ""Giga Corridor"" in Telangana to commercialize low-voltage LFP and sodium-ion cell technologies.
● EnerSys: A global leader in stored energy systems with a lucrative, high-moat niche in specialty transportation SLI. EnerSys dominates premium heavy-duty commercial trucking, military, aerospace, and off-highway markets utilizing its proprietary ODYSSEY Thin Plate Pure Lead (TPPL) AGM technology, which delivers extreme pulse cranking power and deep-cycle reserve capacity unmatched by conventional AGM designs.
● Stryten Energy: Formed from the North American transportation and industrial assets of Exide Technologies, Stryten Energy is a major US domestic supplier of flooded, EFB, and AGM starting batteries for passenger cars, heavy-duty Class 8 fleets, and government/military applications. Stryten leverages nationwide US distribution centers and domestic recycling loops to compete directly with Clarios and East Penn in major retail auto-parts chains.
● Banner Group & Midac Batteries: Representing independent European engineering excellence, family-owned Banner Group (Linz-Leonding) and Italy’s Midac supply high-specification AGM and EFB start-stop batteries to premier European OEMs (including BMW, VW, Porsche, and heavy truck makers) and the European aftermarket. Both firms rely on high factory automation and strict adherence to EU environmental mandates to defend regional market share against Asian imports.
● Mutlu Akü, Yiğit Akü, & Esan Akü: Türkiye serves as a vital EMEA battery manufacturing bridge. Mutlu Akü (integrated with Metair/Quexco), Yiğit Akü, and Esan Akü operate massive production facilities supplying domestic Turkish automotive assembly plants and exporting heavy-duty commercial, agricultural, taxi, and start-stop AGM/EFB batteries across Europe, Russia/CIS, the Middle East, and North Africa. Yiğit Akü has additionally diversified into industrial and automotive lithium battery packs.
● Regional Specialized Players: In Southeast Asia, Thai Energy Storage Technology PLC (TES / 3K Battery, holding 5.70 million units of annual capacity across 4 plants) and Vietnam’s Dry Cell and Storage Battery JSC (PINACO, commanding a 31% domestic Vietnamese share with its ""Dongnai"" brand and recording a 230% YoY surge in CMF export revenue in 2025 following its July 2025 Dong Nai plant relocation) anchor regional supply alongside Malaysia’s ABM Fujiya Berhad and Yokohama Batteries. In China, Chongqing Wanli New Energy Co., Ltd. maintains a legacy SLI footprint dating to 1943. In India, Goldstar Power Limited serves domestic and export replacement niches. In South Korea, DN Automotive maintains a robust OEM/aftermarket starting battery footprint. In Southern Africa, Metindustrial (Pty) Ltd (First National Battery) dominates OEM and mining/commercial replacement channels. Meanwhile, Veken Holding Group (China) leverages its 3C and small-power lithium/sodium R&D capabilities to support multi-chemistry testing and emerging low-voltage applications.
OPPORTUNITIES & INHIBITORS
● High-Conviction Market Opportunities
* The Auxiliary 12V BEV Paradox and LFP Substitution:
The prevailing narrative that vehicle electrification cannibalizes the SLI battery market is fundamentally flawed. Every BEV requires a highly reliable 12V (or 24V/48V) auxiliary battery to boot the vehicle’s central computer, close high-voltage traction battery contactors, and provide redundant power for brake-by-wire and steer-by-wire systems if the main DC-DC converter fails. Because standard flooded lead-acid batteries suffer from sulfation under the constant shallow micro-cycling of EV architectures, OEMs are locked into upgrading to high-margin 12V AGM or 12V LFP packs. Suppliers capable of offering dual-chemistry OEM portfolios (AGM for cost-sensitive EVs; LFP for weight-sensitive premium EVs) will capture disproportionate value growth.
* The 24V Heavy-Duty Commercial Truck Anti-Idling Niche:
Across North America, Europe, and China, stringent anti-idling ordinances and rising diesel fuel costs prevent long-haul truck drivers from running main engines during mandatory rest stops. This has triggered an aftermarket boom for high-capacity 24V dual-purpose (starting plus deep-cycle cabin parking air-conditioning) batteries. Converting heavy commercial fleets from standard flooded 24V series setups to 24V AGM or 24V LFP packs represents one of the highest-margin expansion avenues in the commercial aftermarket.
* First-Mover Arbitrage in 12V Sodium-Ion Cold-Cranking Systems:
While LFP excels in weight reduction, lithium iron phosphate suffers from severe lithium-plating risks and high internal resistance when charged below 0°C, requiring energy-draining BMS heating films in cold climates. Sodium-ion batteries operate seamlessly down to -40°C without auxiliary heating, carry zero over-discharge degradation risk (capable of shipping at 0V), and utilize low-cost soda ash feedstocks. Manufacturers commercializing drop-in 12V and 24V Na-ion starter batteries between 2026 and 2028 will capture significant market share in northern latitudes (Canada, Northern Europe, Russia, Northeast China) and commercial start-stop fleets.
* O2O Aftermarket Forward Integration:
Traditional battery manufacturers that rely solely on passive wholesale distributors face margin compression from private-label retail brands. By deploying proprietary digital O2O dispatch platforms, manufacturers bypass middlemen, capture retail installation margins, build direct consumer brand loyalty, and—most critically—lock in 100% physical recovery of the spent ULAB core at the moment of installation, starving non-integrated competitors of secondary lead feedstock.
* Regulatory Consolidation Arbitrage:
The capital intensity required to comply with EU Digital Product Passports, India’s BWMR EPR quotas, and Zero Liquid Discharge (ZLD) smelting effluent standards is forcing under-capitalized tier-3 lead-acid producers to exit the market. Tier-1 incumbents have a clear window to execute distressed brownfield acquisitions, consolidating regional aftermarket share at discounted valuations.
● Structural Challenges & Operational Vulnerabilities
* LME Commodity Squeeze vs. Fixed-Price OEM Contracts:
Despite high recycling rates, battery manufacturing remains exposed to the spread between London Metal Exchange (LME) primary lead prices, local scrap battery (ULAB) acquisition costs, and sulfuric acid/polypropylene inflation. During periods of rapid LME spikes, lag times in OEM contract price-escalation formulas can severely compress quarterly operating margins for producers lacking 100% internal smelting coverage.
* Tariff Walls and Supply ChainBalkanization:
The escalation of protectionist trade policies—including US Section 301 tariffs, anti-dumping duties, and European carbon border adjustments—has eroded the viability of single-hub Asian export models. Exporters in China, South Korea, and Southeast Asia face margin erosion unless they commit heavy capital expenditure to localize cell manufacturing and recycling loops directly within North America (e.g., Mexico/US) and the EMEA basin (e.g., Morocco, Türkiye, Eastern Europe).
* Working Capital Strain from Multi-Chemistry R&D:
Maintaining parallel R&D, tooling, and automated assembly lines for five distinct chemistries (CMF, EFB, AGM, LFP, and Na-ion) creates substantial capital allocation friction. While lead-acid lines generate steady free cash flow, low-voltage lithium and sodium lines currently suffer from intense price competition with traction-battery giants (such as CATL and BYD) that dump excess LFP cell capacity into the 12V/24V auxiliary market, depressing returns on invested capital (ROIC) for traditional SLI players.
* Extended Battery Lifecycles Dampening Replacement Velocity:
As the global vehicle parc gradually shifts from conventional flooded batteries (3-to-4-year replacement cycle) to premium AGM (5-to-6-year cycle) and 12V LFP/Na-ion systems (8-to-10+ year lifecycle), the long-term velocity of aftermarket replacement per registered vehicle will structurally decelerate in the post-2030 horizon. Manufacturers must offset slowing unit replacement frequency by capturing higher unit ASPs and monetizing software-enabled BMS diagnostics.
1.1 Report Overview and Scope Definition ... 1
1.2 Research Methodology, Data Sources, and Core Assumptions ... 2
1.3 Analytical Framework and Market Sizing Logic ... 4
1.4 Abbreviations and Technical Nomenclature ... 5
Chapter 2 Executive Summary and Global Automotive SLI Battery Market Dynamics ... 6
2.1 Global Automotive SLI Battery Market Capacity, Production, Consumption, and Market Size (2021-2031) ... 6
2.2 Value Migration Across Lead-Acid, AGM, EFB, Lithium-Ion, and Sodium-Ion Chemistries ... 7
2.3 Macroeconomic Catalysts, Regulatory Mandates, and Start-Stop Vehicle Parc Evolution ... 8
2.4 Supply-Demand Imbalances and Utilization Rate Trajectories ... 9
Chapter 3 Automotive SLI Battery Value Chain, Supply Chain Bottlenecks, and Cost Structure Architecture ... 10
3.1 End-to-End Value Chain Architecture and Margin Distribution ... 10
3.2 Upstream Raw Material Dynamics: Primary and Secondary Lead, AGM Microfiber Separators, Lithium Iron Phosphate, and Hard Carbon ... 11
3.3 Closed-Loop Recycling Ecosystems and Secondary Smelting Bottlenecks ... 12
3.4 Unit Manufacturing Cost Breakdown and Raw Material Price Sensitivity Analysis (2021-2026) ... 13
3.5 Logistics Networks, Hazardous Material Handling, and Regional Supply Chain Resilience ... 14
Chapter 4 Manufacturing Process, Technological Evolution, and Patent Landscape ... 15
4.1 Grid Manufacturing Topologies: Stamped Grid, Continuous Casting, and Expanded Metal Processes ... 15
4.2 Electrochemical Performance Benchmarking: Cold Cranking Amps (CCA), Charge Acceptance, and Cycle Life ... 16
4.3 Next-Generation 12V and 48V Auxiliary Battery Management Systems (BMS) Integration ... 17
4.4 Global Patent Filing Trends, Technology Clusters, and Intellectual Property White Spaces (2021-2026) ... 18
4.5 Technical Substitution Velocity: Sodium-Ion and LFP Versus Advanced VRLA ... 19
Chapter 5 Global Automotive SLI Battery Market Segmentation by Chemistry and Technology Type (2021-2031) ... 20
5.1 Global Market Overview by Type: Production, Consumption, Market Size, and Average Selling Price ... 20
5.2 Flooded Lead-Acid Battery ... 21
5.3 Enhanced Lead-Acid Battery ... 22
5.4 Absorbed Glass Mat VRLA Battery ... 23
5.5 Sodium Battery ... 25
5.6 Lithium Battery ... 26
Chapter 6 Global Automotive SLI Battery Market Segmentation by Application and Sales Channel (2021-2031) ... 27
6.1 Global Market Overview by Application: Demand Volume and Revenue Trajectory ... 27
6.2 Passenger Car ... 28
6.3 Commercial Vehicle ... 29
6.4 Global Market Overview by Sales Channel: Margin Profile and Replacement Cycle Dynamics ... 30
6.5 OEM Market ... 30
6.6 Aftermarket ... 31
Chapter 7 Global Automotive SLI Battery Trade Flows, Import/Export Dynamics, and Tariff Impacts ... 32
7.1 Global Cross-Border Trade Architecture and Key Exporting Hubs (2021-2026) ... 32
7.2 Major Importing Markets, Regional Trade Balances, and Supply Deficits ... 33
7.3 Tariff Regimes, Rules of Origin (USMCA, EU Battery Regulation), and Non-Tariff Trade Barriers ... 34
7.4 Cross-Border Freight Economics and Regional Localization Shifts ... 35
Chapter 8 North America Automotive SLI Battery Market Analysis (2021-2031) ... 36
8.1 North America Market Overview: Capacity, Production, Consumption, and Market Size ... 36
8.2 United States ... 37
8.3 Mexico ... 39
8.4 Canada ... 40
Chapter 9 Europe Automotive SLI Battery Market Analysis (2021-2031) ... 41
9.1 Europe Market Overview: Capacity, Production, Consumption, and Market Size ... 41
9.2 Germany ... 42
9.3 Turkey ... 43
9.4 Italy ... 44
9.5 Austria ... 45
9.6 United Kingdom ... 46
9.7 France ... 46
9.8 Spain & Rest of Europe ... 47
Chapter 10 Asia-Pacific Automotive SLI Battery Market Analysis (2021-2031) ... 48
10.1 Asia-Pacific Market Overview: Capacity, Production, Consumption, and Market Size ... 48
10.2 China ... 49
10.3 Japan ... 51
10.4 South Korea ... 52
10.5 India ... 53
10.6 Thailand ... 54
10.7 Malaysia ... 55
10.8 Vietnam ... 55
10.9 Indonesia ... 56
Chapter 11 South America and Middle East & Africa Automotive SLI Battery Market Analysis (2021-2031) ... 57
11.1 South America and Middle East & Africa Market Overview: Capacity, Production, Consumption, and Market Size ... 57
11.2 Brazil ... 58
11.3 Argentina ... 58
11.4 South Africa ... 59
11.5 Saudi Arabia ... 60
11.6 United Arab Emirates ... 60
Chapter 12 Global Competitive Landscape and Corporate Market Share Analysis ... 61
12.1 Global Automotive SLI Battery Manufacturer Tiering and Market Concentration (CR3, CR5, CR10) ... 61
12.2 Corporate Side Benchmarking: Global Capacity, Production, and Revenue by Manufacturer (2021-2026) ... 62
12.3 Pricing Power, Gross Margin Dispersion, and Capacity Expansion Announcements ... 63
12.4 Strategic Alliances, OEM Supply Contracts, and M&A Consolidation Trends ... 64
Chapter 13 Key Market Players Operational and Financial Intelligence ... 65
13.1 GS Yuasa Corporation ... 65
13.1.1 Corporate Profile and Strategic Positioning ... 65
13.1.2 SWOT Analysis ... 66
13.1.3 Automotive SLI Battery Operational Performance (Capacity, Production, Utilization Rate, Price, Cost, Gross Margin, Market Share) ... 67
13.1.4 R&D Expenditure and Go-To-Market Strategy ... 68
13.2 EnerSys ... 69
13.2.1 Corporate Profile and Strategic Positioning ... 69
13.2.2 SWOT Analysis ... 70
13.2.3 Automotive SLI Battery Operational Performance (Capacity, Production, Utilization Rate, Price, Cost, Gross Margin, Market Share) ... 71
13.2.4 R&D Expenditure and Go-To-Market Strategy ... 72
13.3 East Penn Manufacturing Company ... 73
13.3.1 Corporate Profile and Strategic Positioning ... 73
13.3.2 SWOT Analysis ... 74
13.3.3 Automotive SLI Battery Operational Performance (Capacity, Production, Utilization Rate, Price, Cost, Gross Margin, Market Share) ... 75
13.3.4 R&D Expenditure and Go-To-Market Strategy ... 76
13.4 Stryten Energy ... 77
13.4.1 Corporate Profile and Strategic Positioning ... 77
13.4.2 SWOT Analysis ... 78
13.4.3 Automotive SLI Battery Operational Performance (Capacity, Production, Utilization Rate, Price, Cost, Gross Margin, Market Share) ... 79
13.4.4 R&D Expenditure and Go-To-Market Strategy ... 80
13.5 Banner Group ... 81
13.5.1 Corporate Profile and Strategic Positioning ... 81
13.5.2 SWOT Analysis ... 82
13.5.3 Automotive SLI Battery Operational Performance (Capacity, Production, Utilization Rate, Price, Cost, Gross Margin, Market Share) ... 83
13.5.4 R&D Expenditure and Go-To-Market Strategy ... 84
13.6 Clarios ... 85
13.6.1 Corporate Profile and Strategic Positioning ... 85
13.6.2 SWOT Analysis ... 86
13.6.3 Automotive SLI Battery Operational Performance (Capacity, Production, Utilization Rate, Price, Cost, Gross Margin, Market Share) ... 87
13.6.4 R&D Expenditure and Go-To-Market Strategy ... 88
13.7 Exide Industries Ltd ... 89
13.7.1 Corporate Profile and Strategic Positioning ... 89
13.7.2 SWOT Analysis ... 90
13.7.3 Automotive SLI Battery Operational Performance (Capacity, Production, Utilization Rate, Price, Cost, Gross Margin, Market Share) ... 91
13.7.4 R&D Expenditure and Go-To-Market Strategy ... 92
13.8 Leoch International Technology Limited ... 93
13.8.1 Corporate Profile and Strategic Positioning ... 93
13.8.2 SWOT Analysis ... 94
13.8.3 Automotive SLI Battery Operational Performance (Capacity, Production, Utilization Rate, Price, Cost, Gross Margin, Market Share) ... 95
13.8.4 R&D Expenditure and Go-To-Market Strategy ... 96
13.9 Camel Group ... 97
13.9.1 Corporate Profile and Strategic Positioning ... 97
13.9.2 SWOT Analysis ... 98
13.9.3 Automotive SLI Battery Operational Performance (Capacity, Production, Utilization Rate, Price, Cost, Gross Margin, Market Share) ... 99
13.9.4 R&D Expenditure and Go-To-Market Strategy ... 100
13.10 Sebang Global Battery ... 101
13.10.1 Corporate Profile and Strategic Positioning ... 101
13.10.2 SWOT Analysis ... 102
13.10.3 Automotive SLI Battery Operational Performance (Capacity, Production, Utilization Rate, Price, Cost, Gross Margin, Market Share) ... 103
13.10.4 R&D Expenditure and Go-To-Market Strategy ... 104
13.11 Yiğit Akü Malzemeleri A.Ş. ... 105
13.11.1 Corporate Profile and Strategic Positioning ... 105
13.11.2 SWOT Analysis ... 106
13.11.3 Automotive SLI Battery Operational Performance (Capacity, Production, Utilization Rate, Price, Cost, Gross Margin, Market Share) ... 107
13.11.4 R&D Expenditure and Go-To-Market Strategy ... 108
13.12 Midac ... 109
13.12.1 Corporate Profile and Strategic Positioning ... 109
13.12.2 SWOT Analysis ... 110
13.12.3 Automotive SLI Battery Operational Performance (Capacity, Production, Utilization Rate, Price, Cost, Gross Margin, Market Share) ... 111
13.12.4 R&D Expenditure and Go-To-Market Strategy ... 112
13.13 Goldstar Power Limited ... 113
13.13.1 Corporate Profile and Strategic Positioning ... 113
13.13.2 SWOT Analysis ... 114
13.13.3 Automotive SLI Battery Operational Performance (Capacity, Production, Utilization Rate, Price, Cost, Gross Margin, Market Share) ... 115
13.13.4 R&D Expenditure and Go-To-Market Strategy ... 116
13.14 Yuasa Battery (Thailand) PCL ... 117
13.14.1 Corporate Profile and Strategic Positioning ... 117
13.14.2 SWOT Analysis ... 118
13.14.3 Automotive SLI Battery Operational Performance (Capacity, Production, Utilization Rate, Price, Cost, Gross Margin, Market Share) ... 119
13.14.4 R&D Expenditure and Go-To-Market Strategy ... 120
13.15 Chongqing Wanli New Energy Co. Ltd. ... 121
13.15.1 Corporate Profile and Strategic Positioning ... 121
13.15.2 SWOT Analysis ... 122
13.15.3 Automotive SLI Battery Operational Performance (Capacity, Production, Utilization Rate, Price, Cost, Gross Margin, Market Share) ... 123
13.15.4 R&D Expenditure and Go-To-Market Strategy ... 124
13.16 ABM Fujiya Berhad ... 125
13.16.1 Corporate Profile and Strategic Positioning ... 125
13.16.2 SWOT Analysis ... 126
13.16.3 Automotive SLI Battery Operational Performance (Capacity, Production, Utilization Rate, Price, Cost, Gross Margin, Market Share) ... 127
13.16.4 R&D Expenditure and Go-To-Market Strategy ... 128
13.17 Metindustrial (Pty) Ltd ... 129
13.17.1 Corporate Profile and Strategic Positioning ... 129
13.17.2 SWOT Analysis ... 130
13.17.3 Automotive SLI Battery Operational Performance (Capacity, Production, Utilization Rate, Price, Cost, Gross Margin, Market Share) ... 131
13.17.4 R&D Expenditure and Go-To-Market Strategy ... 132
13.18 Amara Raja Energy & Mobility Limited ... 133
13.18.1 Corporate Profile and Strategic Positioning ... 133
13.18.2 SWOT Analysis ... 134
13.18.3 Automotive SLI Battery Operational Performance (Capacity, Production, Utilization Rate, Price, Cost, Gross Margin, Market Share) ... 135
13.18.4 R&D Expenditure and Go-To-Market Strategy ... 136
13.19 Mutlu Akü ... 137
13.19.1 Corporate Profile and Strategic Positioning ... 137
13.19.2 SWOT Analysis ... 138
13.19.3 Automotive SLI Battery Operational Performance (Capacity, Production, Utilization Rate, Price, Cost, Gross Margin, Market Share) ... 139
13.19.4 R&D Expenditure and Go-To-Market Strategy ... 140
13.20 Esan Akü ... 141
13.20.1 Corporate Profile and Strategic Positioning ... 141
13.20.2 SWOT Analysis ... 142
13.20.3 Automotive SLI Battery Operational Performance (Capacity, Production, Utilization Rate, Price, Cost, Gross Margin, Market Share) ... 143
13.20.4 R&D Expenditure and Go-To-Market Strategy ... 144
13.21 Yokohama Batteries ... 145
13.21.1 Corporate Profile and Strategic Positioning ... 145
13.21.2 SWOT Analysis ... 146
13.21.3 Automotive SLI Battery Operational Performance (Capacity, Production, Utilization Rate, Price, Cost, Gross Margin, Market Share) ... 147
13.21.4 R&D Expenditure and Go-To-Market Strategy ... 148
13.22 Veken Holding Group ... 149
13.22.1 Corporate Profile and Strategic Positioning ... 149
13.22.2 SWOT Analysis ... 150
13.22.3 Automotive SLI Battery Operational Performance (Capacity, Production, Utilization Rate, Price, Cost, Gross Margin, Market Share) ... 151
13.22.4 R&D Expenditure and Go-To-Market Strategy ... 152
13.23 DN Automotive ... 153
13.23.1 Corporate Profile and Strategic Positioning ... 153
13.23.2 SWOT Analysis ... 154
13.23.3 Automotive SLI Battery Operational Performance (Capacity, Production, Utilization Rate, Price, Cost, Gross Margin, Market Share) ... 155
13.23.4 R&D Expenditure and Go-To-Market Strategy ... 156
13.24 Thai Energy Storage Technology Public Company Limited (TES) ... 157
13.24.1 Corporate Profile and Strategic Positioning ... 157
13.24.2 SWOT Analysis ... 158
13.24.3 Automotive SLI Battery Operational Performance (Capacity, Production, Utilization Rate, Price, Cost, Gross Margin, Market Share) ... 159
13.24.4 R&D Expenditure and Go-To-Market Strategy ... 160
13.25 Dry Cell and Storage Battery JSC (Pinaco) ... 161
13.25.1 Corporate Profile and Strategic Positioning ... 161
13.25.2 SWOT Analysis ... 162
13.25.3 Automotive SLI Battery Operational Performance (Capacity, Production, Utilization Rate, Price, Cost, Gross Margin, Market Share) ... 163
13.25.4 R&D Expenditure and Go-To-Market Strategy ... 164
Chapter 14 Downstream xEV Low-Voltage Architecture Transition and Strategic Outlook (2027-2031) ... 165
Table 2: Industry Abbreviations and Technical Nomenclature ... 5
Table 3: Global Automotive SLI Battery Capacity, Production, Consumption, and Market Size (2021-2031) ... 6
Table 4: Automotive SLI Battery Value Chain Margin Distribution Across Raw Materials, Cell/Module Assembly, and Distribution ... 10
Table 5: Key Raw Material Price Trends: LME Lead, Antimony, AGM Glass Microfiber, LFP, and Sodium Precursors (2021-2026) ... 11
Table 6: Global Automotive SLI Battery Unit Cost Breakdown by Chemistry Type (2026) ... 13
Table 7: Electrochemical and Physical Performance Comparison Across Flooded, EFB, AGM, Sodium-Ion, and Lithium-Ion SLI Batteries ... 16
Table 8: Key Global Patent Filings in Automotive SLI and Low-Voltage Auxiliary Batteries (2021-2026) ... 18
Table 9: Global Automotive SLI Battery Production by Type (2021-2031) ... 20
Table 10: Global Automotive SLI Battery Consumption by Type (2021-2031) ... 21
Table 11: Global Automotive SLI Battery Market Size (Revenue) by Type (2021-2031) ... 21
Table 12: Global Automotive SLI Battery Average Selling Price by Type (2021-2031) ... 22
Table 13: Global Flooded Lead-Acid Battery Capacity, Production, Consumption, and Market Size (2021-2031) ... 22
Table 14: Global Enhanced Lead-Acid Battery Capacity, Production, Consumption, and Market Size (2021-2031) ... 23
Table 15: Global Absorbed Glass Mat VRLA Battery Capacity, Production, Consumption, and Market Size (2021-2031) ... 24
Table 16: Global Sodium Battery Capacity, Production, Consumption, and Market Size (2021-2031) ... 25
Table 17: Global Lithium Battery Capacity, Production, Consumption, and Market Size (2021-2031) ... 26
Table 18: Global Automotive SLI Battery Consumption Volume by Application (2021-2031) ... 27
Table 19: Global Automotive SLI Battery Market Size (Revenue) by Application (2021-2031) ... 28
Table 20: Global Automotive SLI Battery Consumption Volume by Sales Channel (2021-2031) ... 30
Table 21: Global Automotive SLI Battery Market Size (Revenue) by Sales Channel (2021-2031) ... 31
Table 22: Global Automotive SLI Battery Export Volume and Value by Top Exporting Countries (2021-2026) ... 32
Table 23: Global Automotive SLI Battery Import Volume and Value by Top Importing Countries (2021-2026) ... 33
Table 24: Import Tariff Rates and Regulatory Compliance Matrix Across Major Automotive Markets (2026) ... 34
Table 25: North America Automotive SLI Battery Capacity, Production, Consumption, and Market Size (2021-2031) ... 36
Table 26: North America Automotive SLI Battery Consumption and Market Size by Country (2021-2031) ... 37
Table 27: Europe Automotive SLI Battery Capacity, Production, Consumption, and Market Size (2021-2031) ... 41
Table 28: Europe Automotive SLI Battery Consumption and Market Size by Country (2021-2031) ... 42
Table 29: Asia-Pacific Automotive SLI Battery Capacity, Production, Consumption, and Market Size (2021-2031) ... 48
Table 30: Asia-Pacific Automotive SLI Battery Consumption and Market Size by Country (2021-2031) ... 49
Table 31: South America and Middle East & Africa Automotive SLI Battery Capacity, Production, Consumption, and Market Size (2021-2031) ... 57
Table 32: South America and Middle East & Africa Automotive SLI Battery Consumption and Market Size by Country (2021-2031) ... 58
Table 33: Global Top 25 Manufacturers Automotive SLI Battery Capacity (2021-2026) ... 61
Table 34: Global Top 25 Manufacturers Automotive SLI Battery Production (2021-2026) ... 62
Table 35: Global Top 25 Manufacturers Automotive SLI Battery Revenue and Market Share (2021-2026) ... 63
Table 36: GS Yuasa Corporation Automotive SLI Battery Capacity, Production, Price, Cost and Gross Profit Margin (2021-2026) ... 67
Table 37: EnerSys Automotive SLI Battery Capacity, Production, Price, Cost and Gross Profit Margin (2021-2026) ... 71
Table 38: East Penn Manufacturing Company Automotive SLI Battery Capacity, Production, Price, Cost and Gross Profit Margin (2021-2026) ... 75
Table 39: Stryten Energy Automotive SLI Battery Capacity, Production, Price, Cost and Gross Profit Margin (2021-2026) ... 79
Table 40: Banner Group Automotive SLI Battery Capacity, Production, Price, Cost and Gross Profit Margin (2021-2026) ... 83
Table 41: Clarios Automotive SLI Battery Capacity, Production, Price, Cost and Gross Profit Margin (2021-2026) ... 87
Table 42: Exide Industries Ltd Automotive SLI Battery Capacity, Production, Price, Cost and Gross Profit Margin (2021-2026) ... 91
Table 43: Leoch International Technology Limited Automotive SLI Battery Capacity, Production, Price, Cost and Gross Profit Margin (2021-2026) ... 95
Table 44: Camel Group Automotive SLI Battery Capacity, Production, Price, Cost and Gross Profit Margin (2021-2026) ... 99
Table 45: Sebang Global Battery Automotive SLI Battery Capacity, Production, Price, Cost and Gross Profit Margin (2021-2026) ... 103
Table 46: Yiğit Akü Malzemeleri A.Ş. Automotive SLI Battery Capacity, Production, Price, Cost and Gross Profit Margin (2021-2026) ... 107
Table 47: Midac Automotive SLI Battery Capacity, Production, Price, Cost and Gross Profit Margin (2021-2026) ... 111
Table 48: Goldstar Power Limited Automotive SLI Battery Capacity, Production, Price, Cost and Gross Profit Margin (2021-2026) ... 115
Table 49: Yuasa Battery (Thailand) PCL Automotive SLI Battery Capacity, Production, Price, Cost and Gross Profit Margin (2021-2026) ... 119
Table 50: Chongqing Wanli New Energy Co. Ltd. Automotive SLI Battery Capacity, Production, Price, Cost and Gross Profit Margin (2021-2026) ... 123
Table 51: ABM Fujiya Berhad Automotive SLI Battery Capacity, Production, Price, Cost and Gross Profit Margin (2021-2026) ... 127
Table 52: Metindustrial (Pty) Ltd Automotive SLI Battery Capacity, Production, Price, Cost and Gross Profit Margin (2021-2026) ... 131
Table 53: Amara Raja Energy & Mobility Limited Automotive SLI Battery Capacity, Production, Price, Cost and Gross Profit Margin (2021-2026) ... 135
Table 54: Mutlu Akü Automotive SLI Battery Capacity, Production, Price, Cost and Gross Profit Margin (2021-2026) ... 139
Table 55: Esan Akü Automotive SLI Battery Capacity, Production, Price, Cost and Gross Profit Margin (2021-2026) ... 143
Table 56: Yokohama Batteries Automotive SLI Battery Capacity, Production, Price, Cost and Gross Profit Margin (2021-2026) ... 147
Table 57: Veken Holding Group Automotive SLI Battery Capacity, Production, Price, Cost and Gross Profit Margin (2021-2026) ... 151
Table 58: DN Automotive Automotive SLI Battery Capacity, Production, Price, Cost and Gross Profit Margin (2021-2026) ... 155
Table 59: Thai Energy Storage Technology Public Company Limited (TES) Automotive SLI Battery Capacity, Production, Price, Cost and Gross Profit Margin (2021-2026) ... 159
Table 60: Dry Cell and Storage Battery JSC (Pinaco) Automotive SLI Battery Capacity, Production, Price, Cost and Gross Profit Margin (2021-2026) ... 163
Table 61: Global 12V/48V Auxiliary Battery Demand in ICE, HEV, PHEV, and BEV Powertrains (2021-2031) ... 165
Figure 1: Automotive SLI Battery Product Scope and Technology Segmentation Framework ... 1
Figure 2: Bottom-Up and Top-Down Market Triangulation Methodology ... 4
Figure 3: Global Automotive SLI Battery Market Size and Growth Rate (2021-2031) ... 7
Figure 4: Technology Value Migration Curve: Flooded Lead-Acid to EFB, AGM, Lithium-Ion, and Sodium-Ion (2021-2031) ... 8
Figure 5: Global Automotive SLI Battery Capacity Utilization Rate Trends (2021-2031) ... 9
Figure 6: Automotive SLI Battery End-to-End Supply Chain and Closed-Loop Lead Recycling Architecture ... 12
Figure 7: Manufacturing Cost Sensitivity to LME Lead and Lithium Carbonate Spot Prices (2021-2026) ... 14
Figure 8: Stamped Grid vs. Expanded Metal Manufacturing Process Flow ... 15
Figure 9: Cold Cranking Amps (CCA) and Low-Temperature Discharge Performance Curve (-30°C) by Chemistry ... 19
Figure 10: Global Automotive SLI Battery Market Share by Chemistry Type (2021 vs. 2026 vs. 2031) ... 20
Figure 11: Global Automotive SLI Battery Consumption Share by Application (2021-2031) ... 27
Figure 12: Global Passenger Car vs. Commercial Vehicle SLI Battery Replacement Cycle Comparison ... 29
Figure 13: Global Automotive SLI Battery Revenue Split: OEM Market vs. Aftermarket (2021-2031) ... 30
Figure 14: Global Automotive SLI Battery Inter-Regional Trade Flow Map (2026) ... 32
Figure 15: North America Automotive SLI Battery Market Size and Volume Trajectory (2021-2031) ... 36
Figure 16: United States Automotive SLI Battery Consumption by Chemistry Type (2021-2031) ... 38
Figure 17: Europe Automotive SLI Battery Market Size and Volume Trajectory (2021-2031) ... 41
Figure 18: Germany and Turkey Automotive SLI Battery Production and Export Comparison (2021-2031) ... 43
Figure 19: Asia-Pacific Automotive SLI Battery Market Size and Volume Trajectory (2021-2031) ... 48
Figure 20: China Automotive SLI Battery Production and Sodium/Lithium Penetration Rate (2021-2031) ... 50
Figure 21: South America and Middle East & Africa Automotive SLI Battery Market Size (2021-2031) ... 57
Figure 22: Global Automotive SLI Battery Market Concentration (CR3, CR5, CR10) Analysis (2026) ... 61
Figure 23: Global Top Manufacturers Capacity vs. Gross Margin Positioning Matrix (2026) ... 63
Figure 24: GS Yuasa Corporation Automotive SLI Battery Market Share (2021-2026) ... 68
Figure 25: EnerSys Automotive SLI Battery Market Share (2021-2026) ... 72
Figure 26: East Penn Manufacturing Company Automotive SLI Battery Market Share (2021-2026) ... 76
Figure 27: Stryten Energy Automotive SLI Battery Market Share (2021-2026) ... 80
Figure 28: Banner Group Automotive SLI Battery Market Share (2021-2026) ... 84
Figure 29: Clarios Automotive SLI Battery Market Share (2021-2026) ... 88
Figure 30: Exide Industries Ltd Automotive SLI Battery Market Share (2021-2026) ... 92
Figure 31: Leoch International Technology Limited Automotive SLI Battery Market Share (2021-2026) ... 96
Figure 32: Camel Group Automotive SLI Battery Market Share (2021-2026) ... 100
Figure 33: Sebang Global Battery Automotive SLI Battery Market Share (2021-2026) ... 104
Figure 34: Yiğit Akü Malzemeleri A.Ş. Automotive SLI Battery Market Share (2021-2026) ... 108
Figure 35: Midac Automotive SLI Battery Market Share (2021-2026) ... 112
Figure 36: Goldstar Power Limited Automotive SLI Battery Market Share (2021-2026) ... 116
Figure 37: Yuasa Battery (Thailand) PCL Automotive SLI Battery Market Share (2021-2026) ... 120
Figure 38: Chongqing Wanli New Energy Co. Ltd. Automotive SLI Battery Market Share (2021-2026) ... 124
Figure 39: ABM Fujiya Berhad Automotive SLI Battery Market Share (2021-2026) ... 128
Figure 40: Metindustrial (Pty) Ltd Automotive SLI Battery Market Share (2021-2026) ... 132
Figure 41: Amara Raja Energy & Mobility Limited Automotive SLI Battery Market Share (2021-2026) ... 136
Figure 42: Mutlu Akü Automotive SLI Battery Market Share (2021-2026) ... 140
Figure 43: Esan Akü Automotive SLI Battery Market Share (2021-2026) ... 144
Figure 44: Yokohama Batteries Automotive SLI Battery Market Share (2021-2026) ... 148
Figure 45: Veken Holding Group Automotive SLI Battery Market Share (2021-2026) ... 152
Figure 46: DN Automotive Automotive SLI Battery Market Share (2021-2026) ... 156
Figure 47: Thai Energy Storage Technology Public Company Limited (TES) Automotive SLI Battery Market Share (2021-2026) ... 160
Figure 48: Dry Cell and Storage Battery JSC (Pinaco) Automotive SLI Battery Market Share (2021-2026) ... 164
Figure 49: Zonal Electrical/Electronic (E/E) Architecture and Dual-Battery Redundancy Topology in Autonomous Vehicles ... 166
Figure 50: Global Automotive SLI Battery Profit Pool Evolution by Chemistry and Channel (2026-2031) ... 166
Research Methodology
- Market Estimated Methodology:
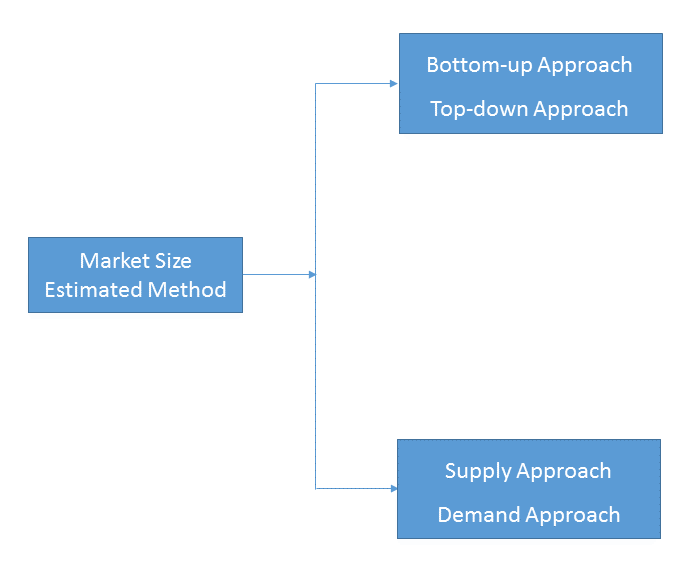
Bottom-up & top-down approach, supply & demand approach are the most important method which is used by HDIN Research to estimate the market size.
1)Top-down & Bottom-up Approach
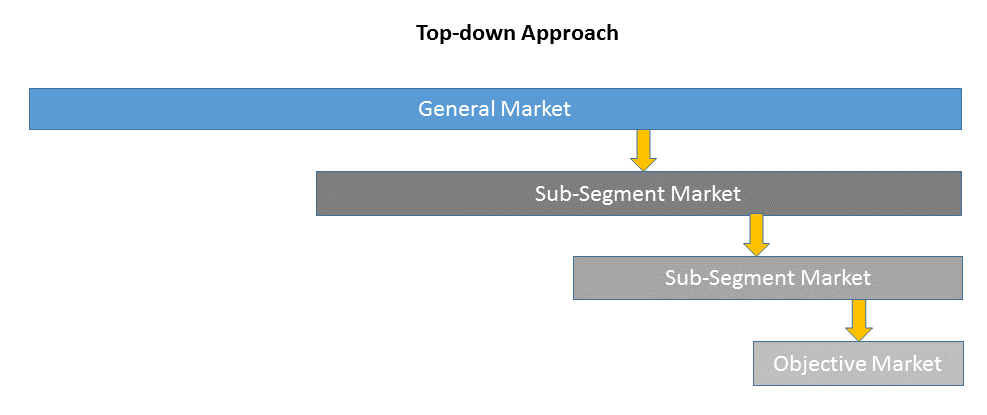
Top-down approach uses a general market size figure and determines the percentage that the objective market represents.
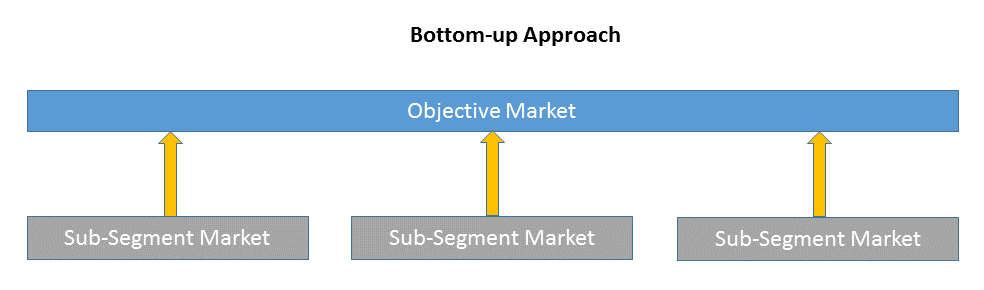
Bottom-up approach size the objective market by collecting the sub-segment information.
2)Supply & Demand Approach
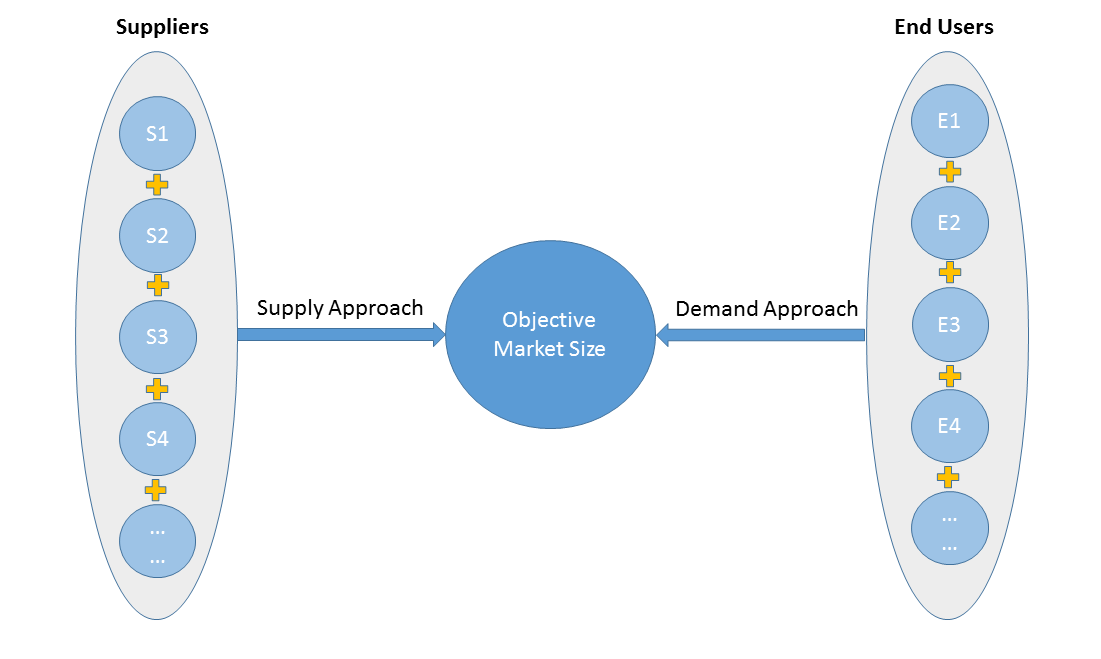
Supply approach is based on assessments of the size of each competitor supplying the objective market.
Demand approach combine end-user data within a market to estimate the objective market size. It is sometimes referred to as bottom-up approach.
- Forecasting Methodology
- Numerous factors impacting the market trend are considered for forecast model:
- New technology and application in the future;
- New project planned/under contraction;
- Global and regional underlying economic growth;
- Threatens of substitute products;
- Industry expert opinion;
- Policy and Society implication.
- Analysis Tools
1)PEST Analysis
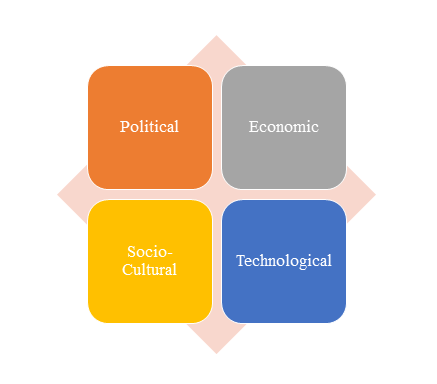
PEST Analysis is a simple and widely used tool that helps our client analyze the Political, Economic, Socio-Cultural, and Technological changes in their business environment.
- Benefits of a PEST analysis:
- It helps you to spot business opportunities, and it gives you advanced warning of significant threats.
- It reveals the direction of change within your business environment. This helps you shape what you’re doing, so that you work with change, rather than against it.
- It helps you avoid starting projects that are likely to fail, for reasons beyond your control.
- It can help you break free of unconscious assumptions when you enter a new country, region, or market; because it helps you develop an objective view of this new environment.
2)Porter’s Five Force Model Analysis
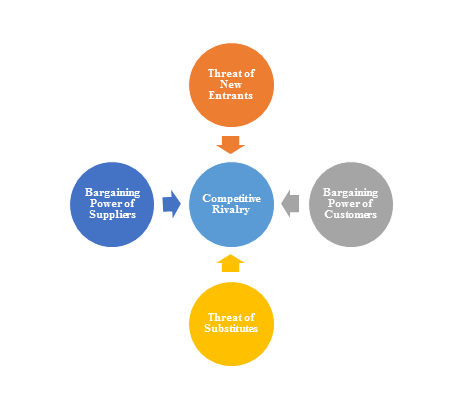
The Porter’s Five Force Model is a tool that can be used to analyze the opportunities and overall competitive advantage. The five forces that can assist in determining the competitive intensity and potential attractiveness within a specific area.
- Threat of New Entrants: Profitable industries that yield high returns will attract new firms.
- Threat of Substitutes: A substitute product uses a different technology to try to solve the same economic need.
- Bargaining Power of Customers: the ability of customers to put the firm under pressure, which also affects the customer's sensitivity to price changes.
- Bargaining Power of Suppliers: Suppliers of raw materials, components, labor, and services (such as expertise) to the firm can be a source of power over the firm when there are few substitutes.
- Competitive Rivalry: For most industries the intensity of competitive rivalry is the major determinant of the competitiveness of the industry.
3)Value Chain Analysis
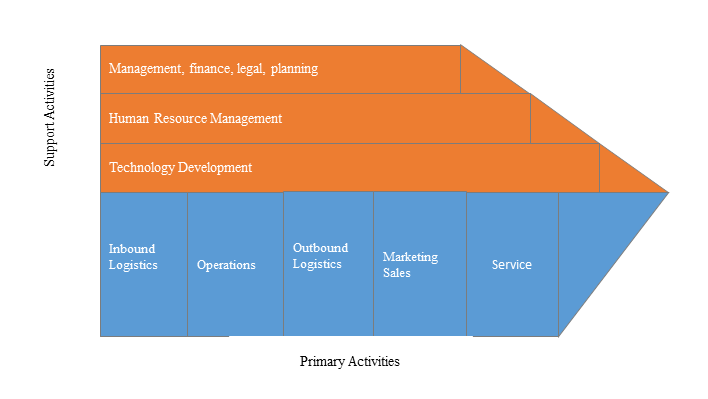
Value chain analysis is a tool to identify activities, within and around the firm and relating these activities to an assessment of competitive strength. Value chain can be analyzed by primary activities and supportive activities. Primary activities include: inbound logistics, operations, outbound logistics, marketing & sales, service. Support activities include: technology development, human resource management, management, finance, legal, planning.
4)SWOT Analysis
SWOT analysis is a tool used to evaluate a company's competitive position by identifying its strengths, weaknesses, opportunities and threats. The strengths and weakness is the inner factor; the opportunities and threats are the external factor. By analyzing the inner and external factors, the analysis can provide the detail information of the position of a player and the characteristics of the industry.
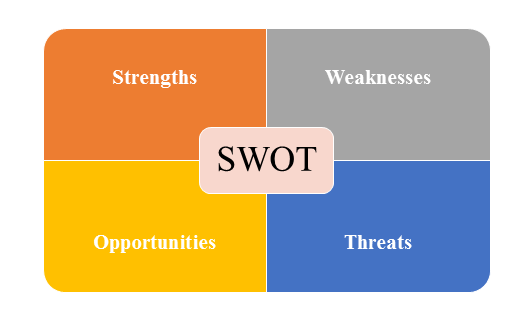
- Strengths describe what the player excels at and separates it from the competition
- Weaknesses stop the player from performing at its optimum level.
- Opportunities refer to favorable external factors that the player can use to give it a competitive advantage.
- Threats refer to factors that have the potential to harm the player.
- Data Sources
| Primary Sources | Secondary Sources |
|---|---|
| Face to face/Phone Interviews with market participants, such as: Manufactures; Distributors; End-users; Experts. Online Survey |
Government/International Organization Data: Annual Report/Presentation/Fact Book Internet Source Information Industry Association Data Free/Purchased Database Market Research Report Book/Journal/News |