Global Consumer Lithium Battery Market Report 2021-2031
- Single User License (1 Users) $ 3,500
- Team License (2~5 Users) $ 4,500
- Corporate License (>5 Users) $ 5,500
The global consumer lithium battery market size is projected to reach USD 45 billion - USD 50 billion in 2026, expanding at a compound annual growth rate (CAGR) of 2.5% to 4.5% through 2031. While legacy unit volume growth in traditional 3C hardware has matured into single-digit replacement cycles, per-device battery value is expanding rapidly due to the computational power draw of on-device generative artificial intelligence (AI), low-altitude commercial aviation, and high-drain home robotics.
PRODUCT CLASSIFICATION & FORM FACTOR ARCHITECTURE
Consumer lithium batteries are segmented into four primary physical form factors based on packaging mechanics, electrode assembly topology, and terminal geometry.
● Polymer Soft-Pack (Pouch) Lithium Batteries
- Technical Profile: Encased in multi-layer aluminum-laminated films (nylon/aluminum/cast polypropylene), polymer soft-pack cells deliver superior gravimetric energy density, ultra-thin cross-sections (<1mm to 10mm), lightweight construction, and geometric adaptability. Through precision Z-stacking and multi-tab winding processes, manufacturers produce custom L-shaped, curved, arc-shaped, pin-type, and stepped profiles that maximize internal chassis utilization in space-constrained hardware.
- Market Detail: Representing the dominant form factor in premium consumer electronics, polymer soft-pack cells command over 85% penetration in ultrabooks and flagship smartphones. Strategic audits reveal that average selling prices (ASPs) in this segment are expanding by 8% to 12% per generation due to the integration of ultra-thin stainless-steel foil laminated pouches designed to manage silicon swelling and dissipate thermal loads during 120W+ fast charging.
- Leading Suppliers: Amperex Technology Limited (ATL), CosMX Group, Sunwoda, Highpower Technology, Synergy ScienTech Corp., and Chongqing VDL Electronics.
● Prismatic Aluminum / Steel Shell Lithium Batteries
- Technical Profile: Enclosed within laser-welded rigid rectangular metallic housings fabricated from aluminum alloys or deep-drawn stainless steel, prismatic cells provide mechanical impact resistance, structural rigidity, predictable thermal dissipation pathways, and integrated pressure-relief safety vents.
- Market Detail: Historically relegated to mid-range smartphones, portable power banks, e-cigarettes, and smart door locks, prismatic and hard-shell formats are experiencing a structural renaissance. The enforcement of EU battery replaceability directives is compelling global smartphone OEMs to abandon permanent adhesive-mounted soft pouches in favor of rigid steel-shell and modular aluminum-case configurations that allow end-user removal without specialized thermal debonding tools. In FY2025, Veken Technology generated RMB 47.07 million (USD 6.55 million) in dedicated consumer aluminum-case battery revenue, underscoring niche commercial viability alongside major Tier-1 volume ramps.
- Leading Suppliers: Veken Technology, CosMX Group, EVE Energy, and Sunwoda.
● Cylindrical Consumer Lithium Batteries
- Technical Profile: Manufactured via high-speed automated spiral winding encased in nickel-plated steel cans, cylindrical cells encompass legacy 18650 (18mm by 65mm) and 21700 (21mm by 70mm) formats alongside large-format 33135 and 40130 dimensions. The most disruptive engineering shift in this category is the commercialization of full-tab (tabless) current collection architectures—exemplified by EVE Energy's 30PL and 50PL series—which reduce internal ohmic resistance by over 60%, enabling continuous high-rate pulse discharge between 30C and 50C without thermal throttling.
- Market Detail: Demand is anchored by cordless power tools, outdoor garden equipment, electric two-wheelers, robotic vacuum cleaners, commercial drones, and portable power stations. Following inventory destocking across Western hardware channels in 2023–2024, procurement rebounded sharply in 2025. Sichuan Changhong NewEnergy (Changhong Sanjie) recorded RMB 2.32 billion (USD 322.89 million) in high-rate cylindrical lithium battery revenue in FY2025, representing a 41.58% year-over-year expansion.
- Leading Suppliers: LG Energy Solution, Samsung SDI, Panasonic Energy, EVE Energy, Sichuan Changhong NewEnergy, Highpower Technology, and Guangdong Great Power Energy.
● Micro & Coin Lithium Batteries
- Technical Profile: Encompassing miniature primary and secondary electrochemical systems—including CR2032, CR123A, rechargeable ML/LSC chemistries, pin-type cells, and stacked steel-pouch micro-cells—these batteries are engineered for millimeter-scale footprints, hermetic sealing against electrolyte leakage, and high volumetric energy density.
- Market Detail: Growth is propelled by true wireless stereo (TWS) earbuds, OTC and prescription hearing aids, smart rings, continuous glucose monitors (CGM), smartwatches, and industrial IoT tags. Patent litigation barriers surrounding wound versus stacked electrode structures have largely resolved in favor of Z-stacked micro-cells and steel-shell coin architectures. Notably, industrial consolidation is reshaping primary and micro supply chains: Murata Manufacturing officially transferred its micro primary battery business to Maxell, Ltd., effective March 1, 2026, consolidating Japanese market leadership in medical and automotive-grade micro-cells.
- Leading Suppliers: Panasonic Energy, Maxell, EVE Energy, Chongqing VDL Electronics, Synergy ScienTech Corp., ZeniPower (Zhuhai Zhi Li), and Lijia Power.
DOWNSTREAM APPLICATION DEMAND & EDGE AI INFLECTION
Global demand for consumer lithium batteries is bifurcating between high-volume mature 3C replacement cycles and high-growth emerging edge terminals.
● Smartphones (Rank 1 Market by Value and Volume)
- Market Scale & Growth: Global smartphone shipments reached 1.25 billion to 1.26 billion units in 2025, reflecting a 1.9% year-over-year recovery. Despite modest unit expansion, total megawatt-hour (MWh) deployment in smartphones grew by over 9% in 2025 as average single-device battery capacities surged from 4,800 mAh toward 5,800–6,500 mAh.
- Technical Trends: On-device large language models (LLMs) and neural processing units (NPUs) require sustained peak currents. OEMs are migrating aggressively toward high-voltage Lithium Cobalt Oxide (LCO) operating at 4.5V to 4.55V, paired with silicon-carbon (Si-C) composite anodes containing over 25% elemental silicon by weight. Fast-charging protocols exceeding 120W (1C to 8C rates) and laser-welded steel-shell pouch enclosures for enhanced thermal transfer and EU compliance represent the baseline specification for 2026 flagship models.
● Laptops & Tablets (Rank 2 Market by Value and Volume)
- Market Scale & Growth: Global laptop shipments reached approximately 220 million units in 2025 (+8.0% YoY), while tablet shipments totaled 151.9 million units (+5.0% YoY), catalyzed by enterprise Windows 11 refresh cycles and the commercial rollout of AI PCs.
- Technical Trends: Local AI inference workloads increase continuous system thermal design power (TDP) and baseline power draw. Consequently, OEMs are expanding battery pack capacities from the legacy 50Wh–65Wh range toward 80Wh–100Wh (approaching the 100Wh international aviation transport ceiling). Cell architectures are transitioning toward stacked multi-tab pouch cells with ultra-thin profiles (<2.5mm), low internal impedance, and cobalt-reduced LCO/NCM blended cathodes to balance cost and volumetric density.
● Smart Wearables & AI Edge Terminals (Rank 3 Market by Value and Volume)
- Market Scale & Growth: Global wearable device shipments surpassed 200 million units in 2025 (+6.0% YoY). Personal audio and TWS devices exceeded 533 million units (+8.0% YoY), with branded TWS shipments accounting for 380 million units in 2025. The breakout growth vector for 2026–2031 is AI smart glasses and biometric smart rings.
- Technical Trends: Integrating cameras, bone-conduction audio, and wireless transceivers into eyewear temples and millimeter-thick titanium rings requires a 20% to 30% increase in volumetric energy density within sub-gram footprints. Manufacturers are deploying micro steel-shell coin cells, curved arc-shaped polymer pouches capable of 1C–8C fast charging, and semi-solid or gel-state polymer electrolytes that eliminate liquid leakage and thermal runaway risks during prolonged skin contact.
● Smart Home & Cleaning Robotics
- Market Scale & Growth: Global robotic vacuum and floor-cleaning appliance shipments reached 24.12 million units in 2025, surging 17.1% year-over-year as automated base stations with hot-water washing and high-suction motors achieved mainstream adoption.
- Technical Trends: High-suction brushless motors and onboard LiDAR navigation systems demand higher continuous discharge rates and deeper cycle longevity. The segment is executing a wholesale migration from 4S2P 18650 battery packs toward 21700 high-capacity cells, full-tab tabless cylindrical architectures (such as EVE 30PL/50PL), and Lithium Manganese Iron Phosphate (LMFP) blended chemistries that improve safety and lower pack cost per watt-hour.
● Commercial Drones & Low-Altitude Economy
- Market Scale & Growth: Driven by agricultural spraying, infrastructure inspection, and last-mile logistics, registered commercial drones in China alone surpassed 3.28 million units in 2025, logging 45.3 million flight hours (+70% YoY).
- Technical Trends: Aerial payload economics are governed strictly by gravimetric energy density and terminal voltage sag under high load. Drone battery specifications require gravimetric energy densities exceeding 300 Wh/kg (stretching to 350–400 Wh/kg in semi-solid configurations), continuous high-rate pulse discharge capabilities of 20C to 50C, and high-nickel NCM or high-voltage LCO pouch/cylindrical cells integrated with smart BMS telemetry. CosMX Group, EVE Energy, and Guangdong Great Power Energy have established strong supply positions in this vertical.
REGIONAL MARKET DYNAMICS & REGULATORY ARBITRAGE
● Asia-Pacific: Asia-Pacific functions as both the primary global manufacturing engine—accounting for over 92% of global consumer lithium cell output—and the largest end-consumption market. Major production clusters are concentrated in China's Guangdong province (Dongguan, Zhuhai, Shenzhen, Huizhou) and Fujian province (Ningde), alongside advanced materials and high-drain cell hubs in South Korea (Ochang, Cheonan), Japan (Osaka, Koriyama), and Taiwan, China (Hsinchu, Tainan).
- China+1 Reconfiguration: Prompted by geopolitical tariff hedging and China's reduction of the battery export VAT rebate from 13% to 9% in late 2024/early 2025, Tier-1 Chinese suppliers (Sunwoda, CosMX, Highpower, EVE Energy) are rapidly scaling cell and PACK assembly lines in Northern Vietnam (Bac Ninh, Hai Phong), Malaysia (Penang, Johor), and India (Noida, Tamil Nadu) to serve multinational EMS partners like Foxconn, Pegatron, and Quanta.
- Domestic Regulatory Tightening: Within China, the implementation of updated mandatory national standards GB31241 and GB47372-2026 enforces rigorous thermal abuse, overcharge, and mechanical crush testing for consumer cells and mobile power banks, accelerating the exit of non-compliant Tier-3 workshops.
● North America: North America represents the highest-margin regional market, anchored by the product architecture and procurement decisions of Apple, HP, Dell, Microsoft, Meta, Google, and Amazon.
- Policy & Sourcing Shifts: While consumer electronics batteries are less directly subsidized than electric vehicle batteries under the U.S. Inflation Reduction Act (IRA), Section 45X Advanced Manufacturing Production Credits and National Defense Authorization Act (NDAA) Foreign Entity of Concern (FEOC) procurement bans are reshaping high-end industrial, medical, and defense wearable battery supply chains. Domestic commercialization is led by Enovix Corporation (scaling 3D silicon-anode cells via U.S. R&D and Penang, Malaysia high-volume fab lines), alongside cylindrical investments by LG Energy Solution in Queen Creek, Arizona, and Panasonic Energy in North America.
● Europe: Following macroeconomic stagnation and channel destocking in 2024–2025, European demand has stabilized around premium AI laptops, hearing aids, and e-mobility. The region acts as the global regulatory vanguard through the EU Battery Regulation (Regulation EU 2023/1542).
- Design-for-Replaceability Mandate: Effective 2027, Regulation EU 2023/1542 requires all portable batteries incorporated into smartphones, tablets, and appliances sold in the European Union to be readily removable and replaceable by end-users. Combined with mandatory carbon footprint declarations, digital battery passports, and recycled cobalt/lithium thresholds, this directive is forcing global OEMs to unify global SKU designs around rigid steel-shell pouches and mechanical latching packs rather than maintaining separate EU and non-EU chassis architectures.
- PFAS Chemical Restrictions: European and global regulatory initiatives restricting Per- and Polyfluoroalkyl Substances (PFAS) are targeting traditional Polyvinylidene Fluoride (PVDF) cathode binders and separator coatings, compelling cell makers to qualify fluorine-free water-based carboxymethyl cellulose (CMC) and styrene-butadiene rubber (SBR) binder systems.
● South America: South America serves primarily as an upstream critical mineral corridor—anchored by brine lithium extraction across the Lithium Triangle (Chile, Argentina, Bolivia)—while downstream consumer battery demand is concentrated in Brazil and Argentina. Brazil's Manaus Free Trade Zone supports localized battery pack assembly (PCM/BMS integration) for smartphones and notebook computers to bypass steep Mercosur import tariffs on finished electronics, though 100% of bare electrochemical cells remain imported from APAC.
● Middle East & Africa: Demand across the Middle East and Africa (MEA) is bifurcated between high-income Gulf Cooperation Council (GCC) states—where flagship smartphone, AI wearable, and commercial drone adoption mirrors Western trajectories—and Sub-Saharan Africa, where off-grid solar home systems, portable power banks, and ruggedized entry-level smartphones drive high-volume demand for low-cost prismatic aluminum-shell and cylindrical 18650/LFP cells.
SUPPLY CHAIN, VALUE CHAIN ARCHITECTURE & B2B DISTRIBUTION CHANNELS
● Upstream Raw Materials
The upstream value chain is characterized by high technical concentration in specialty battery chemicals:
- Cathode Active Materials (CAM): High-voltage Lithium Cobalt Oxide (LCO) remains irreplaceable in flagship smartphones and ultrabooks due to its high tap density (~4.2 g/cm3) and volumetric energy output at 4.5V–4.55V. High-Nickel NCM/NCA (80%+ nickel content) dominates high-rate power tools and cylindrical laptop cells, while Lithium Iron Phosphate (LFP) and LMFP capture portable power stations and cleaning robotics. Key suppliers include BTR, Ningbo Shanshan, Hunan Yuneng, and Dynanonic.
- Anode Active Materials (AAM): Artificial and natural graphite is increasingly blended with chemical vapor deposition (CVD) Silicon-Carbon (Si-C) and Silicon Oxide (SiOx) composites. Increasing silicon loading beyond 25% elevates anode specific capacity from 360 mAh/g (graphite limit) toward 600–800 mAh/g, unlocking 20%–30% cell energy density gains for AI terminals.
- Electrolytes & Conductive Salts: Formulations utilize cyclic and linear organic carbonates—such as Ethylene Carbonate and Propylene Carbonate—doped with Lithium Hexafluorophosphate (LiPF6) and Lithium Bis(fluorosulfonyl)imide (LiFSI), alongside proprietary nitrile and fluorinated film-forming additives that passivate the cathode-electrolyte interphase (CEI) above 4.5V.
- Separators & Enclosures: Wet-process polyethylene (PE) microporous membranes (5um to 9um base thickness) coated with nano-alumina ceramics and polymeric binders prevent dendrite puncture. Packaging relies on Japanese and Chinese aluminum-laminated films (88um to 113um) or ultra-thin laser-weldable SUS304/SUS316L stainless steel foils.
● Midstream Cell Manufacturing, Pack Integration & Value Migration
Midstream fabrication encompasses two sequential stages:
- Bare Cell Production: Precision slurry dispersion -> high-speed slot-die coating -> high-pressure calendering -> laser slitting -> vacuum baking -> high-speed winding or Z-stacking -> ultrasonic/laser tab welding -> enclosure sealing -> vacuum electrolyte injection -> high-temperature formation and aging -> automated optical and electrochemical grading.
- Pack Assembly (PACK): Cell sorting and matching -> Protection Circuit Module (PCM) and smart Battery Management System (BMS) surface mount technology (SMT) -> precision structural casing and thermal pad integration -> UN/DOT 38.3, IEC 62133, and UL 1642 compliance testing.
- Value Migration Dynamics: Historically, bare cell manufacturers (such as ATL and CosMX) supplied cells to independent third-party PACK integrators (such as Sunwoda and Simplo Technology), who assembled the final battery module for OEMs. Today, a fierce vertical integration squeeze is underway: Sunwoda has backward-integrated aggressively into in-house consumer cell manufacturing (achieving over 35%–40% cell self-supply), while CosMX Group has forward-integrated into PACK assembly, raising its consumer PACK self-supply ratio to 43.42%. This convergence compresses margins for standalone, non-integrated pack assemblers.
● Downstream B2B Sales & Distribution Architecture
Commercial distribution operates across three primary channels:
- Direct-to-OEM / ODM Direct B2B Channel (Dominant Model, ~75% of Market Value): Tier-1 global hardware brands (Apple, HP, Dell, Lenovo, Samsung, Xiaomi, OPPO, vivo, DJI, Philips, Bosch) and premier EMS/ODM contractors (Foxconn, Pegatron, Quanta, Compal, Inventec) execute direct vendor qualification. This channel imposes a 12-to-24-month technical, ESG, and factory audit qualification barrier. Approved suppliers enter master framework agreements governed by 12-month rolling forecasts and quarterly raw-material price indexing. CosMX Group operates on a 100% direct B2B sales model, alongside high direct-sales ratios at Sunwoda, Highpower Technology, Chongqing VDL, and Guangdong Great Power.
- Authorized Industrial & Solution Integrator Channel (~15% of Market Value): Serves fragmented mid-sized IoT, medical device, smart lock, and commercial drone manufacturers through specialized battery solution houses that provide custom BMS firmware and small-batch pack engineering using Tier-1 cylindrical or micro cells.
- Aftermarket & Repair Distribution Channel (~10% of Market Value): Encompasses authorized OEM service networks and independent third-party repair distributors. This channel is poised for structural expansion post-2027 as EU battery replaceability mandates standardize user-swappable smartphone and laptop replacement packs.
COMPETITIVE LANDSCAPE
● Amperex Technology Limited (ATL): Headquartered in Hong Kong, China, with core manufacturing complexes in Ningde and Dongguan, ATL (a subsidiary of TDK Corporation) is the undisputed global leader in consumer polymer lithium-ion batteries, holding an estimated 30% to 35% global value share in flagship smartphones and ultrabooks. ATL's primary moat lies in its co-engineering integration with Apple, Samsung, Xiaomi, OPPO, vivo, Lenovo, Huawei, HP, and Dell. ATL is pivoting heavily into CVD silicon-carbon anodes, ultra-thin stainless-steel shell pouch batteries for iPhone and flagship Android lines, and semi-solid electrolyte systems.
● Sunwoda Electronics Co., Ltd.: Headquartered in Shenzhen, China, Sunwoda evolved from the world's largest smartphone and laptop battery PACK integrator into a vertically integrated cell-plus-PACK powerhouse. Through its subsidiary Dongguan Liwinon, Sunwoda has scaled internal polymer and steel-shell cell production for AI PCs and smartphones, driving up cell self-sufficiency to expand gross margins while scaling manufacturing hubs in Vietnam and India to insulate North American OEM supply chains.
● CosMX Group: Based in Zhuhai, China, CosMX is the global volume leader in laptop and tablet polymer lithium cells (commanding ~31% global laptop cell share) and ranks top-three globally in smartphone cells. CosMX has executed a rapid customer diversification pivot, expanding wallet share across Apple, Xiaomi, Huawei, OPPO, vivo, and achieving A+A primary supplier status for Samsung Galaxy Watch wearables. By lifting its internal consumer PACK self-supply ratio to 43.42% and constructing a major Malaysian production base, CosMX captures incremental downstream margin while de-risking export tariffs.
● Highpower Technology Co., Ltd.: Headquartered in Shenzhen with automated manufacturing centralized in Huizhou, China, and expansion in Vietnam, Highpower Technology specializes in polymer soft-pack, small cylindrical, and Ni-MH batteries. The company's strategic moat centers on high-end brand penetraton—supplying HP, Sony, DJI, and leading global smart wearable and Bluetooth audio OEMs. Highpower is capturing the AI PC upgrade cycle via high-capacity multi-tab stacked laptop pouches and miniature high-rate cells for wearable edge terminals.
● EVE Energy Co., Ltd.: Headquartered in Huizhou, China, EVE Energy ranks first domestically in small consumer cylindrical cell shipments and maintains a premier global position in lithium primary and micro-rechargeable batteries. EVE's operational moat rests on automated high-speed cylindrical lines (18650/21700) in Huizhou and Malaysia, alongside pioneering full-tab tabless high-power cells (30PL/50PL) for cordless power tools and cleaning robots, as well as steel-shell pouch cells for flagship smartwatches and AI glasses.
● Guangdong Great Power Energy & Technology Co., Ltd.: Based in Guangzhou, China, Great Power ranks among the top nine Chinese 3C lithium battery manufacturers by revenue. Its competitive advantage lies in flexible multi-format manufacturing across polymer pouch, cylindrical, and micro coin cells. Great Power has pivoted away from low-margin commodity electronics toward high-rate commercial drone batteries (>300 Wh/kg), premium TWS earbuds, e-cigarettes, and portable energy storage systems.
● Chongqing VDL Electronics Co., Ltd.: Headquartered in Chongqing, China, VDL Electronics is an engineering pioneer in Z-stacking micro-button cells, steel-pouch micro-cells, and pin-type batteries. By bypassing traditional winding patents through proprietary lamination stacking, VDL captured major market share in TWS earbuds, AI smart glasses, smart rings, and wearable medical patches across Tier-1 global smartphone ecosystems.
● Sichuan Changhong NewEnergy Technology Co., Ltd.: Operating out of Mianyang and Taixing, China, Changhong Sanjie is a dedicated specialist in high-rate 18650 and 21700 cylindrical lithium-ion cells for power tools, cleaning robotics, and garden machinery.
● Veken Technology Co., Ltd.: Based in Ningbo, China, Veken Technology ranks as a top-five domestic smartphone battery supplier and a core vendor in consumer aluminum-shell prismatic batteries, generating RMB 47.07 million (USD 6.55 million) in that specific niche in FY2025. Facing intense price competition in mid-range 3C pouches, Veken is pivoting toward commercial drones, smart home power packs, and sodium-ion starter/energy storage batteries.
● Synergy ScienTech Corp.: Based in Hsinchu, Taiwan, China, with manufacturing in Kunshan, Synergy ScienTech specializes in custom-shaped, curved, ultra-thin, and micro polymer batteries for Bluetooth headsets, hearing aids, and medical devices. The company is pivoting toward semi-solid gel-state electrolytes and replaceable battery modules compliant with European eco-design mandates.
● LG Energy Solution Ltd.: Headquartered in Seoul, South Korea, LG Energy Solution is a premier supplier of small cylindrical (18650/21700/46-series) and stepped/free-form polymer pouch cells for flagship North American smartphones, laptops, and cordless tools. LGES leverages its Arizona cylindrical complex and Nanjing/Ochang facilities to serveFEOC-compliant and premium OEM segments.
● Samsung SDI Co., Ltd.: Based in Yongin, South Korea, Samsung SDI commands a top-tier global position in high-power small cylindrical cells and flagship smartphone/wearable pouch batteries, anchoring supply for Samsung Electronics (Galaxy series, Galaxy Ring) and global power tool leaders (TTI, Bosch, Makita). Samsung SDI is advancing 21700 tabless cells and all-solid-state micro-batteries for wearables.
● Panasonic Energy Co., Ltd.: Headquartered in Osaka, Japan, Panasonic Energy is a global leader in high-reliability cylindrical cells, micro coin/pin batteries (BR/CR/ML/CG series), and primary lithium cells. Its operational moat in medical sensors, automotive key fobs, and industrial IoT is reinforced by extreme defect-free manufacturing tolerance and ultra-low self-discharge electrochemistry.
● Murata Manufacturing Co., Ltd.: Headquartered in Kyoto, Japan, Murata (which absorbed Sony's battery division in 2017) leads in high-drain cylindrical cells (VTC series) and ceramic-integrated battery technologies. In a major portfolio restructuring, Murata transferred its micro primary battery business to Maxell, Ltd., effective March 1, 2026, sharpening its internal capital allocation toward high-margin industrial cylindrical packs and multilayer ceramic electronic components.
● Enovix Corporation: Headquartered in Fremont, California, USA, with high-volume manufacturing (Fab2) in Penang, Malaysia, Enovix has commercialized a proprietary 3D cell architecture utilizing a 100% active silicon anode with an integrated mechanical stainless-steel constraint that controls silicon expansion. Enovix is targeting high-margin design wins in AI smartphones, smart glasses, AI PCs, and U.S. defense wearables.
● ZeniPower (Zhuhai Zhi Li Battery Co., Ltd.): Based in Zhuhai, China, ZeniPower is a global pioneer in zinc-air primary button cells and micro rechargeable lithium button cells. Holding a dominant market share in global hearing aid OEM supply chains, ZeniPower is transitioning customers toward high-energy-density sealed rechargeable micro-lithium cells for OTC hearing aids, continuous glucose monitors, and miniature healthcare telemetry.
OPPORTUNITIES & OPERATIONAL RISKS
.● Opportunities
- The Silicon-Carbon & Steel-Shell Arbitrage Window: The convergence of on-device AI power hunger and the 2027 EU battery replaceability mandate has created a multi-year product upgrade cycle. Cell manufacturers capable of laser-welding ultra-thin (<0.1mm) stainless-steel pouch enclosures while managing the solid-electrolyte interphase (SEI) stability of >25% silicon-carbon anodes at 4.55V are capturing 15% to 25% ASP premiums over conventional aluminum-laminated graphite pouch cells.
- Tabless Cylindrical Penetration in Consumer Robotics: Full-tab (tabless) 21700 cylindrical cells are migrating rapidly from industrial power tools into high-suction robotic vacuums, lawnmowers, and commercial delivery drones. Eliminating tab bottlenecks allows packs to charge at 5C+ and discharge at 30C–50C without bulky thermal management hardware, offering a high-margin replacement for legacy 18650 assemblies.
- Semi-Solid Electrolytes in Skin-Contact & Aerial Niches: Fully solid-state batteries remain economically unviable for mass-market smartphones prior to 2029, but semi-solid/gel-state lithium batteries (retaining 5%–10% liquid plasticizer) have achieved commercial parity in commercial drones (>300 Wh/kg) and AI wearables (smart rings and glasses), where puncture safety and weight reduction command immediate price inelasticity.
● Structural Inhibitors & Operational Risks
- Feedstock Squeeze & Margin Compression: Following the 2023–2024 cyclical trough in lithium carbonate and cobalt sulfate pricing, periodic restocking rebounds and upstream supply discipline create raw material volatility. Because Tier-1 hardware OEMs enforce strict price-indexing formulas with a one-to-two-quarter lag, midstream cell fabricators lacking automated hedging or vertical PACK integration face recurring quarterly gross margin squeezes.
- China VAT Rebate Rollback & Tariff Duplication Costs: The reduction of China's export VAT rebate from 13% to 9% (and potential elimination) directly erodes 400+ basis points of operating margin on direct cell exports. While establishing brownfield and greenfield plants in Vietnam, Malaysia, and India mitigates U.S. and European tariff exposure, operating sub-scale overseas lines initially dilutes return on invested capital (ROIC) due to reliance on imported Chinese cathode, anode, and separator precursors.
- PFAS Substitution Friction: Transitioning away from PVDF binders to comply with tightening European and North American PFAS regulations introduces adhesion and high-voltage electrochemical stability challenges at 4.5V+ cathodes, requiring 18-month re-qualification cycles with conservative OEM engineering teams.
1.1 Report Overview & Strategic Scope ... 1
1.2 Research Methodology, Primary/Secondary Data Sources & Quantitative Assumptions ... 3
1.3 Industry Nomenclature, Technical Parameters & Abbreviations ... 6
Chapter 2 Value Chain Architecture, Raw Material Bottlenecks & Manufacturing Cost Structure ... 7
2.1 Global Consumer Lithium Battery Value Chain & Margin Distribution Architecture ... 7
2.2 Upstream Critical Raw Material Supply Dynamics (Lithium Carbonate, High-Voltage LCO, Silicon-Carbon Anodes, Ultra-Thin Separators) ... 9
2.3 Cell Bill of Materials (BoM) Breakdown & Conversion Cost Modeling ... 11
2.4 Midstream Cell-to-Pack (CTP) Integration, Protection Circuit Modules (PCM) & BMS Value Capture ... 12
Chapter 3 Global Consumer Lithium Battery Market Dynamics: Capacity, Production, Consumption & Market Size (2021-2031) ... 14
3.1 Historical Baseline (2021-2025), 2026 Inflection Point & Long-Term Forecast Trajectory (2027-2031) ... 14
3.2 Global Consumer Lithium Battery Nameplate Capacity, Effective Production & Utilization Rate Analysis ... 15
3.3 Global Consumer Lithium Battery Consumption Volume & Regional Demand Shifts ... 17
3.4 Global Market Size (Revenue & Unit Shipments) & Average Selling Price (ASP) Elasticity ... 19
Chapter 4 Electrochemical Roadmap, Cell Engineering & Global Patent Landscape ... 21
4.1 Cathode & Anode Material Evolution (4.5V+ Lithium Cobalt Oxide, High-Nickel NCM, 3D Silicon-Anode Integration) ... 21
4.2 Cell Assembly Process Bottlenecks: High-Speed Winding vs. Z-Folding Lamination Stacking ... 23
4.3 Semi-Solid-State & All-Solid-State Consumer Battery Commercialization Milestones ... 24
4.4 Global Patent Filing Velocity, Core IP Clusters & Cross-Licensing Litigation Analysis ... 25
Chapter 5 Global Market Segmentation by Physical Form Factors (2021-2031) ... 27
5.1 Form Factor Engineering Trade-Offs: Volumetric Energy Density, Thermal Dissipation & Swelling Control ... 27
5.2 Polymer Soft-Pack Lithium Batteries ... 28
5.3 Prismatic Aluminum/Steel Shell Lithium Batteries ... 29
5.4 Cylindrical Consumer Lithium Batteries ... 30
5.5 Micro & Coin Lithium Batteries ... 31
Chapter 6 Downstream Application Verticals & Terminal Value Migration Analysis (2021-2031) ... 33
6.1 On-Device AI Compute Loads, Power Consumption Surge & Hardware Replacement Cycles ... 33
6.2 Smartphones ... 34
6.3 Laptops & Tablets ... 35
6.4 Smart Wearables & AI Edge Terminals ... 36
6.5 Smart Home ... 37
6.6 Commercial Drones ... 38
6.7 Procurement Channel Analysis: Tier-1 OEM Direct Sourcing vs. ODM & Aftermarket Distribution ... 39
Chapter 7 Cross-Border Trade Flows, Supply Chain Relocation & Import/Export Dynamics ... 40
7.1 Global Consumer Lithium Battery Trade Balance: Primary Exporting Hubs & Net Importing Markets ... 40
7.2 Geopolitical Supply Chain Arbitrage: Cell Manufacturing vs. Pack Assembly Geographic Decoupling ... 42
7.3 Tariff Regimes, UN 3480/3481 Hazmat Transport Compliance & Cross-Border Logistics Bottlenecks ... 43
Chapter 8 Asia-Pacific Consumer Lithium Battery Market Analysis (2021-2031) ... 45
8.1 Asia-Pacific Regional Market Overview: Capacity, Production, Consumption & Market Size ... 45
8.2 China ... 46
8.3 South Korea ... 47
8.4 Japan ... 48
8.5 India ... 49
8.6 Southeast Asia ... 49
8.7 Taiwan (China) ... 50
Chapter 9 North America Consumer Lithium Battery Market Analysis (2021-2031) ... 51
9.1 North America Regional Market Overview: Capacity, Production, Consumption & Market Size ... 51
9.2 United States ... 52
9.3 Canada ... 53
9.4 Mexico ... 54
Chapter 10 Europe Consumer Lithium Battery Market Analysis (2021-2031) ... 55
10.1 Europe Regional Market Overview: Capacity, Production, Consumption & Market Size ... 55
10.2 Germany ... 56
10.3 United Kingdom ... 57
10.4 France ... 57
10.5 Poland ... 58
10.6 Netherlands & Rest of Europe ... 59
Chapter 11 South America, Middle East & Africa Consumer Lithium Battery Market Analysis (2021-2031) ... 60
11.1 South America Regional Overview: Capacity, Production, Consumption & Market Size ... 60
11.2 Brazil ... 60
11.3 Argentina ... 61
11.4 Middle East & Africa Regional Overview: Capacity, Production, Consumption & Market Size ... 62
11.5 United Arab Emirates ... 62
11.6 Saudi Arabia ... 63
11.7 South Africa ... 63
Chapter 12 Corporate Competitive Landscape, Capacity Share & Financial Benchmarking ... 64
12.1 Global Supplier Tiering, Market Concentration Indices (CR5, CR10, HHI) & Competitive Moats ... 64
12.2 Global Corporate Capacity & Production Share Matrix (2021-2026) ... 65
12.3 Global Corporate Revenue, ASP & Gross Profit Margin Benchmarking (2021-2026) ... 66
12.4 Capital Expenditure Allocation, Capacity Expansion Pipelines & Strategic Supply Agreements ... 67
Chapter 13 Key Market Players Operational & Financial Intelligence ... 68
13.1 LG Energy Solution ... 68
13.1.1 Corporate Profile & Strategic Positioning ... 68
13.1.2 SWOT Analysis ... 69
13.1.3 Consumer Lithium Battery Operational Metrics (Capacity, Production, Utilization Rate, Price, Cost, Gross Margin, Market Share) ... 70
13.1.4 R&D Expenditure & Go-To-Market (GTM) Strategy ... 71
13.2 Samsung SDI ... 72
13.2.1 Corporate Profile & Strategic Positioning ... 72
13.2.2 SWOT Analysis ... 73
13.2.3 Consumer Lithium Battery Operational Metrics (Capacity, Production, Utilization Rate, Price, Cost, Gross Margin, Market Share) ... 74
13.2.4 R&D Expenditure & Go-To-Market (GTM) Strategy ... 75
13.3 Panasonic Energy ... 76
13.3.1 Corporate Profile & Strategic Positioning ... 76
13.3.2 SWOT Analysis ... 77
13.3.3 Consumer Lithium Battery Operational Metrics (Capacity, Production, Utilization Rate, Price, Cost, Gross Margin, Market Share) ... 78
13.3.4 R&D Expenditure & Go-To-Market (GTM) Strategy ... 79
13.4 EVE Energy ... 80
13.4.1 Corporate Profile & Strategic Positioning ... 80
13.4.2 SWOT Analysis ... 81
13.4.3 Consumer Lithium Battery Operational Metrics (Capacity, Production, Utilization Rate, Price, Cost, Gross Margin, Market Share) ... 82
13.4.4 R&D Expenditure & Go-To-Market (GTM) Strategy ... 83
13.5 Sunwoda ... 84
13.5.1 Corporate Profile & Strategic Positioning ... 84
13.5.2 SWOT Analysis ... 85
13.5.3 Consumer Lithium Battery Operational Metrics (Capacity, Production, Utilization Rate, Price, Cost, Gross Margin, Market Share) ... 86
13.5.4 R&D Expenditure & Go-To-Market (GTM) Strategy ... 87
13.6 CosMX Group ... 88
13.6.1 Corporate Profile & Strategic Positioning ... 88
13.6.2 SWOT Analysis ... 89
13.6.3 Consumer Lithium Battery Operational Metrics (Capacity, Production, Utilization Rate, Price, Cost, Gross Margin, Market Share) ... 90
13.6.4 R&D Expenditure & Go-To-Market (GTM) Strategy ... 91
13.7 Highpower Technology ... 92
13.7.1 Corporate Profile & Strategic Positioning ... 92
13.7.2 SWOT Analysis ... 93
13.7.3 Consumer Lithium Battery Operational Metrics (Capacity, Production, Utilization Rate, Price, Cost, Gross Margin, Market Share) ... 94
13.7.4 R&D Expenditure & Go-To-Market (GTM) Strategy ... 95
13.8 Guangdong Great Power Energy & Technology Co. Ltd. ... 96
13.8.1 Corporate Profile & Strategic Positioning ... 96
13.8.2 SWOT Analysis ... 97
13.8.3 Consumer Lithium Battery Operational Metrics (Capacity, Production, Utilization Rate, Price, Cost, Gross Margin, Market Share) ... 98
13.8.4 R&D Expenditure & Go-To-Market (GTM) Strategy ... 99
13.9 Amperex Technology Limited (ATL) ... 100
13.9.1 Corporate Profile & Strategic Positioning ... 100
13.9.2 SWOT Analysis ... 101
13.9.3 Consumer Lithium Battery Operational Metrics (Capacity, Production, Utilization Rate, Price, Cost, Gross Margin, Market Share) ... 102
13.9.4 R&D Expenditure & Go-To-Market (GTM) Strategy ... 103
13.10 Chongqing VDL Electronics Co. Ltd. ... 104
13.10.1 Corporate Profile & Strategic Positioning ... 104
13.10.2 SWOT Analysis ... 105
13.10.3 Consumer Lithium Battery Operational Metrics (Capacity, Production, Utilization Rate, Price, Cost, Gross Margin, Market Share) ... 106
13.10.4 R&D Expenditure & Go-To-Market (GTM) Strategy ... 107
13.11 Murata ... 108
13.11.1 Corporate Profile & Strategic Positioning ... 108
13.11.2 SWOT Analysis ... 109
13.11.3 Consumer Lithium Battery Operational Metrics (Capacity, Production, Utilization Rate, Price, Cost, Gross Margin, Market Share) ... 110
13.11.4 R&D Expenditure & Go-To-Market (GTM) Strategy ... 111
13.12 Sichuan Changhong NewEnergy Technology Co. Ltd. ... 112
13.12.1 Corporate Profile & Strategic Positioning ... 112
13.12.2 SWOT Analysis ... 113
13.12.3 Consumer Lithium Battery Operational Metrics (Capacity, Production, Utilization Rate, Price, Cost, Gross Margin, Market Share) ... 114
13.12.4 R&D Expenditure & Go-To-Market (GTM) Strategy ... 115
13.13 Veken Technology Co. Ltd. ... 116
13.13.1 Corporate Profile & Strategic Positioning ... 116
13.13.2 SWOT Analysis ... 117
13.13.3 Consumer Lithium Battery Operational Metrics (Capacity, Production, Utilization Rate, Price, Cost, Gross Margin, Market Share) ... 118
13.13.4 R&D Expenditure & Go-To-Market (GTM) Strategy ... 119
13.14 Enovix ... 120
13.14.1 Corporate Profile & Strategic Positioning ... 120
13.14.2 SWOT Analysis ... 121
13.14.3 Consumer Lithium Battery Operational Metrics (Capacity, Production, Utilization Rate, Price, Cost, Gross Margin, Market Share) ... 122
13.14.4 R&D Expenditure & Go-To-Market (GTM) Strategy ... 123
13.15 ZeniPower (Zhuhai Zhi Li) Battery Co. Ltd. ... 124
13.15.1 Corporate Profile & Strategic Positioning ... 124
13.15.2 SWOT Analysis ... 125
13.15.3 Consumer Lithium Battery Operational Metrics (Capacity, Production, Utilization Rate, Price, Cost, Gross Margin, Market Share) ... 126
13.15.4 R&D Expenditure & Go-To-Market (GTM) Strategy ... 127
13.16 Synergy ScienTech Corp. ... 128
13.16.1 Corporate Profile & Strategic Positioning ... 128
13.16.2 SWOT Analysis ... 129
13.16.3 Consumer Lithium Battery Operational Metrics (Capacity, Production, Utilization Rate, Price, Cost, Gross Margin, Market Share) ... 130
13.16.4 R&D Expenditure & Go-To-Market (GTM) Strategy ... 131
Chapter 14 Regulatory Frameworks, Circular Economy Mandates & Supply Chain Risk Mitigation ... 132
Table 2 Consumer Lithium Battery Technical Nomenclature, Standards & Abbreviations ... 6
Table 3 Upstream Raw Material Price Volatility (Lithium Carbonate, Cobalt, Graphite, Silicon-Carbon, Copper Foil) (2021-2026) ... 9
Table 4 Consumer Lithium Battery Cell Bill of Materials (BoM) Cost Breakdown by Form Factor (2026) ... 11
Table 5 Global Consumer Lithium Battery Capacity, Production, Capacity Utilization Rate & Value (2021-2031) ... 15
Table 6 Global Consumer Lithium Battery Consumption Volume (Million Units / GWh) & Market Size (USD Million) (2021-2031) ... 18
Table 7 Electrochemical Performance Comparison: High-Voltage LCO vs. NCM vs. Silicon-Carbon Anode Cells ... 22
Table 8 Global Consumer Lithium Battery Patent Filings by Top Assignees and Technology IPC Codes (2021-2026) ... 25
Table 9 Global Consumer Lithium Battery Market Size (USD Million) & Production Volume by Physical Form Factors (2021-2031) ... 27
Table 10 Global Polymer Soft-Pack Lithium Batteries Production, Consumption, ASP & Market Size (2021-2031) ... 28
Table 11 Global Prismatic Aluminum/Steel Shell Lithium Batteries Production, Consumption, ASP & Market Size (2021-2031) ... 29
Table 12 Global Cylindrical Consumer Lithium Batteries Production, Consumption, ASP & Market Size (2021-2031) ... 30
Table 13 Global Micro & Coin Lithium Batteries Production, Consumption, ASP & Market Size (2021-2031) ... 31
Table 14 Global Consumer Lithium Battery Consumption Volume & Market Revenue by Downstream Application (2021-2031) ... 33
Table 15 Global Consumer Lithium Battery Demand in Smartphones: Shipments, Battery Capacity per Device & Market Size (2021-2031) ... 34
Table 16 Global Consumer Lithium Battery Demand in Laptops & Tablets: Shipments & Market Size (2021-2031) ... 35
Table 17 Global Consumer Lithium Battery Demand in Smart Wearables & AI Edge Terminals: Shipments & Market Size (2021-2031) ... 36
Table 18 Global Consumer Lithium Battery Demand in Smart Home Devices: Shipments & Market Size (2021-2031) ... 37
Table 19 Global Consumer Lithium Battery Demand in Commercial Drones: Shipments & Market Size (2021-2031) ... 38
Table 20 Global Consumer Lithium Battery Import & Export Volume and Value by Key Countries (2021-2026) ... 41
Table 21 Cross-Border Tariff Rates & Regulatory Compliance Costs for Consumer Lithium Batteries Across Major Trade Blocs (2026) ... 43
Table 22 Asia-Pacific Consumer Lithium Battery Capacity, Production, Consumption & Market Size by Country (2021-2031) ... 45
Table 23 North America Consumer Lithium Battery Capacity, Production, Consumption & Market Size by Country (2021-2031) ... 51
Table 24 Europe Consumer Lithium Battery Capacity, Production, Consumption & Market Size by Country (2021-2031) ... 55
Table 25 South America Consumer Lithium Battery Capacity, Production, Consumption & Market Size by Country (2021-2031) ... 60
Table 26 Middle East & Africa Consumer Lithium Battery Capacity, Production, Consumption & Market Size by Country (2021-2031) ... 62
Table 27 Global Top 16 Manufacturers Consumer Lithium Battery Capacity & Production Volume Ranking (2021-2026) ... 65
Table 28 Global Top 16 Manufacturers Consumer Lithium Battery Revenue (USD Million) & Gross Margin Comparison (2021-2026) ... 66
Table 29 LG Energy Solution Consumer Lithium Battery Capacity, Production, Price, Cost and Gross Profit Margin (2021-2026) ... 70
Table 30 Samsung SDI Consumer Lithium Battery Capacity, Production, Price, Cost and Gross Profit Margin (2021-2026) ... 74
Table 31 Panasonic Energy Consumer Lithium Battery Capacity, Production, Price, Cost and Gross Profit Margin (2021-2026) ... 78
Table 32 EVE Energy Consumer Lithium Battery Capacity, Production, Price, Cost and Gross Profit Margin (2021-2026) ... 82
Table 33 Sunwoda Consumer Lithium Battery Capacity, Production, Price, Cost and Gross Profit Margin (2021-2026) ... 86
Table 34 CosMX Group Consumer Lithium Battery Capacity, Production, Price, Cost and Gross Profit Margin (2021-2026) ... 90
Table 35 Highpower Technology Consumer Lithium Battery Capacity, Production, Price, Cost and Gross Profit Margin (2021-2026) ... 94
Table 36 Guangdong Great Power Energy & Technology Co. Ltd. Consumer Lithium Battery Capacity, Production, Price, Cost and Gross Profit Margin (2021-2026) ... 98
Table 37 Amperex Technology Limited (ATL) Consumer Lithium Battery Capacity, Production, Price, Cost and Gross Profit Margin (2021-2026) ... 102
Table 38 Chongqing VDL Electronics Co. Ltd. Consumer Lithium Battery Capacity, Production, Price, Cost and Gross Profit Margin (2021-2026) ... 106
Table 39 Murata Consumer Lithium Battery Capacity, Production, Price, Cost and Gross Profit Margin (2021-2026) ... 110
Table 40 Sichuan Changhong NewEnergy Technology Co. Ltd. Consumer Lithium Battery Capacity, Production, Price, Cost and Gross Profit Margin (2021-2026) ... 114
Table 41 Veken Technology Co. Ltd. Consumer Lithium Battery Capacity, Production, Price, Cost and Gross Profit Margin (2021-2026) ... 118
Table 42 Enovix Consumer Lithium Battery Capacity, Production, Price, Cost and Gross Profit Margin (2021-2026) ... 122
Table 43 ZeniPower (Zhuhai Zhi Li) Battery Co. Ltd. Consumer Lithium Battery Capacity, Production, Price, Cost and Gross Profit Margin (2021-2026) ... 126
Table 44 Synergy ScienTech Corp. Consumer Lithium Battery Capacity, Production, Price, Cost and Gross Profit Margin (2021-2026) ... 130
Table 45 EU Battery Regulation Compliance Timeline & Mandatory Recycled Material Targets (2026-2031) ... 134
Figure 1 Consumer Lithium Battery Market Research Execution Framework & Bottom-Up Validation Flow ... 3
Figure 2 Global Consumer Lithium Battery Value Chain Architecture & Profit Pool Distribution (2026) ... 8
Figure 3 Cell Manufacturing Cost Breakdown: Raw Materials, Depreciation, Labor & Energy (2026) ... 12
Figure 4 Global Consumer Lithium Battery Capacity, Production Volume & Utilization Rate Trajectory (2021-2031) ... 16
Figure 5 Global Consumer Lithium Battery Market Size (USD Million) & Average Selling Price (USD/Wh) Trend (2021-2031) ... 19
Figure 6 Volumetric Energy Density (Wh/L) Progression by Silicon-Carbon Doping Ratio (2021-2031) ... 22
Figure 7 Manufacturing Yield & Speed Comparison: Winding vs. Z-Folding Lamination Processes ... 23
Figure 8 Global Consumer Lithium Battery Revenue Share by Physical Form Factors (2021-2031) ... 28
Figure 9 Global Consumer Lithium Battery Consumption Share by Downstream Application Verticals (2021-2031) ... 34
Figure 10 Global Consumer Lithium Battery Cross-Border Trade Flow Map: Cell Exports vs. Pack Imports (2026) ... 40
Figure 11 Asia-Pacific Consumer Lithium Battery Market Size & Consumption Share by Country (2021-2031) ... 46
Figure 12 North America Consumer Lithium Battery Market Size & Consumption Share by Country (2021-2031) ... 52
Figure 13 Europe Consumer Lithium Battery Market Size & Consumption Share by Country (2021-2031) ... 56
Figure 14 South America, Middle East & Africa Consumer Lithium Battery Market Size Trajectory (2021-2031) ... 61
Figure 15 Global Consumer Lithium Battery Market Concentration (CR5, CR10) & Competitive Positioning Matrix (2026) ... 64
Figure 16 LG Energy Solution Consumer Lithium Battery Market Share (2021-2026) ... 70
Figure 17 Samsung SDI Consumer Lithium Battery Market Share (2021-2026) ... 74
Figure 18 Panasonic Energy Consumer Lithium Battery Market Share (2021-2026) ... 78
Figure 19 EVE Energy Consumer Lithium Battery Market Share (2021-2026) ... 82
Figure 20 Sunwoda Consumer Lithium Battery Market Share (2021-2026) ... 86
Figure 21 CosMX Group Consumer Lithium Battery Market Share (2021-2026) ... 90
Figure 22 Highpower Technology Consumer Lithium Battery Market Share (2021-2026) ... 94
Figure 23 Guangdong Great Power Energy & Technology Co. Ltd. Consumer Lithium Battery Market Share (2021-2026) ... 98
Figure 24 Amperex Technology Limited (ATL) Consumer Lithium Battery Market Share (2021-2026) ... 102
Figure 25 Chongqing VDL Electronics Co. Ltd. Consumer Lithium Battery Market Share (2021-2026) ... 106
Figure 26 Murata Consumer Lithium Battery Market Share (2021-2026) ... 110
Figure 27 Sichuan Changhong NewEnergy Technology Co. Ltd. Consumer Lithium Battery Market Share (2021-2026) ... 114
Figure 28 Veken Technology Co. Ltd. Consumer Lithium Battery Market Share (2021-2026) ... 118
Figure 29 Enovix Consumer Lithium Battery Market Share (2021-2026) ... 122
Figure 30 ZeniPower (Zhuhai Zhi Li) Battery Co. Ltd. Consumer Lithium Battery Market Share (2021-2026) ... 126
Figure 31 Synergy ScienTech Corp. Consumer Lithium Battery Market Share (2021-2026) ... 130
Figure 32 Closed-Loop Hydrometallurgical Battery Recycling Value Chain & Metal Recovery Efficiency ... 134
Research Methodology
- Market Estimated Methodology:
Bottom-up & top-down approach, supply & demand approach are the most important method which is used by HDIN Research to estimate the market size.
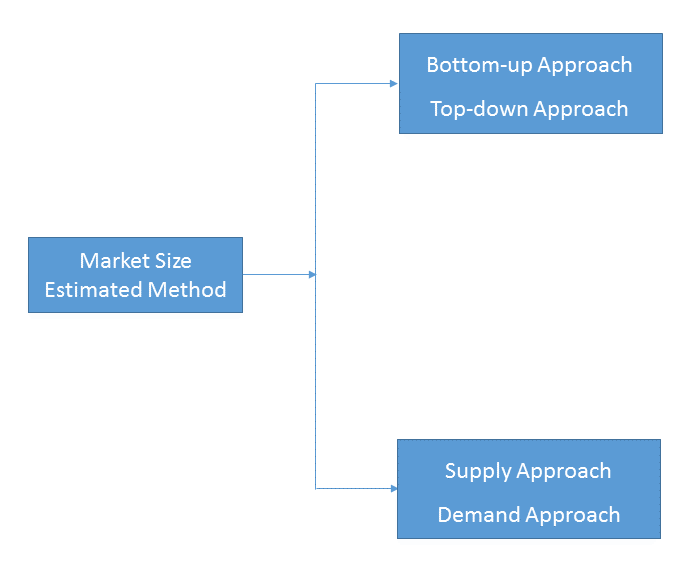
1)Top-down & Bottom-up Approach
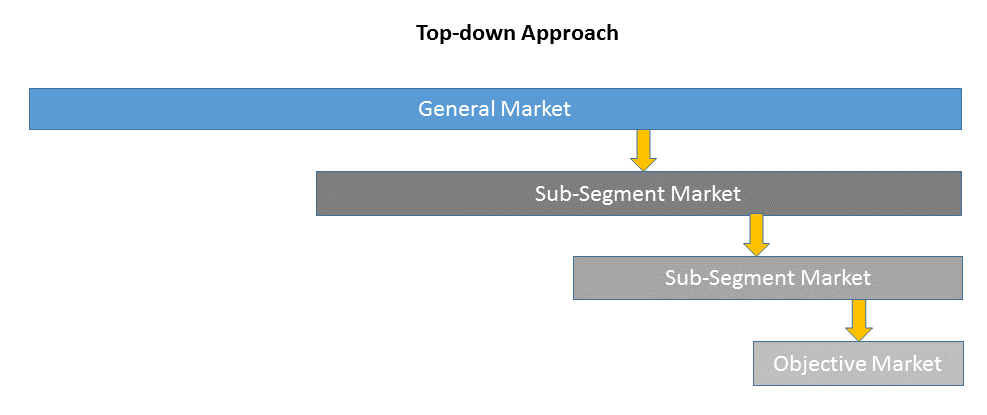
Top-down approach uses a general market size figure and determines the percentage that the objective market represents.
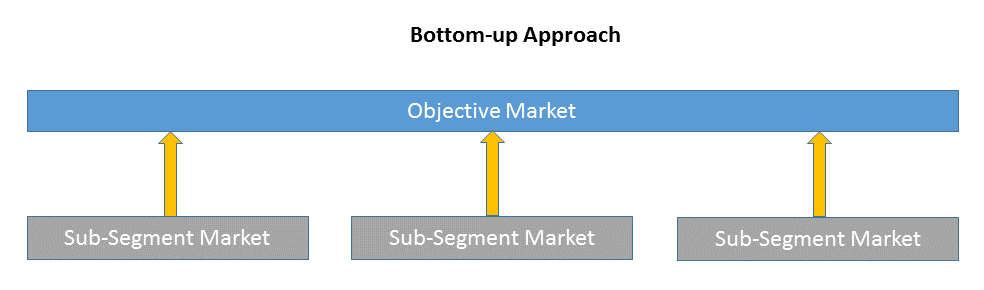
Bottom-up approach size the objective market by collecting the sub-segment information.
2)Supply & Demand Approach
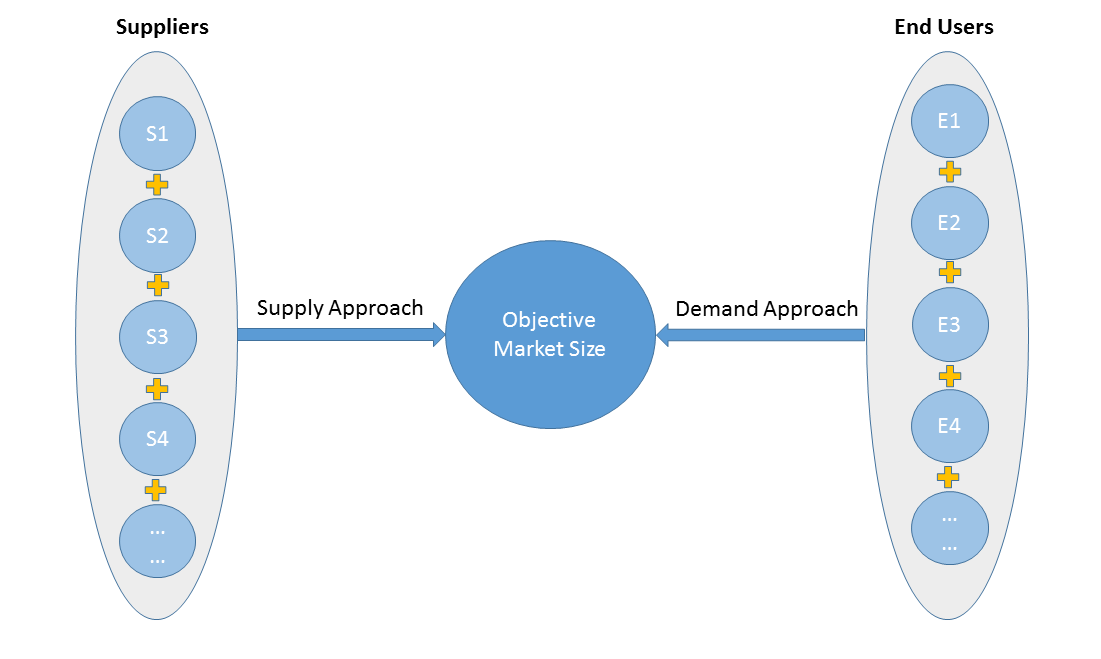
Supply approach is based on assessments of the size of each competitor supplying the objective market.
Demand approach combine end-user data within a market to estimate the objective market size. It is sometimes referred to as bottom-up approach.
- Forecasting Methodology
- Numerous factors impacting the market trend are considered for forecast model:
- New technology and application in the future;
- New project planned/under contraction;
- Global and regional underlying economic growth;
- Threatens of substitute products;
- Industry expert opinion;
- Policy and Society implication.
- Analysis Tools
1)PEST Analysis
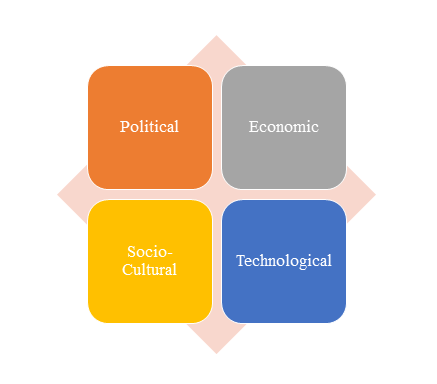
PEST Analysis is a simple and widely used tool that helps our client analyze the Political, Economic, Socio-Cultural, and Technological changes in their business environment.
- Benefits of a PEST analysis:
- It helps you to spot business opportunities, and it gives you advanced warning of significant threats.
- It reveals the direction of change within your business environment. This helps you shape what you’re doing, so that you work with change, rather than against it.
- It helps you avoid starting projects that are likely to fail, for reasons beyond your control.
- It can help you break free of unconscious assumptions when you enter a new country, region, or market; because it helps you develop an objective view of this new environment.
2)Porter’s Five Force Model Analysis
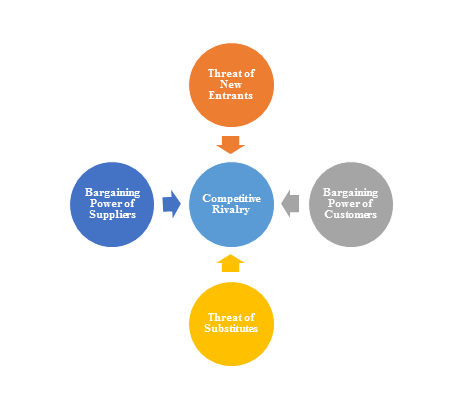
The Porter’s Five Force Model is a tool that can be used to analyze the opportunities and overall competitive advantage. The five forces that can assist in determining the competitive intensity and potential attractiveness within a specific area.
- Threat of New Entrants: Profitable industries that yield high returns will attract new firms.
- Threat of Substitutes: A substitute product uses a different technology to try to solve the same economic need.
- Bargaining Power of Customers: the ability of customers to put the firm under pressure, which also affects the customer's sensitivity to price changes.
- Bargaining Power of Suppliers: Suppliers of raw materials, components, labor, and services (such as expertise) to the firm can be a source of power over the firm when there are few substitutes.
- Competitive Rivalry: For most industries the intensity of competitive rivalry is the major determinant of the competitiveness of the industry.
3)Value Chain Analysis
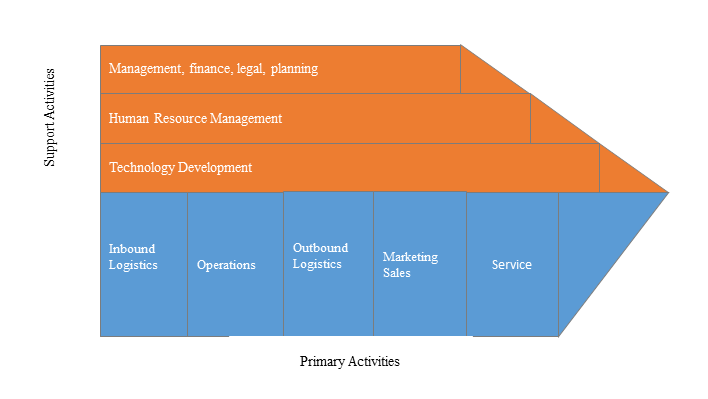
Value chain analysis is a tool to identify activities, within and around the firm and relating these activities to an assessment of competitive strength. Value chain can be analyzed by primary activities and supportive activities. Primary activities include: inbound logistics, operations, outbound logistics, marketing & sales, service. Support activities include: technology development, human resource management, management, finance, legal, planning.
4)SWOT Analysis
SWOT analysis is a tool used to evaluate a company's competitive position by identifying its strengths, weaknesses, opportunities and threats. The strengths and weakness is the inner factor; the opportunities and threats are the external factor. By analyzing the inner and external factors, the analysis can provide the detail information of the position of a player and the characteristics of the industry.
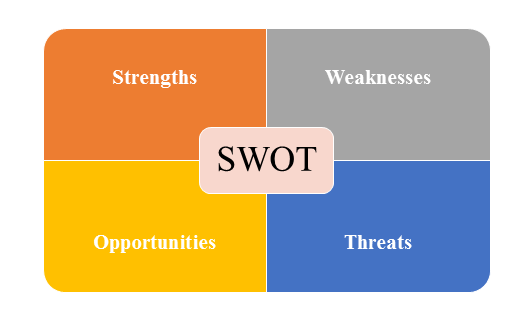
- Strengths describe what the player excels at and separates it from the competition
- Weaknesses stop the player from performing at its optimum level.
- Opportunities refer to favorable external factors that the player can use to give it a competitive advantage.
- Threats refer to factors that have the potential to harm the player.
- Data Sources
| Primary Sources | Secondary Sources |
|---|---|
| Face to face/Phone Interviews with market participants, such as: Manufactures; Distributors; End-users; Experts. Online Survey |
Government/International Organization Data: Annual Report/Presentation/Fact Book Internet Source Information Industry Association Data Free/Purchased Database Market Research Report Book/Journal/News |