Global Alkaline Battery Market Strategic Outlook 2021-2031
- Single User License (1 Users) $ 3,500
- Team License (2~5 Users) $ 4,500
- Corporate License (>5 Users) $ 5,500
The global primary alkaline battery market size is valued at an estimated 5.1 billion to 6.1 billion USD in 2026 with a steady compound annual growth rate (CAGR) of 1.8% to 2.8% through 2031. While volume growth in mature Western economies remains tethered to macroeconomic replacement cycles, market expansion is propelled by high-drain smart home device proliferation and structural chemistry substitution in developing economies.
China currently serves as the world's indisputable production anchor, manufacturing over 20 billion primary alkaline cells annually and exporting 16.425 billion units valued at 1.358 billion USD in 2025. However, China's Ministry of Finance initiated a phased elimination of the Value-Added Tax (VAT) export rebate for battery products—reducing the rebate from 13% to 9% in December 2024, stepping down to 6% in April 2026, and executing complete cancellation on January 1, 2027. This policy shock effectively inflates baseline Free-on-Board (FOB) export costs for China-based Original Design and Original Equipment Manufacturers (ODM/OEM) by roughly 13%. Consequently, pure-play Chinese contract manufacturers (such as Zhejiang Mustang, Zhejiang Hengwei, and Guangdong Liwang) face acute margin compression when servicing North American and European private-label retail giants (Walmart, Costco, Amazon, Carrefour). Conversely, multinational Own Brand Manufacturers (OBMs) and Asian conglomerates with diversified ASEAN or South Asian footprints—such as GP Industries in Vietnam, Eveready Industries in India, and Energizer Holdings in Belgium—are exploiting this regulatory arbitrage window to capture regional market share and insulate bill-of-materials (BOM) economics from tariff and tax volatility.
ELECTROCHEMICAL ARCHITECTURE, PRODUCT CLASSIFICATION & MARKET SEGMENTATION
● Electrochemical Foundations and Physical Engineering
An alkaline battery operates via irreversible electrochemical reduction-oxidation (redox) reactions between a manganese dioxide cathode and a zinc anode within an alkaline electrolyte medium.
- Cathode Architecture: Constructed from high-purity Electrolytic Manganese Dioxide (EMD) blended with conductive synthetic or natural graphite powder and polymeric binders, compressed into hollow cylindrical rings pressed tightly against the inner nickel-plated steel can wall.
- Anode Composition: Utilizes high-activity, corrosion-inhibited zinc alloy powder modified with trace indium and bismuth to suppress hydrogen gassing, suspended within a polyacrylic acid gelling agent around a brass current collector needle.
- Electrolyte Medium: A concentrated aqueous solution of Potassium Hydroxide (KOH, typically 30% to 40% by weight), which provides superior ionic conductivity and minimizes internal resistance compared to the acidic ammonium chloride or zinc chloride pastes used in legacy Leclanche (carbon-zinc) cells.
This specific stoichiometry allows commercial alkaline cells to deliver 3 to 8 times (and consistently 5 to 7 times under continuous high-current loads) the electrical capacity of comparably sized carbon-zinc cells. Alkaline chemistry maintains a flatter discharge voltage curve, operates reliably across wider ambient temperature envelopes (-20 degrees Celsius to +50 degrees Celsius), and achieves an ambient shelf life of up to 10 years with annual self-discharge rates restricted below 1% to 2%. Modern formulations are 100% free of mercury, cadmium, and lead, utilizing nylon or polypropylene anti-leakage grommets and explosion-proof safety vents that allow standard municipal solid waste disposal in most jurisdictions.
● Product Form Factor Classification
- Cylindrical Alkaline Batteries: Account for over 85% of global market revenue and unit volume. Standardized international designations under IEC and ANSI frameworks include LR03 (AAA), LR6 (AA), LR14 (C), LR20 (D), and 6LR61 (9V prismatic block), alongside high-voltage stacked miniature cylindrical formats such as 23A (12V) and 27A (12V) used in RF access controls. Because external cell dimensions are strictly fixed by international standards, top-tier manufacturers compete on internal volumetric expansion. By utilizing ultra-thin, high-tensile cold-rolled nickel-plated steel casings—exemplified by Nanfu Battery's 0.158 mm steel shell in its 5th-Generation Polyring architecture—and low-profile sealing gaskets, leading producers pack up to 15% more active EMD and zinc gel into a standard LR6 footprint.
- Button and Coin Alkaline Batteries: Represent less than 15% of unit volume but command substantially higher gross margins per gram of active material. Standardized under the AG and LR nomenclature (predominantly AG13/LR44, LR41, and LR1130), these micro-cells power compact medical diagnostics, automotive key fobs, calculators, and miniature novelty electronics. While facing competitive overlap from 3V lithium manganese dioxide (CR series) coin cells, alkaline button cells retain a decisive cost-per-unit advantage in low-voltage (1.5V) micro-electronic circuits.
● Downstream Application Segmentation
- Low-Drain Household Electronics: Encompasses infrared television remotes, quartz wall clocks, basic smoke alarms, digital kitchen scales, and portable AM/FM radios. These circuits draw intermittent micro-ampere or low milli-ampere currents over multi-year timelines. Although historically the bastion of cheap carbon-zinc cells, consumer intolerance for potassium or zinc chloride electrolyte leakage inside household hardware has driven steady migration toward leak-proof 10-year shelf-life alkaline cells.
- High-Drain and Smart Connected Devices: The primary engine of value growth across consumer channels. Includes motorized children's toys, wireless gaming controllers, high-lumen LED tactical flashlights, wireless computer peripherals, automatic soap dispensers, electronic toothbrushes, and smart biometric door locks. Smart door locks and connected home thermohygrometers require high pulse currents during Wi-Fi, Bluetooth, or Zigbee transmission bursts; carbon-zinc cells suffer immediate voltage sag under such loads, making low-internal-resistance alkaline cells mandatory to prevent premature low-battery shutdowns.
- Specialized Industrial and Niche Applications: Includes automated utility smart meters (gas and water), active RFID asset tracking tags, automated external defibrillators (AEDs), portable patient monitoring telemetry, emergency locator beacons, and tactical military radio gear. Procurement in this tier is governed by zero-defect quality audits, extreme thermal stability, and batch-to-batch discharge predictability rather than retail promotional pricing.
● Commercial Operating Models
- ODM/OEM Contract Manufacturing Model: Prevalent among export-focused Chinese manufacturers (Zhejiang Mustang, Zhejiang Hengwei, Guangdong Liwang, Sichuan Changhong). Producers manufacture cells tailored to the discharge profiles, label artwork, and blister packaging requirements of overseas private-label retailers (Walmart, Costco Kirkland Signature, Amazon Basics, Carrefour, 7-Eleven) or multinational brand owners seeking overflow capacity. Operating margins are thin (typically 8% to 14% net), relying on massive asset turnover and high-speed lines running at 600+ cells per minute to absorb fixed overhead.
- Own Brand Manufacturer (OBM) Model: Executed by global and regional consumer giants (Duracell, Energizer, Nanfu, Panasonic, GP Industries, VARTA, Eveready India, Indo National, SM BEXEL). Integrates proprietary electrochemical R&D, in-house automated assembly, high-spend consumer brand equity marketing, and direct omnichannel retail distribution. OBM operators capture gross margins ranging from 40% to 55%, leveraging shelf-space dominance and tiered product architectures (e.g., standard vs. ultra-high-capacity lines).
- Industrial OEM Matching (B2B Model): Direct factory-to-factory supply of unbranded or co-branded cells bundled inside the original packaging of new electronic hardware (remote controls, smart locks, medical glucometers, toys) or sold in bulk industrial trays to institutional buyers (hospitals, hospitality chains, defense ministries). Characterized by 12-to-24-month technical qualification cycles, ISO 13485 (medical) or military specification compliance, and multi-year fixed-volume supply contracts.
REGIONAL MARKET DYNAMICS & GEOPOLITICAL TRADE CORRIDORS
● North America (United States, Canada, Mexico)
North America represents the highest-value regional market globally, characterized by an alkalinization rate of approximately 80% of total dry cell consumption. Market revenue is heavily consolidated around big-box mass merchandisers, warehouse clubs, and e-commerce platforms. A defining structural tension in North America is the shelf-space battle between premium OBM duopolists (Duracell and Energizer) and private-label house brands (Amazon Basics, Kirkland, Member's Mark). While consumer retail demand for standard AA/AAA cells tracks population growth and hurricane/winter storm preparedness stockpiling, the B2B industrial and medical device sectors are registering rapid expansion. Furthermore, U.S. Section 301 tariffs and the impending cancellation of China's VAT export rebate have prompted North American retail buyers to diversify procurement toward Southeast Asian manufacturing hubs and Mexican packaging/distribution corridors.
● Asia-Pacific
Asia-Pacific functions simultaneously as the global workshop for primary batteries and its fastest-growing consumption frontier.
- China: Output exceeds 20 billion alkaline units annually, with 16.425 billion units exported in 2025 generating 1.358 billion USD in foreign exchange. Domestically, China's alkaline penetration rate sits between 52% and 60%, offering substantial structural upside as it converges toward the 80% developed-market benchmark. Domestic policy exempts mercury-free alkaline cells from the 4% national battery consumption tax, while the Ministry of Industry and Information Technology (MIIT) "Steady Growth Plan for Light Industry (2025-2026)" supports automated line upgrades. Anhui Anfu Battery Technology's subsidiary, Fujian Nanping Nanfu Battery Co., Ltd., commands an extraordinary domestic retail moat, holding the No. 1 sales position for 33 consecutive years through 2025 via direct coverage of over 1 million retail touchpoints.
- India: Represents the premier volume-upgrading opportunity globally. Legacy carbon-zinc chemistry still accounts for roughly 90% of unit volume in India, leaving alkaline at just 10%. Rapid urbanization, rising disposable incomes, and the proliferation of household electronics are catalyzing an inflection point. The Indian government's implementation of mandatory Bureau of Indian Standards (BIS) Quality Control Orders for dry cell batteries has erected a formidable non-tariff barrier against cheap, uncertified Chinese imports. This regulatory moat directly benefits organized domestic leaders—specifically Eveready Industries India Ltd. (which commissioned a 200 Crore INR / 22.95 million USD greenfield alkaline plant in Jammu with a capacity of 456 million units per annum) and Indo National Limited (Nippo).
- Vietnam and Southeast Asia: Vietnam has solidified its status as the primary "China Plus One" manufacturing node. GP Industries operates a flagship manufacturing complex in Ho Chi Minh City running at its full annual capacity of 1 billion alkaline cells, providing tariff-advantaged export routing to North America.
- Japan, Republic of Korea, and Taiwan, China: Highly mature, technology-dense markets with alkaline penetration exceeding 80%. Japan (anchored by Panasonic and FDK) and the Republic of Korea (led by SM BEXEL and retail private labels) focus on ultra-high-capacity premium cylindrical cells (e.g., Panasonic EVOLTA NEO), disaster-preparedness long-life stocks, and precision micro-button cells. Taiwan, China serves as a high-income consumer market and an important electronic OEM procurement hub where industrial battery matching is integrated into computer peripheral and smart hardware assembly.
● Europe
Western European markets—led by Germany, the United Kingdom, France, and the Benelux nations—exhibit alkaline penetration rates above 80%, alongside the world's highest penetration of discount grocery private labels (Aldi, Lidl, Tesco, Carrefour). Persistent post-energy-crisis inflation has suppressed consumer discretionary spending, accelerating value migration from branded OBMs to discount private-label packs. To defend European margins and shorten supply chains, Energizer Holdings acquired localized manufacturing assets in Belgium from Advanced Power Solutions (APS Belgium and APS NV), while Germany's VARTA AG leverages its automated domestic production in Dischingen as a "Made in Germany" quality differentiator. Regulatory compliance is the primary operational hurdle: the EU Battery Regulation (EU 2023/1542) enforces strict lifecycle carbon footprint declarations, ethical raw material due diligence, Extended Producer Responsibility (EPR) collection targets, digital product passports, and looming restrictions on per- and polyfluoroalkyl substances (PFAS) used in certain hydrophobic gasket coatings and cathode binders.
● South America
South America operates as a bifurcated market. Rural and lower-income urban demographics remain heavily reliant on low-cost carbon-zinc batteries for portable radios and basic flashlights due to acute price sensitivity. Conversely, metropolitan corridors in Brazil, Argentina, Chile, and Colombia demonstrate steady uptake of primary alkaline cells, driven by residential smart metering, automotive security fobs, and gaming accessories. Energizer commands a dominant footprint across Latin America through its ownership of the Rayovac brand and regional licensing of the Varta trademark, while Duracell maintains strong modern-trade visibility. Sovereign currency devaluations and hyperinflationary cycles in Argentina require multinational operators to execute aggressive local price indexing and strict working capital controls.
● Middle East and Africa (MEA)
The MEA region offers long-term demographic and infrastructural tailwinds. Across Sub-Saharan Africa, off-grid lighting, portable radios, and basic household utilities generate massive baseline dry cell volume. While carbon-zinc dominates current unit share, rapid mobile telecom penetration, solar-hybrid home setups, and urban retail formalization are steadily expanding alkaline demand. Guangzhou Tiger Head Battery Group enjoys legendary brand equity across African wholesale networks via its Tiger Head and 555 brands. In the Gulf Cooperation Council (GCC) states—specifically the United Arab Emirates and Saudi Arabia—state-backed mega-projects, commercial building automation, hospitality expansion, and smart utility metering are driving high-margin institutional procurement of cylindrical and specialty coin alkaline cells.
SUPPLY CHAIN & VALUE CHAIN ARCHITECTURE
● Upstream Feedstock Squeeze and Cost Composition
Internal modeling suggests that raw material procurement constitutes 50% to 60% of the total Cost of Goods Sold (COGS) in primary alkaline battery manufacturing. Consequently, gross margins are acutely sensitive to London Metal Exchange (LME) and Shanghai Futures Exchange (SHFE) commodity cycles.
- Electrolytic Manganese Dioxide (EMD): High-drain alkaline performance requires battery-grade EMD with specific surface area, pore volume, and gamma-phase crystal structure. Global battery-grade EMD refining capacity is heavily concentrated in China (Guangxi and Hunan provinces), exposing non-Chinese cell assemblers to feedstock bottlenecks and export shipping surcharges.
- Special High Grade (SHG) Zinc and Indium Alloying: Battery-grade zinc powder requires extreme purity (99.995%+) to prevent trace iron, antimony, or arsenic impurities from triggering parasitic self-discharge and internal hydrogen gas buildup (which causes cell leakage). Volatility in global zinc smelting treatment charges and energy costs directly alters anode paste economics.
- Structural Hardware and Electrolytes: Cold-rolled, nickel-plated steel strip (used for deep-drawn battery cans), brass wire for current collector nails, non-woven polyvinyl alcohol/vinylon-rayon separator paper, nylon-66 injection-molded sealing grommets, and high-purity potassium hydroxide flakes form the remainder of the BOM. Upward price swings in nickel, copper, and petrochemical feedstocks rapidly erode contract manufacturing margins when OEM pricing is locked into annual retail supply agreements.
● Midstream Manufacturing Bottlenecks and Automation Moats
The midstream transformation of chemical powders into sealed electrochemical cells is a capital-intensive process governed by precision mechanical engineering. The production sequence encompasses: (1) EMD and graphite homogenizing, granulation, and hydraulic ring molding; (2) steel can degreasing and inner conductive carbon coating; (3) cathode ring insertion and secondary compaction; (4) non-woven separator tube winding and insertion; (5) precision KOH electrolyte dosing; (6) anode zinc gel injection; (7) brass collector nail assembly insertion and mechanical crimping/sealing; (8) thermal aging to detect micro-short circuits; (9) open-circuit voltage (OCV) and closed-circuit voltage (CCV) automated optical and electrical testing; and (10) high-speed shrink-sleeving and blister packaging.
A critical operational moat separates Tier-1 manufacturers from lower-tier assemblers: line speed and Manufacturing Execution System (MES) integration. Legacy assembly lines operate at 200 to 300 cells per minute (cpm). In contrast, industry leaders (Nanfu, Duracell, Panasonic, GP, Zhejiang Mustang) deploy proprietary rotary continuous-motion assembly lines running above 600 cpm, integrated with inline X-ray inspection, laser weight verification, and automated vision systems. This automation compresses direct labor to less than 5% of COGS and reduces defect rates below 1 to 2 parts per million (ppm), a mandatory threshold for B2B OEM hardware bundlers and Western retail chains that impose severe financial penalties for shelf leakage incidents.
● Downstream Value Migration and Channel Arbitrage
Downstream value distribution is undergoing a three-way structural shift:
- Private-Label Margin Compression in Traditional Brick-and-Mortar: Large Western grocers and warehouse clubs increasingly treat AA/AAA alkaline multi-packs as traffic-driving commodities, allocating eye-level shelf space to their own private-label brands sourced via Chinese or ASEAN ODM tenders. This squeezes Tier-2 branded players out of physical retail entirely.
- Quick-Commerce (Q-Commerce) Impulse Monetization: In densely populated urban centers across China, India, Europe, and North America, on-demand 30-minute delivery platforms (Meituan Instashopping, Blinkit, Zepto, Uber Eats grocery, Gorillas/Getir) have emerged as high-margin growth channels. Because consumer battery replacement is frequently an urgent, event-driven need (e.g., a dead smart door lock, television remote, or medical thermometer), consumers exhibit near-zero price elasticity on Q-commerce apps, enabling dominant OBM brands to capture full suggested retail price without paying slotting fees to traditional hypermarkets.
- B2B OEM Bundling and Institutional Direct Sales: To bypass retail gatekeepers, manufacturers are aggressively expanding direct B2B sales to smart home device makers, medical equipment OEMs, and municipal utilities. While unit pricing in B2B bulk trays is lower than retail blister packs, the elimination of consumer packaging, marketing spend, and retail distributor margins yields highly attractive operating profit stability.
COMPETITIVE LANDSCAPE & COMPANY DOSSIERS
● Global & Regional OBM Powerhouses
- Energizer Holdings, Inc.: Commands the world's broadest multi-tiered brand portfolio—comprising Energizer, Eveready, Rayovac, and licensed rights to Varta in Latin America and Asia-Pacific—allowing it to cover premium, mid-tier, and value price points simultaneously across more than 140 countries. Executing supply chain regionalization and margin restoration ("Project Momentum"). By acquiring battery manufacturing assets in Belgium from Advanced Power Solutions (APS Belgium and APS NV), Energizer localized European production to mitigate transatlantic freight volatility and Chinese export tax exposure, while aggressively expanding distribution in high-margin specialty coin cells.
- Duracell Inc: Global retail revenue leader anchored by unmatched consumer brand equity (the iconic Coppertop visual identity), superior cathode density engineering (Duracell Optimum with proprietary cathode system enhancements), and deep balance-sheet backing under Berkshire Hathaway. Aggressively bifurcating its commercial strategy between premium consumer retail upgrades and institutional B2B expansion via its dedicated Procell division. Procell engineers application-specific discharge Chemistries (Procell Intense for high-drain motorized/connected devices and Procell Constant for low-drain medical/hospitality hardware), locking in multi-year B2B facility management and OEM device contracts.
- Anhui Anfu Battery Technology Co., Ltd. / Fujian Nanping Nanfu Battery Co., Ltd.: Unrivaled domestic Chinese retail fortress, holding the No. 1 market share for 33 consecutive years (1993-2025). Operates ultra-automated intelligent manufacturing facilities in Nanping, Fujian, producing its flagship Polyring 5th Generation series utilizing a 0.158 mm ultra-thin high-strength steel shell and space-optimized sealing rings. Controls an offline distribution network directly servicing over 1 million retail outlets across China. Deploying a segmented multi-brand matrix—including Fenglan No. 1 (specialized high-temperature gas stove batteries), Chuanying (high-capacity button cells for IoT/automotive fobs), Yiyuan (value carbon-zinc), and TENAVOLTS (rechargeable lithium)—while expanding international OEM/B2B export sales to monetize its massive automated production scale.
- Panasonic Corporation: Century-long electrochemical R&D pedigree and mastery of ultra-high-density active material formulation, epitomized by its flagship EVOLTA and EVOLTA NEO alkaline lines, which utilize high-purity titanium-additive EMD and anti-gas corrosion inhibitors to set global benchmarks for continuous discharge endurance and 10-year anti-leakage reliability. Optimizing global manufacturing footprints across Japan, Thailand, Poland, and Costa Rica to insulate regional supply chains from geopolitical tariff friction, while leveraging its vast corporate relationships across automotive and industrial electronics to dominate B2B OEM factory-installed battery matching.
- GP Industries Limited / Gold Peak Technology Group Limited: Dual-engine commercial architecture combining global retail visibility under the GP brand with deep Mainland China market penetration under the Pairdeer brand (operated via its 70%-owned subsidiary Zhongyin Ningbo Battery Co., Ltd., one of Asia's largest alkaline cell producers). Pioneered the "China Plus One" supply chain migration among Asian battery makers. GP Industries scaled its alkaline manufacturing complex in Ho Chi Minh City, Vietnam to its full capacity of 1 billion cells per annum, positioning the company as the premier tariff-free, export-rebate-insulated supplier for North American brand owners and retail chains.
- VARTA AG: Anchored by its automated, high-precision production lines in Dischingen, Germany, VARTA commands entrenched consumer trust across the DACH region (Germany, Austria, Switzerland) and pan-European retail channels through its "Made in Germany" Longlife, Longlife Power, and Longlife Max Power product tiers. While navigating corporate financial restructuring within its broader lithium-ion energy storage divisions, VARTA's Consumer Batteries division remains a reliable cash-flow generator. It is aggressively scaling its VARTA Industrial Pro B2B segment, supplying ISO 9001 and ISO 13485 certified custom-packaged alkaline cells directly to European smart utility meter, medical glucometer, and electronic security hardware manufacturers.
- FDK CORPORATION: A Fujitsu Group affiliate possessing deep materials science capabilities in both high-purity EMD synthesis and alkaline cell assembly. Known for extreme reliability under high-rate pulse discharge and sub-zero operating temperatures. Shifting focus away from low-margin commoditized retail price wars toward high-specification industrial OEM matching, Japanese disaster-preparedness institutional stockpiling, and co-developed private-label lines for premium domestic retailers.
- SM BEXEL Co., Ltd.: Operates a comprehensive primary battery manufacturing complex in Gumi, Republic of Korea, maintaining strong domestic OBM retail distribution under the BEXEL brand alongside specialized defense-grade electrochemistry capabilities. Balancing domestic consumer alkaline replacement demand with high-margin South Korean defense procurement—specifically manufacturing specialized ampoule and reserve batteries for military artillery fuzes and tactical communications—alongside industrial B2B battery pack integration.
● Export-Oriented ODM/OEM Specialists & Hybrid Conglomerates
- Zhejiang Mustang Battery Co., Ltd.: One of China's premier pure-play intelligent manufacturers of zinc-manganese batteries, based in Ningbo, Zhejiang. Operates proprietary high-speed automated assembly lines and a digitalized MES factory architecture that meets the stringent factory audit, social compliance, and zero-leakage thresholds of top-tier Western retailers. Heavily weighted toward export ODM/OEM contracts for multinational brand owners and global retail giants (Walmart, Costco, Amazon, Carrefour, 7-Eleven), supplemented by domestic OBM sales under the Mustang brand. Currently leveraging automation efficiency gains and dynamic pricing clauses to offset the phased cancellation of China's VAT export rebate.
- Zhejiang Hengwei Battery Co., Ltd.: Jinhua-based specialist in eco-friendly, high-performance alkaline and carbon-zinc primary cells. Maintains an exceptionally lean cost structure and high asset utilization, with 96.17% of corporate revenue historically generated from export markets across North America, Europe, Japan, and the Republic of Korea. Upgrading automated high-speed LR6/LR03 lines to push unit defect rates to near-zero levels, enabling the company to retain sticky private-label contracts with European and Japanese discount chains despite intensifying Chinese export tax headwinds.
- Guangdong Liwang New Energy Co., Ltd.: Dongguan-based high-tech enterprise positioned directly inside the Pearl River Delta electronics manufacturing cluster. This geographic proximity provides an immediate logistical moat for supplying B2B factory-bundled batteries to local toy, remote control, smart lock, and small appliance factories. Operating a dual primary alkaline/carbon-zinc and consumer cylindrical lithium-ion business model, allowing Liwang to cross-sell complete power solutions to international ODM clients and domestic hardware assemblers under both OEM contracts and its proprietary Liwang brand.
- Sichuan Changhong NewEnergy Technology Co., Ltd.: Backed by the industrial scale of parent conglomerate Changhong Group, the company operates massive, highly automated alkaline production bases in Mianyang (Sichuan) and Jiaxing (Zhejiang), achieving top-three production scale within Mainland China. Executing a balanced dual-track strategy—utilizing the household recognition of the Changhong brand for domestic Chinese OBM retail distribution and parent-company appliance bundling, while serving as a high-volume OEM manufacturing partner for international battery brands.
- Guangzhou Tiger Head Battery Group Co., Ltd.: State-backed Chinese dry cell pioneer operating high-speed mercury-free alkaline cylindrical and button cell lines. Possesses an unmatched distribution and brand moat across developing emerging markets—particularly in Sub-Saharan Africa, the Middle East, and Southeast Asia—where its Tiger Head, 555, TIHAD, and HW Hi-Watt trademarks function as category-defining consumer staples. Actively migrating its massive African and Middle Eastern wholesale customer base up the value ladder from low-margin carbon-zinc cells to higher-margin alkaline formats, while utilizing its Hi-Watt manufacturing operations to service global supermarket private-label OEM tenders.
- Golden Power Group Holdings Limited: Chinese manufacturer operating specialized production facilities in Guangdong, China, with deep technical expertise in micro-alkaline button cells, stacked 9V/12V cells (23A/27A), and standard cylindrical formats. Focusing capital allocation on higher-margin specialty alkaline coin cells, hearing-aid batteries, and custom industrial OEM packs under both private-label ODM agreements and its proprietary Golden Power trademark, thereby avoiding direct head-to-head price attrition in standard AA/AAA retail multi-packs.
● High-Growth South Asian Import-Substitution Champions
- Eveready Industries India Ltd.: Commands over 50% overall market share in India's dry cell battery sector, backed by an iconic brand name and a rural-to-urban pan-Indian distribution network reaching millions of traditional kirana stores and modern retail outlets. Spearheading India's structural transition from carbon-zinc to alkaline chemistry. Eveready invested 200 Crore INR (approximately 22.95 million USD) to commission India's only operating greenfield alkaline battery manufacturing plant in Jammu, boasting an installed capacity of 456 million units per annum. Protected by India's mandatory BIS quality control import barriers, Eveready is aggressively scaling its Eveready Ultima and Ultima Pro alkaline lines to eliminate import reliance, capture domestic margin expansion, and build an export platform.
- Indo National Limited: Established in 1972, Indo National is India's second-largest dry cell player, operating an extensive southern and pan-Indian wholesale distribution network under the widely recognized Nippo brand umbrella. Aggressively targeting urban Indian consumers and high-drain smart device users by launching its premium Nippo Thor and Nippo ThorMax alkaline product lines, capitalizing on BIS regulatory enforcement that has cleared unorganized low-priced Chinese imports from Indian retail shelves.
1.1 Executive Summary and Core Industry Findings ... 1
1.2 Product Taxonomy and Electrochemical Scope ... 2
1.3 Research Methodology and Analytical Architecture ... 3
1.4 Primary and Secondary Data Triangulation ... 4
1.5 Econometric Modeling Assumptions and Forecasting Logic ... 5
1.6 Industry Abbreviations and Technical Nomenclature ... 6
Chapter 2 Alkaline Battery Value Chain and Upstream Bottleneck Analysis ... 7
2.1 End-to-End Value Chain Architecture and Margin Distribution ... 7
2.2 Upstream Cathode Active Materials: Electrolytic Manganese Dioxide (EMD) Supply Dynamics ... 8
2.3 Upstream Anode Materials: Mercury-Free Battery-Grade Zinc Powder Metallurgy ... 9
2.4 Potassium Hydroxide (KOH) Electrolyte, Non-Woven Separators, and Nickel-Plated Steel Cans ... 10
2.5 Manufacturing Cost Structure Breakdown and Raw Material Price Volatility (2021-2026) ... 11
2.6 Supply Chain Localization and Environmental Compliance (EU Battery Regulation 2023/1542) ... 13
Chapter 3 Electrochemistry, High-Speed Manufacturing Process, and Patent Landscape ... 14
3.1 Alkaline Zinc-Manganese Dioxide (Zn-MnO2) Electrochemical Performance Benchmarks ... 14
3.2 High-Speed Automated Assembly Line Architecture (LR6 and LR03 Ring-Molding and Sealing) ... 15
3.3 Anti-Leakage Engineering, Polymer Sealant Formulations, and Shelf-Life Extension ... 16
3.4 Global Patent Filing Trends, IPC Classifications, and Core Technological Clusters (2021-2026) ... 17
3.5 Inter-Chemistry Substitution Dynamics: Alkaline vs. Carbon-Zinc, Lithium Primary, and NiMH ... 19
Chapter 4 Global Alkaline Battery Capacity, Production, Consumption, and Market Size (2021-2031) ... 20
4.1 Global Alkaline Battery Manufacturing Capacity and Utilization Rate (2021-2026) ... 20
4.2 Global Alkaline Battery Production Volume and Output Value (2021-2026) ... 21
4.3 Global Alkaline Battery Apparent Consumption and Demand Trajectory (2021-2026) ... 22
4.4 Global Average Selling Price (ASP) Evolution Across Retail and Contract Tiers (2021-2031) ... 23
4.5 Global Capacity, Production, Consumption, and Market Size Forecast (2027-2031) ... 25
Chapter 5 Global Alkaline Battery Import, Export, and Cross-Border Trade Logistics ... 27
5.1 Global Trade Flow Architecture and HS Code 850610 Tariff Structures ... 27
5.2 Primary Exporting Hubs: Outbound Volume, Value, and Destination Mapping (2021-2026) ... 28
5.3 Primary Importing Markets: Inbound Dependency and Retail Inventory Cycles (2021-2026) ... 29
5.4 Maritime Logistics Bottlenecks, Freight Cost Elasticity, and Regional Nearshoring ... 31
Chapter 6 Global Alkaline Battery Market Segmentation by Type (2021-2031) ... 32
6.1 Form Factor Evolution, Volumetric Energy Density, and Discharge Profiles ... 32
6.2 Cylindrical Alkaline Battery ... 33
6.3 Button/Coin Alkaline Battery ... 35
Chapter 7 Global Alkaline Battery Market Segmentation by Application (2021-2031) ... 37
7.1 Downstream Demand Elasticity and Pulse Discharge Requirements ... 37
7.2 Low-Drain Household Electronics ... 38
7.3 High-Drain & Smart Connected Devices ... 40
7.4 Specialized Industrial & Niche Applications ... 41
Chapter 8 Global Alkaline Battery Market Segmentation by Market Model (2021-2031) ... 43
8.1 Value Migration Across Global Commercialization and Distribution Channels ... 43
8.2 ODM/OEM Model ... 44
8.3 Own Brand Manufacturers (OBM) ... 45
8.4 Industrial OEM Matching (B2B) ... 46
Chapter 9 Regional Market Analysis: North America and Europe (2021-2031) ... 48
9.1 North America Alkaline Battery Market Analysis (Capacity, Production, Consumption, Import, Export) ... 48
9.2 United States ... 49
9.3 Canada ... 50
9.4 Mexico ... 51
9.5 Europe Alkaline Battery Market Analysis (Capacity, Production, Consumption, Import, Export) ... 52
9.6 Germany ... 53
9.7 Belgium ... 53
9.8 United Kingdom ... 54
9.9 France ... 54
9.10 Italy ... 55
Chapter 10 Regional Market Analysis: Asia-Pacific, Latin America, and Middle East & Africa (2021-2031) ... 56
10.1 Asia-Pacific Alkaline Battery Market Analysis (Capacity, Production, Consumption, Import, Export) ... 56
10.2 China ... 57
10.3 Japan ... 58
10.4 South Korea ... 59
10.5 India ... 59
10.6 Southeast Asia ... 60
10.7 Latin America Alkaline Battery Market Analysis (Capacity, Production, Consumption, Import, Export) ... 61
10.8 Brazil ... 61
10.9 Argentina ... 62
10.10 Middle East & Africa Alkaline Battery Market Analysis (Capacity, Production, Consumption, Import, Export) ... 62
10.11 Saudi Arabia ... 63
10.12 South Africa ... 63
10.13 United Arab Emirates ... 64
Chapter 11 Corporate Competitive Landscape and Strategic Benchmarking (2021-2026) ... 65
11.1 Global Alkaline Battery Capacity and Production Concentration (CR3, CR5, CR10) ... 65
11.2 Global Revenue Ranking and Market Share Matrix by Manufacturer (2021-2026) ... 66
11.3 Strategic Positioning Matrix: OBM Brand Leaders vs. High-Volume ODM Champions ... 67
11.4 Capacity Expansions, Private Label Contracting, and Cross-Border Supply Agreements ... 69
Chapter 12 Corporate Intelligence and Operational Profiles of Key Market Players ... 70
12.1 Energizer ... 70
12.1.1 Corporate Profile, Manufacturing Footprint, and Strategic Focus ... 70
12.1.2 SWOT Analysis ... 71
12.1.3 Product-Specific Operations (Capacity, Production, Utilization Rate, Price, Cost, Gross Margin, Market Share) ... 72
12.1.4 R&D Expenditure and Go-To-Market (GTM) Strategy ... 73
12.2 Duracell ... 74
12.2.1 Corporate Profile, Manufacturing Footprint, and Strategic Focus ... 74
12.2.2 SWOT Analysis ... 75
12.2.3 Product-Specific Operations (Capacity, Production, Utilization Rate, Price, Cost, Gross Margin, Market Share) ... 76
12.2.4 R&D Expenditure and Go-To-Market (GTM) Strategy ... 77
12.3 Anhui Anfu Battery Technology Co. Ltd./Nanfu ... 78
12.3.1 Corporate Profile, Manufacturing Footprint, and Strategic Focus ... 78
12.3.2 SWOT Analysis ... 79
12.3.3 Product-Specific Operations (Capacity, Production, Utilization Rate, Price, Cost, Gross Margin, Market Share) ... 80
12.3.4 R&D Expenditure and Go-To-Market (GTM) Strategy ... 81
12.4 FDK CORPORATION ... 82
12.4.1 Corporate Profile, Manufacturing Footprint, and Strategic Focus ... 82
12.4.2 SWOT Analysis ... 83
12.4.3 Product-Specific Operations (Capacity, Production, Utilization Rate, Price, Cost, Gross Margin, Market Share) ... 84
12.4.4 R&D Expenditure and Go-To-Market (GTM) Strategy ... 85
12.5 GP Industries Limited ... 86
12.5.1 Corporate Profile, Manufacturing Footprint, and Strategic Focus ... 86
12.5.2 SWOT Analysis ... 87
12.5.3 Product-Specific Operations (Capacity, Production, Utilization Rate, Price, Cost, Gross Margin, Market Share) ... 88
12.5.4 R&D Expenditure and Go-To-Market (GTM) Strategy ... 89
12.6 Panasonic ... 90
12.6.1 Corporate Profile, Manufacturing Footprint, and Strategic Focus ... 90
12.6.2 SWOT Analysis ... 91
12.6.3 Product-Specific Operations (Capacity, Production, Utilization Rate, Price, Cost, Gross Margin, Market Share) ... 92
12.6.4 R&D Expenditure and Go-To-Market (GTM) Strategy ... 93
12.7 VARTA AG ... 94
12.7.1 Corporate Profile, Manufacturing Footprint, and Strategic Focus ... 94
12.7.2 SWOT Analysis ... 95
12.7.3 Product-Specific Operations (Capacity, Production, Utilization Rate, Price, Cost, Gross Margin, Market Share) ... 96
12.7.4 R&D Expenditure and Go-To-Market (GTM) Strategy ... 97
12.8 Zhejiang Mustang Battery Co. Ltd ... 98
12.8.1 Corporate Profile, Manufacturing Footprint, and Strategic Focus ... 98
12.8.2 SWOT Analysis ... 99
12.8.3 Product-Specific Operations (Capacity, Production, Utilization Rate, Price, Cost, Gross Margin, Market Share) ... 100
12.8.4 R&D Expenditure and Go-To-Market (GTM) Strategy ... 101
12.9 Guangdong Liwang New Energy Co. Ltd. ... 102
12.9.1 Corporate Profile, Manufacturing Footprint, and Strategic Focus ... 102
12.9.2 SWOT Analysis ... 103
12.9.3 Product-Specific Operations (Capacity, Production, Utilization Rate, Price, Cost, Gross Margin, Market Share) ... 104
12.9.4 R&D Expenditure and Go-To-Market (GTM) Strategy ... 105
12.10 SM BEXEL Co. Ltd. ... 106
12.10.1 Corporate Profile, Manufacturing Footprint, and Strategic Focus ... 106
12.10.2 SWOT Analysis ... 107
12.10.3 Product-Specific Operations (Capacity, Production, Utilization Rate, Price, Cost, Gross Margin, Market Share) ... 108
12.10.4 R&D Expenditure and Go-To-Market (GTM) Strategy ... 109
12.11 Zhejiang Hengwei Battery Co. Ltd. ... 110
12.11.1 Corporate Profile, Manufacturing Footprint, and Strategic Focus ... 110
12.11.2 SWOT Analysis ... 111
12.11.3 Product-Specific Operations (Capacity, Production, Utilization Rate, Price, Cost, Gross Margin, Market Share) ... 112
12.11.4 R&D Expenditure and Go-To-Market (GTM) Strategy ... 113
12.12 Golden Power Group Holdings Limited ... 114
12.12.1 Corporate Profile, Manufacturing Footprint, and Strategic Focus ... 114
12.12.2 SWOT Analysis ... 115
12.12.3 Product-Specific Operations (Capacity, Production, Utilization Rate, Price, Cost, Gross Margin, Market Share) ... 116
12.12.4 R&D Expenditure and Go-To-Market (GTM) Strategy ... 117
12.13 Indo National Limited ... 118
12.13.1 Corporate Profile, Manufacturing Footprint, and Strategic Focus ... 118
12.13.2 SWOT Analysis ... 119
12.13.3 Product-Specific Operations (Capacity, Production, Utilization Rate, Price, Cost, Gross Margin, Market Share) ... 120
12.13.4 R&D Expenditure and Go-To-Market (GTM) Strategy ... 121
12.14 Sichuan Changhong NewEnergy Technology Co. Ltd. ... 122
12.14.1 Corporate Profile, Manufacturing Footprint, and Strategic Focus ... 122
12.14.2 SWOT Analysis ... 123
12.14.3 Product-Specific Operations (Capacity, Production, Utilization Rate, Price, Cost, Gross Margin, Market Share) ... 124
12.14.4 R&D Expenditure and Go-To-Market (GTM) Strategy ... 125
12.15 Guangzhou Tiger Head Battery Group ... 126
12.15.1 Corporate Profile, Manufacturing Footprint, and Strategic Focus ... 126
12.15.2 SWOT Analysis ... 127
12.15.3 Product-Specific Operations (Capacity, Production, Utilization Rate, Price, Cost, Gross Margin, Market Share) ... 128
12.15.4 R&D Expenditure and Go-To-Market (GTM) Strategy ... 129
12.16 Eveready Industries India Ltd ... 130
12.16.1 Corporate Profile, Manufacturing Footprint, and Strategic Focus ... 130
12.16.2 SWOT Analysis ... 131
12.16.3 Product-Specific Operations (Capacity, Production, Utilization Rate, Price, Cost, Gross Margin, Market Share) ... 132
12.16.4 R&D Expenditure and Go-To-Market (GTM) Strategy ... 133
Table 2 Alkaline Battery Product Classification by IEC and ANSI Standards ... 2
Table 3 Primary Interview Breakdown by Supply Chain Tier and Geography ... 4
Table 4 Macroeconomic and Raw Material Price Assumptions (2026-2031) ... 5
Table 5 Industry Abbreviations and Technical Nomenclature ... 6
Table 6 Global Electrolytic Manganese Dioxide (EMD) Capacity and Battery-Grade Allocation (2021-2026) ... 8
Table 7 Battery-Grade Mercury-Free Zinc Powder Specifications and Supplier Matrix ... 9
Table 8 Key Suppliers of KOH Electrolyte, Non-Woven Separators, and Nickel-Plated Steel Strips ... 10
Table 9 Alkaline Battery (LR6 Standard) Bill of Materials and Cost Breakdown (2021-2026) ... 11
Table 10 Global Regulatory Compliance Matrix for Primary Alkaline Batteries ... 13
Table 11 Electrochemical Comparison: Alkaline vs. Carbon-Zinc vs. Lithium Primary (Li-FeS2) ... 14
Table 12 High-Speed Alkaline Battery Assembly Line Equipment Parameters (600-800 ppm) ... 15
Table 13 Global Alkaline Battery Core Patent Holders and Active Patent Families (2021-2026) ... 18
Table 14 Global Alkaline Battery Capacity, Production, and Utilization Rate (2021-2026) ... 20
Table 15 Global Alkaline Battery Production Volume, Consumption, and Market Size (2021-2026) ... 22
Table 16 Global Alkaline Battery Average Selling Price (ASP) by Commercial Tier (2021-2031) ... 23
Table 17 Global Alkaline Battery Capacity, Production, Consumption, and Market Size Forecast (2027-2031) ... 25
Table 18 Global Alkaline Battery Export Volume and Value by Top Exporting Countries (2021-2026) ... 28
Table 19 Global Alkaline Battery Import Volume and Value by Top Importing Countries (2021-2026) ... 29
Table 20 Global Alkaline Battery Production and Market Size by Type (2021-2026) ... 32
Table 21 Global Alkaline Battery Production and Market Size Forecast by Type (2027-2031) ... 33
Table 22 Cylindrical Alkaline Battery Volume Share by Format (AA, AAA, C, D, 9V) (2021-2031) ... 34
Table 23 Button/Coin Alkaline Battery Demand and Revenue Breakdown (2021-2031) ... 35
Table 24 Global Alkaline Battery Consumption Volume and Revenue by Application (2021-2026) ... 37
Table 25 Global Alkaline Battery Consumption Volume and Revenue Forecast by Application (2027-2031) ... 38
Table 26 Low-Drain Household Electronics Alkaline Battery Demand by Device Category (2021-2031) ... 39
Table 27 High-Drain & Smart Connected Devices Alkaline Battery Demand by Device Category (2021-2031) ... 40
Table 28 Specialized Industrial & Niche Applications Alkaline Battery Demand (2021-2031) ... 41
Table 29 Global Alkaline Battery Production Volume and Revenue by Market Model (2021-2026) ... 43
Table 30 Global Alkaline Battery Production Volume and Revenue Forecast by Market Model (2027-2031) ... 44
Table 31 Margin Structure Comparison: ODM/OEM Model vs. OBM vs. Industrial OEM Matching (B2B) ... 46
Table 32 North America Alkaline Battery Capacity, Production, Consumption, Import, and Export (2021-2031) ... 48
Table 33 United States Alkaline Battery Production, Consumption, and Market Size (2021-2031) ... 49
Table 34 Canada Alkaline Battery Consumption, Import, and Market Size (2021-2031) ... 50
Table 35 Mexico Alkaline Battery Production, Consumption, Import, and Export (2021-2031) ... 51
Table 36 Europe Alkaline Battery Capacity, Production, Consumption, Import, and Export (2021-2031) ... 52
Table 37 Germany Alkaline Battery Production, Consumption, and Market Size (2021-2031) ... 53
Table 38 Belgium Alkaline Battery Production, Export, and Market Size (2021-2031) ... 53
Table 39 United Kingdom Alkaline Battery Consumption, Import, and Market Size (2021-2031) ... 54
Table 40 France Alkaline Battery Consumption, Import, and Market Size (2021-2031) ... 54
Table 41 Italy Alkaline Battery Consumption, Import, and Market Size (2021-2031) ... 55
Table 42 Asia-Pacific Alkaline Battery Capacity, Production, Consumption, Import, and Export (2021-2031) ... 56
Table 43 China Alkaline Battery Capacity, Production, Consumption, Export, and Market Size (2021-2031) ... 57
Table 44 Japan Alkaline Battery Production, Consumption, and Market Size (2021-2031) ... 58
Table 45 South Korea Alkaline Battery Production, Consumption, and Market Size (2021-2031) ... 59
Table 46 India Alkaline Battery Production, Consumption, and Market Size (2021-2031) ... 59
Table 47 Singapore Alkaline Battery Production, Trade Re-Export, and Market Size (2021-2031) ... 60
Table 48 Indonesia Alkaline Battery Production, Consumption, and Export (2021-2031) ... 60
Table 49 Latin America Alkaline Battery Production, Consumption, Import, and Market Size (2021-2031) ... 61
Table 50 Brazil Alkaline Battery Production, Consumption, and Market Size (2021-2031) ... 61
Table 51 Argentina Alkaline Battery Consumption, Import, and Market Size (2021-2031) ... 62
Table 52 Middle East & Africa Alkaline Battery Consumption, Import, and Market Size (2021-2031) ... 62
Table 53 Saudi Arabia Alkaline Battery Consumption, Import, and Market Size (2021-2031) ... 63
Table 54 South Africa Alkaline Battery Consumption, Import, and Market Size (2021-2031) ... 63
Table 55 United Arab Emirates Alkaline Battery Consumption, Import, and Re-Export (2021-2031) ... 64
Table 56 Global Alkaline Battery Capacity by Key Manufacturers (2021-2026) ... 65
Table 57 Global Alkaline Battery Production Volume by Key Manufacturers (2021-2026) ... 66
Table 58 Global Alkaline Battery Revenue by Key Manufacturers (2021-2026) ... 67
Table 59 Global Alkaline Battery Revenue Share by Key Manufacturers (2021-2026) ... 68
Table 60 Energizer Alkaline Battery Capacity, Production, Price, Cost and Gross Profit Margin (2021-2026) ... 72
Table 61 Duracell Alkaline Battery Capacity, Production, Price, Cost and Gross Profit Margin (2021-2026) ... 76
Table 62 Anhui Anfu Battery Technology Co. Ltd./Nanfu Alkaline Battery Capacity, Production, Price, Cost and Gross Profit Margin (2021-2026) ... 80
Table 63 FDK CORPORATION Alkaline Battery Capacity, Production, Price, Cost and Gross Profit Margin (2021-2026) ... 84
Table 64 GP Industries Limited Alkaline Battery Capacity, Production, Price, Cost and Gross Profit Margin (2021-2026) ... 88
Table 65 Panasonic Alkaline Battery Capacity, Production, Price, Cost and Gross Profit Margin (2021-2026) ... 92
Table 66 VARTA AG Alkaline Battery Capacity, Production, Price, Cost and Gross Profit Margin (2021-2026) ... 96
Table 67 Zhejiang Mustang Battery Co. Ltd Alkaline Battery Capacity, Production, Price, Cost and Gross Profit Margin (2021-2026) ... 100
Table 68 Guangdong Liwang New Energy Co. Ltd. Alkaline Battery Capacity, Production, Price, Cost and Gross Profit Margin (2021-2026) ... 104
Table 69 SM BEXEL Co. Ltd. Alkaline Battery Capacity, Production, Price, Cost and Gross Profit Margin (2021-2026) ... 108
Table 70 Zhejiang Hengwei Battery Co. Ltd. Alkaline Battery Capacity, Production, Price, Cost and Gross Profit Margin (2021-2026) ... 112
Table 71 Golden Power Group Holdings Limited Alkaline Battery Capacity, Production, Price, Cost and Gross Profit Margin (2021-2026) ... 116
Table 72 Indo National Limited Alkaline Battery Capacity, Production, Price, Cost and Gross Profit Margin (2021-2026) ... 120
Table 73 Sichuan Changhong NewEnergy Technology Co. Ltd. Alkaline Battery Capacity, Production, Price, Cost and Gross Profit Margin (2021-2026) ... 124
Table 74 Guangzhou Tiger Head Battery Group Alkaline Battery Capacity, Production, Price, Cost and Gross Profit Margin (2021-2026) ... 128
Table 75 Eveready Industries India Ltd Alkaline Battery Capacity, Production, Price, Cost and Gross Profit Margin (2021-2026) ... 132
Figure 1 Global Alkaline Battery Market Size and Growth Rate (2021-2031) ... 1
Figure 2 Bottom-Up and Top-Down Market Sizing Triangulation Architecture ... 3
Figure 3 Alkaline Battery Value Chain and Profit Pool Distribution Across Tiers ... 7
Figure 4 Global Battery-Grade Electrolytic Manganese Dioxide (EMD) Price Index (2021-2026) ... 8
Figure 5 Global SHG Zinc and Battery-Grade Zinc Powder Price Trajectory (2021-2026) ... 9
Figure 6 Alkaline Battery Manufacturing Cost Breakdown by Component (2026) ... 12
Figure 7 Cross-Sectional Engineering Diagram of Cylindrical (LR6) and Button (LR44) Alkaline Cells ... 14
Figure 8 Automated Alkaline Battery Manufacturing Process Flow ... 15
Figure 9 Global Alkaline Battery Annual Patent Publications and Jurisdiction Breakdown (2021-2026) ... 17
Figure 10 Primary Battery Chemistry Positioning: Energy Density vs. Cost per Watt-Hour ... 19
Figure 11 Global Alkaline Battery Capacity, Production Volume, and Utilization Rate (2021-2026) ... 21
Figure 12 Global Alkaline Battery Apparent Consumption and Revenue (2021-2026) ... 22
Figure 13 Global Alkaline Battery Average Selling Price (ASP) Trend (2021-2031) ... 24
Figure 14 Global Alkaline Battery Production and Market Size Forecast (2027-2031) ... 26
Figure 15 Global Alkaline Battery Trade Flow Map: Net Exporters vs. Net Importers (2026) ... 27
Figure 16 Export Share of Top 5 Alkaline Battery Manufacturing Countries (2026) ... 28
Figure 17 Import Share of Top 10 Alkaline Battery Consuming Countries (2026) ... 30
Figure 18 Global Alkaline Battery Market Share by Type (2021, 2026, and 2031) ... 32
Figure 19 Cylindrical Alkaline Battery Revenue and Growth Rate (2021-2031) ... 33
Figure 20 Button/Coin Alkaline Battery Revenue and Growth Rate (2021-2031) ... 36
Figure 21 Global Alkaline Battery Market Share by Application (2021, 2026, and 2031) ... 37
Figure 22 Low-Drain Household Electronics Alkaline Battery Market Size (2021-2031) ... 39
Figure 23 High-Drain & Smart Connected Devices Alkaline Battery Market Size (2021-2031) ... 40
Figure 24 Specialized Industrial & Niche Applications Alkaline Battery Market Size (2021-2031) ... 42
Figure 25 Global Alkaline Battery Production Share by Market Model (2021, 2026, and 2031) ... 43
Figure 26 Value Migration Between OBM Brands and Chinese ODM Contract Manufacturers (2021-2031) ... 45
Figure 27 North America Alkaline Battery Market Size and Regional Share (2021-2031) ... 48
Figure 28 Europe Alkaline Battery Market Size and Regional Share (2021-2031) ... 52
Figure 29 Asia-Pacific Alkaline Battery Market Size and Regional Share (2021-2031) ... 56
Figure 30 Latin America Alkaline Battery Market Size and Regional Share (2021-2031) ... 61
Figure 31 Middle East & Africa Alkaline Battery Market Size and Regional Share (2021-2031) ... 62
Figure 32 Global Alkaline Battery Production Concentration (CR3, CR5, CR10) in 2026 ... 65
Figure 33 Global Alkaline Battery Competitive Positioning Matrix (Volume vs. Gross Margin, 2026) ... 68
Figure 34 Energizer Alkaline Battery Market Share (2021-2026) ... 73
Figure 35 Duracell Alkaline Battery Market Share (2021-2026) ... 77
Figure 36 Anhui Anfu Battery Technology Co. Ltd./Nanfu Alkaline Battery Market Share (2021-2026) ... 81
Figure 37 FDK CORPORATION Alkaline Battery Market Share (2021-2026) ... 85
Figure 38 GP Industries Limited Alkaline Battery Market Share (2021-2026) ... 89
Figure 39 Panasonic Alkaline Battery Market Share (2021-2026) ... 93
Figure 40 VARTA AG Alkaline Battery Market Share (2021-2026) ... 97
Figure 41 Zhejiang Mustang Battery Co. Ltd Alkaline Battery Market Share (2021-2026) ... 101
Figure 42 Guangdong Liwang New Energy Co. Ltd. Alkaline Battery Market Share (2021-2026) ... 105
Figure 43 SM BEXEL Co. Ltd. Alkaline Battery Market Share (2021-2026) ... 109
Figure 44 Zhejiang Hengwei Battery Co. Ltd. Alkaline Battery Market Share (2021-2026) ... 113
Figure 45 Golden Power Group Holdings Limited Alkaline Battery Market Share (2021-2026) ... 117
Figure 46 Indo National Limited Alkaline Battery Market Share (2021-2026) ... 121
Figure 47 Sichuan Changhong NewEnergy Technology Co. Ltd. Alkaline Battery Market Share (2021-2026) ... 125
Figure 48 Guangzhou Tiger Head Battery Group Alkaline Battery Market Share (2021-2026) ... 129
Figure 49 Eveready Industries India Ltd Alkaline Battery Market Share (2021-2026) ... 133
Research Methodology
- Market Estimated Methodology:
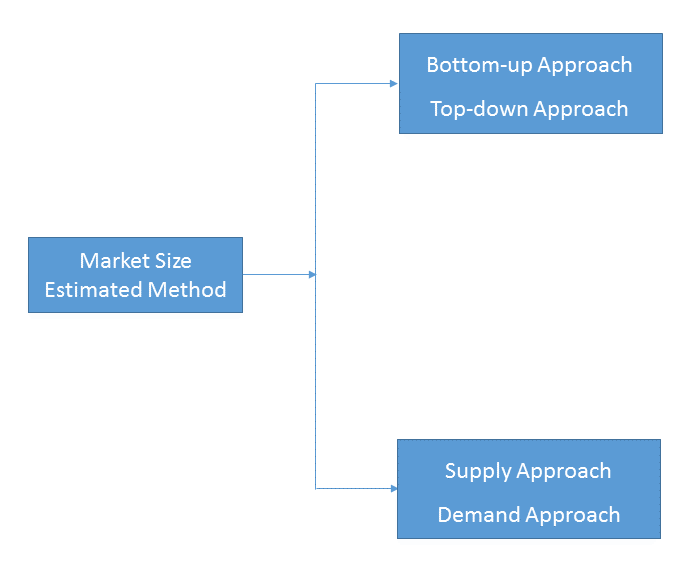
Bottom-up & top-down approach, supply & demand approach are the most important method which is used by HDIN Research to estimate the market size.
1)Top-down & Bottom-up Approach
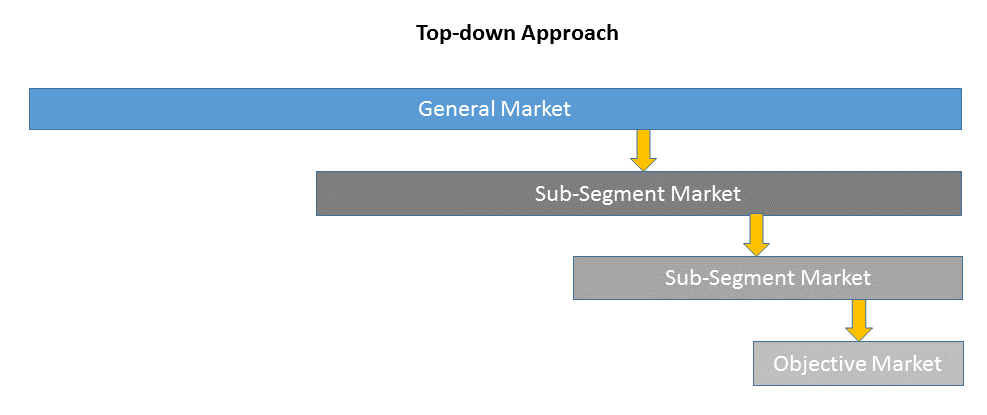
Top-down approach uses a general market size figure and determines the percentage that the objective market represents.
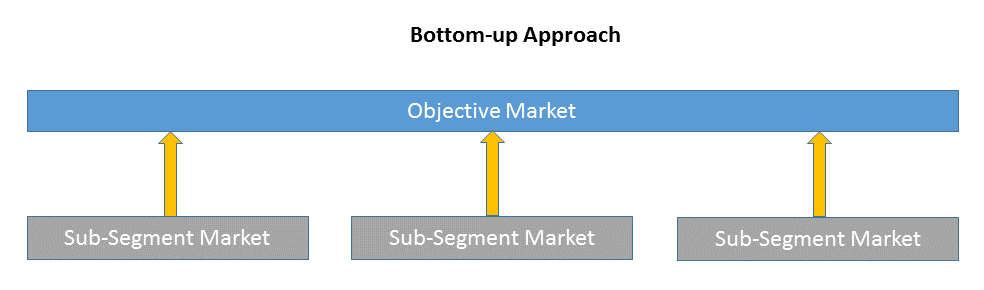
Bottom-up approach size the objective market by collecting the sub-segment information.
2)Supply & Demand Approach
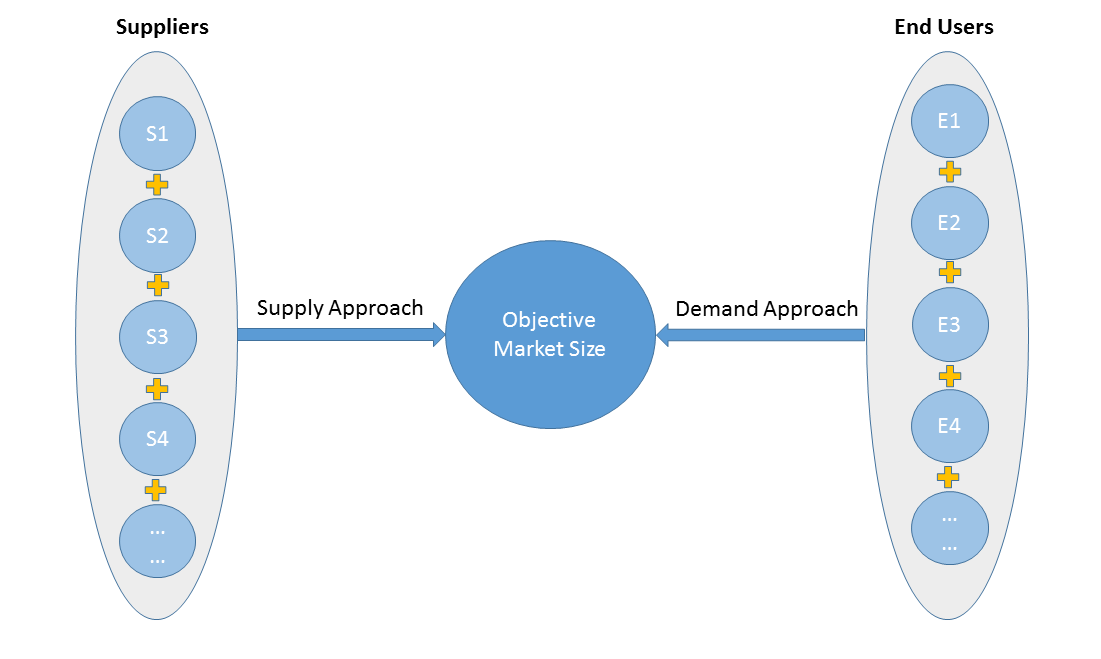
Supply approach is based on assessments of the size of each competitor supplying the objective market.
Demand approach combine end-user data within a market to estimate the objective market size. It is sometimes referred to as bottom-up approach.
- Forecasting Methodology
- Numerous factors impacting the market trend are considered for forecast model:
- New technology and application in the future;
- New project planned/under contraction;
- Global and regional underlying economic growth;
- Threatens of substitute products;
- Industry expert opinion;
- Policy and Society implication.
- Analysis Tools
1)PEST Analysis
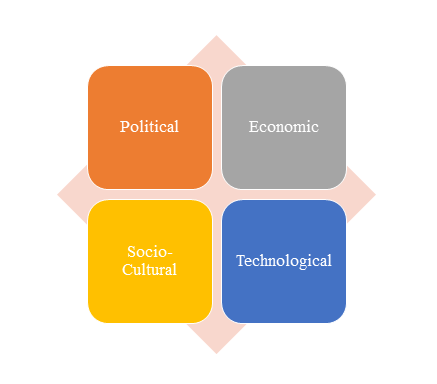
PEST Analysis is a simple and widely used tool that helps our client analyze the Political, Economic, Socio-Cultural, and Technological changes in their business environment.
- Benefits of a PEST analysis:
- It helps you to spot business opportunities, and it gives you advanced warning of significant threats.
- It reveals the direction of change within your business environment. This helps you shape what you’re doing, so that you work with change, rather than against it.
- It helps you avoid starting projects that are likely to fail, for reasons beyond your control.
- It can help you break free of unconscious assumptions when you enter a new country, region, or market; because it helps you develop an objective view of this new environment.
2)Porter’s Five Force Model Analysis
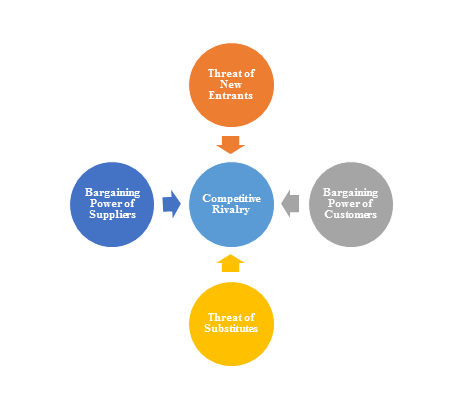
The Porter’s Five Force Model is a tool that can be used to analyze the opportunities and overall competitive advantage. The five forces that can assist in determining the competitive intensity and potential attractiveness within a specific area.
- Threat of New Entrants: Profitable industries that yield high returns will attract new firms.
- Threat of Substitutes: A substitute product uses a different technology to try to solve the same economic need.
- Bargaining Power of Customers: the ability of customers to put the firm under pressure, which also affects the customer's sensitivity to price changes.
- Bargaining Power of Suppliers: Suppliers of raw materials, components, labor, and services (such as expertise) to the firm can be a source of power over the firm when there are few substitutes.
- Competitive Rivalry: For most industries the intensity of competitive rivalry is the major determinant of the competitiveness of the industry.
3)Value Chain Analysis
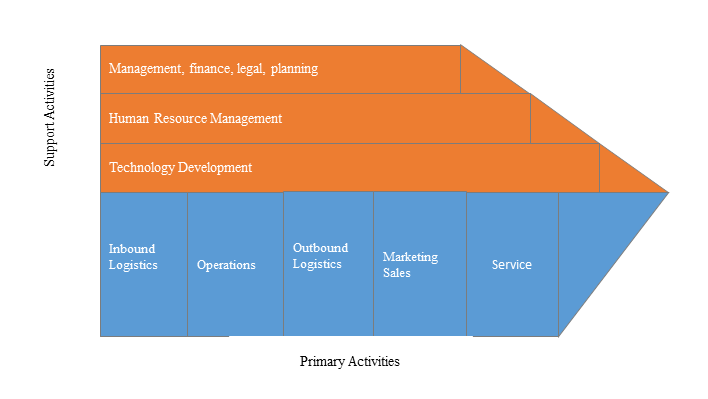
Value chain analysis is a tool to identify activities, within and around the firm and relating these activities to an assessment of competitive strength. Value chain can be analyzed by primary activities and supportive activities. Primary activities include: inbound logistics, operations, outbound logistics, marketing & sales, service. Support activities include: technology development, human resource management, management, finance, legal, planning.
4)SWOT Analysis
SWOT analysis is a tool used to evaluate a company's competitive position by identifying its strengths, weaknesses, opportunities and threats. The strengths and weakness is the inner factor; the opportunities and threats are the external factor. By analyzing the inner and external factors, the analysis can provide the detail information of the position of a player and the characteristics of the industry.
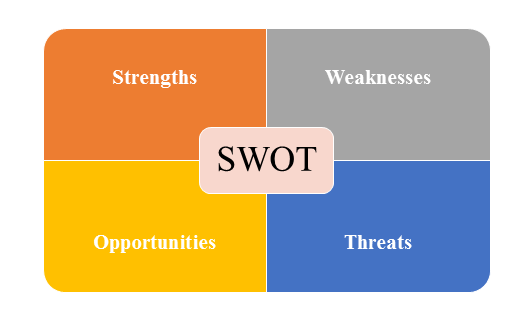
- Strengths describe what the player excels at and separates it from the competition
- Weaknesses stop the player from performing at its optimum level.
- Opportunities refer to favorable external factors that the player can use to give it a competitive advantage.
- Threats refer to factors that have the potential to harm the player.
- Data Sources
| Primary Sources | Secondary Sources |
|---|---|
| Face to face/Phone Interviews with market participants, such as: Manufactures; Distributors; End-users; Experts. Online Survey |
Government/International Organization Data: Annual Report/Presentation/Fact Book Internet Source Information Industry Association Data Free/Purchased Database Market Research Report Book/Journal/News |