Global Carbon-Zinc Battery Market Strategic Outlook 2026
- Single User License (1 Users) $ 3,500
- Team License (2~5 Users) $ 4,500
- Corporate License (>5 Users) $ 5,500
The global Carbon-Zinc battery market size is valued at 2.0 billion to 3.0 billion USD in 2026, with a compound annual growth rate (CAGR) of 1.2% to 2.0% through 2031. Demand architecture is sharply bifurcated along socioeconomic lines. Mature economies in North America, Western Europe, Japan, and the Republic of Korea exhibit alkaline penetration rates exceeding 80%, relegating Carbon-Zinc cells to discount private-label retail tiers and factory-bundled Original Equipment Manufacturer (OEM) starter applications. Conversely, emerging trade corridors across South Asia, Sub-Saharan Africa, Latin America, and secondary Southeast Asian markets rely on Carbon-Zinc dry cells as indispensable household utilities. India alone consumes approximately 2.4 billion units annually, where Carbon-Zinc formulations command 90% of the total dry cell volume. Market leadership is divided between global Own Brand Manufacturers (OBM) commanding retail shelf velocity—such as Energizer Holdings, Eveready Industries India, VARTA AG, GP Industries, and Anhui Anfu (Nanfu)—and high-volume Chinese and Southeast Asian contract manufacturers (ODM/OEM) including Zhejiang Mustang, Zhejiang Hengwei, Guangdong Liwang, Sichuan Changhong NewEnergy, and Guangzhou Tiger Head, which anchor global private-label and industrial B2B supply chains.
ELECTROCHEMICAL ARCHITECTURE AND PRODUCT TAXONOMY
A Carbon-Zinc battery is a non-rechargeable primary cell generating a nominal open-circuit potential of 1.5 Volts per individual electrochemical unit. The architecture employs metallic zinc as the negative electrode (anode) and structural canister, paired with a positive electrode (cathode) comprising electrolytic or natural manganese dioxide (MnO2) blended with conductive carbon—typically acetylene black or synthetic graphite—to overcome the intrinsic electrical resistivity of MnO2. A central porous carbon rod acts as an inert current collector for the cathode while permitting controlled gas venting.
The endurance of Carbon-Zinc chemistry in the modern energy storage matrix stems from four structural bill-of-materials (BOM) advantages:
- Capital and Unit Cost Efficiency: Significantly lower raw material inputs and fully depreciated, high-speed mechanical assembly lines yield factory-gate costs that are 40% to 65% lower than equivalent alkaline cells.
- Ambient Storage Stability: Modern formulations exhibit low self-discharge kinetics under ambient room temperatures, achieving shelf-life stability of up to 10 years when sealed with advanced polymer gaskets.
- Environmental and Regulatory Compliance: Complete elimination of added mercury, cadmium, and lead allows standard municipal waste disposal in most regulatory jurisdictions without specialized hazardous material surcharges.
- Low-Drain Discharge Conformity: A predictable, sloping discharge curve ideally suited for intermittent pulse or continuous micro-current duty cycles where high-capacity alkaline chemistry offers zero functional arbitrage.
● Classification by Electrolyte System
- Standard Ammonium Chloride System (General Purpose): Utilizing a paste-coated or soaked paper separator containing an aqueous blend of ammonium chloride (NH4Cl) and zinc chloride (ZnCl2), this baseline formulation minimizes chemical feedstock expenditure. While adequate for intermittent low-drain duty, sustained current draw precipitates poorly soluble diamminedichlorozinc complex salts along the cathode interface, accelerating internal resistance spikes and voltage sag.
- Heavy-Duty Zinc Chloride System (Super Heavy Duty): Engineered as the performance ceiling within the Carbon-Zinc taxonomy, this system replaces ammonium chloride with a saturated aqueous solution of high-purity zinc chloride (ZnCl2) alongside electrolytic manganese dioxide (EMD). The absence of ammonium ions prevents severe salt crystallization, enhances ionic diffusivity, suppresses hydrogen gas evolution, and enables operation across wider ambient temperature thresholds. Zinc chloride cells deliver substantially higher cumulative service hours under moderate continuous drains and provide superior resistance to post-discharge canister perforation and electrolyte creepage.
● Classification by Physical Structure
- Cylindrical Carbon-Zinc Batteries: Constructed around a deep-drawn zinc impact extrusion canister functioning simultaneously as housing and consumable anode. A starch-coated or polymeric separator lines the interior wall, isolating the zinc from the wet cathode bobbin surrounding the central carbon collector rod. The assembly is hermetically crimped via an asphalt-pitched or polyethylene gasket beneath a tinned steel top cap. Standardized global formats include R03 (AAA) for compact handheld interfaces; R6 (AA), which represents the highest-volume primary cell format globally; R14 (C) for moderate-drain portable audio and illumination; and R20 (D), engineered with maximum active material volume for high-capacity rural lanterns, mechanical igniters, and long-wave transistor radios.
- Layer-Built Carbon-Zinc Batteries (Flat / Stacked Prismatic Cells): Exemplified by the ubiquitous 6F22 (9V) rectangular prism and legacy 3R12 (4.5V) lantern formats, layer-built architectures maximize volumetric voltage density. A 6F22 battery stacks six individual 1.5V flat F22 wafer cells in vertical series inside a metallic or polymer outer jacket. Each flat cell incorporates a duplex electrode plate (a zinc sheet coated on the reverse with conductive carbon film), an electrolyte-impregnated separator, and a compressed MnO2 cathode cake sealed within a hydrophobic wax or plastic envelope. This configuration avoids internal inter-cell wiring losses, delivering a stable 9.0V nominal output tailored for high-voltage, micro-ampere quiescent circuits.
DOWNSTREAM APPLICATION MATRIX AND COMMERCIAL ARCHETYPES
● Downstream Application Segmentation
- Consumer Electronics and Home Automation: Represents the largest baseline volume absorber globally. Carbon-Zinc R03 and R6 cells serve as the default power source for infrared and radio-frequency television remotes, set-top box controllers, quartz wall clocks, digital desktop chronometers, electronic kitchen and bathroom scales, and distributed smart-home sensor nodes (temperature, humidity, and window contact sensors). In price-sensitive markets such as India, AA and AAA cells retail between INR 10 and INR 20 (approximately 0.11 to 0.23 USD) per unit, functioning as non-discretionary fast-moving consumer goods (FMCG).
- Portable Lighting and Audio: Serves as an essential utility lifeline across rural, agricultural, and off-grid demographics in South Asia, Sub-Saharan Africa, and Latin America. Large-format R14 (C) and R20 (D) cells—retailing in South Asia between INR 35 and INR 50 (0.40 to 0.57 USD)—power incandescent and LED handheld torches (flashlights), emergency kerosene-replacement lanterns, shortwave and AM/FM transistor radios, and portable public address megaphones.
- Toys and Novelties: Captures high seasonal volumes driven by strict BOM cost ceilings in mass-market toy production. Low-torque motorized plastic toys, simple LED light-up novelties, acoustic children's books, and entry-level educational electronics rely heavily on heavy-duty zinc chloride cells to preserve wholesale margins.
- Instruments and Safety Devices: Encompasses critical domestic and institutional equipment requiring prolonged standby voltage stability or intermittent pulse delivery. Key deployments include residential ionization and photoelectric smoke detectors (relying heavily on 6F22 9V layer-built batteries), wireless intrusion alarms, biometric and keypad electronic door locks (utilizing 4x or 8x AA arrays), handheld digital thermometers, automated sphygmomanometers (blood pressure monitors), and rechargeable-capacitor replacement electronic mosquito swatters.
● Commercial Market Models
- Own Brand Manufacturer (OBM) Model: Vertically integrated brand owners capture downstream retail margins by investing in consumer brand equity, omnichannel trade marketing, and Key Account (KA) shelf-space management. Prominent OBM operators include Energizer Holdings (Energizer, Eveready, Rayovac, regional Varta rights), VARTA AG, Eveready Industries India, Indo National (Nippo), GP Industries (GP, Pairdeer), Anhui Anfu (Nanfu), Golden Power, SM BEXEL, and Guangzhou Tiger Head (555, Tiger Head).
- Contract Manufacturing (ODM / OEM) Model: Specialized midstream producers operate high-utilization factories manufacturing private-label lines for transnational retail syndicates (Walmart, Costco, Carrefour, Tesco, Metro, 7-Eleven, Family Dollar, Amazon Basics) and regional distributors. Dominated by Chinese industrial players such as Zhejiang Mustang, Zhejiang Hengwei, Guangdong Liwang, and Sichuan Changhong NewEnergy, transactions are executed primarily under Free on Board (FOB) or Cost, Insurance, and Freight (CIF) terms, where profitability hinges on raw material hedging, high-speed line automation, and export tax arbitrage.
- Industrial OEM Matching Model (B2B): Direct business-to-business supply agreements wherein battery manufacturers ship bulk-packaged, often unbranded or custom-sleeved cells directly to the assembly plants of television, air conditioner, smart meter, toy, and small appliance manufacturers. These "in-the-box" starter batteries allow device OEMs to guarantee out-of-the-box functionality at the lowest possible procurement cost per unit.
SUPPLY CHAIN ARCHITECTURE, COST MECHANICS, AND VALUE MIGRATION
● Upstream Feedstock Dynamics
Manufacturing economics are dictated by four primary material buckets:
- Anode Metals: High-purity SHG (Special High Grade) 0# zinc ingots, specialized bismuth-indium-calcium zinc alloys (engineered to suppress hydrogen gassing in zero-mercury environments), and pre-extruded zinc cans.
- Cathode Active Materials: Electrolytic Manganese Dioxide (EMD) for heavy-duty grades, natural manganese dioxide ore powder for standard grades, and high-structure acetylene black to establish a 3D conductive percolation network.
- Electrolyte Salts: Industrial-grade ammonium chloride and purified zinc chloride.
- Structural Packaging & Insulators: Extruded carbon collector rods, kraft/starch-coated separator paper, asphalt/bitumen or polyamide sealants, cold-rolled steel jackets (for metal-jacketed leak-proof designs), tin-plated top/bottom caps, and outer shrink sleeves transitioning from Polyvinyl Chloride (PVC) to Polyethylene Terephthalate (PET).
● Midstream Processing and Circular Manufacturing Protocols
Modern cell production relies on continuous rotary assembly lines operating at speeds exceeding 400 to 600 cells per minute. The sequence encompasses automated cathode mix hydration and bobbin compression, zinc can feeding, bottom insulator cup insertion, separator paper lining, cathode bobbin ramming, central carbon rod insertion with precise wax conditioning, electrolyte metered dosing, top-edge curling, sealant application, thermal aging (typically 7 to 14 days to screen out micro-short circuits via open-circuit voltage drop testing), and high-speed vision inspection.
To combat margin compression and satisfy environmental audits, tier-one plants have institutionalized closed-loop manufacturing. Zinc dross, stamping skeletons, and extrusion fines are captured and remelted on-site at recovery efficiencies exceeding 99%. In packaging departments, European and North American retail mandates have forced the phase-out of PVC blister shells in favor of 100% recyclable PET blisters and biodegradable Polylactic Acid (PLA) industrial polybags.
● Structural Bottlenecks, Fiscal Shocks, and Value Migration
The most disruptive force reshaping global supply chain architecture in 2026 is the intersection of Chinese fiscal policy and Western trade protectionism:
- China VAT Export Rebate Cancellation: Historically, Chinese battery exporters relied on a 13% VAT export rebate to subsidize ultra-thin FOB pricing—frequently quoting near bill-of-materials cost to capture volume and monetize the tax rebate as net profit. The reduction of this rebate to 9% in December 2024, its subsequent drop to 6% in April 2026, and the mandated elimination to 0% in January 2027 permanently removes this fiscal subsidy. This raises effective FOB production costs for Mainland exporters by approximately 13%, rendering sub-scale workshops financially unviable and forcing contract renegotiations with global retail buyers.
- Domestic Tax Asymmetry in China: Mainland China maintains a 4% consumption tax on non-alkaline primary batteries while exempting mercury-free cylinder alkaline batteries. This deliberate policy wedge accelerates domestic capacity conversion toward alkaline lines while squeezing domestic Carbon-Zinc profitability.
- "China Plus One" Manufacturing Relocation: Compounded by persistent U.S. Section 301 and reciprocal tariff barriers on Chinese-origin batteries, leading manufacturers have executed aggressive capital allocation pivots into Southeast Asia. GP Industries operates a 1-billion-unit capacity facility in Ho Chi Minh City, Vietnam; Zhejiang Mustang and Zhejiang Hengwei have scaled dedicated Vietnamese manufacturing subsidiaries; and Sichuan Changhong NewEnergy utilizes production assets in Thailand. These offshore nodes allow OEMs to fulfill North American and European retail contracts free of punitive tariff duties while insulating margins from China's VAT rebate phase-out.
REGIONAL MARKET DYNAMICS AND GROWTH INTERVALS (2026-2031)
● Asia-Pacific
Asia-Pacific serves simultaneously as the global production engine and the largest volume consumption basin.
- India: Stands as the undisputed global volume anchor, absorbing 2.4 billion dry cells annually, of which Carbon-Zinc accounts for 90%. Driven by rural electrification gaps, agricultural torch usage, and massive penetration of DTH television remotes and wall clocks, the Indian market is uniquely insulated from rapid alkaline substitution due to extreme price elasticity at the INR 10 to INR 20 retail price point. Eveready Industries India commands over 50% market share, supported by a nationwide distribution moat reaching 4.5 million retail outlets (including 0.6 million direct coverage touchpoints), competing primarily against Indo National (Nippo). Compliance with the India Battery Waste Management Rules (2022) has introduced mandatory Extended Producer Responsibility (EPR) collection targets, forcing producers to purchase EPR credits from certified recyclers, which is gradually consolidating unorganized grey-market importers.
- Mainland China, Hong Kong, China, and Taiwan, China: Mainland China remains the world's premier manufacturing base, housing fully integrated zinc smelting, EMD processing, and automated cell assembly clusters in Zhejiang, Guangdong, Fujian, and Sichuan provinces. Domestically, alkaline penetration reached 50% to 60% in 2025, restricting domestic Carbon-Zinc demand to budget household replacements and huge B2B industrial OEM bundling across electronics assembly hubs in the Pearl River and Yangtze River Deltas. Corporate entities headquartered in Hong Kong, China (such as Gold Peak Technology Group and Golden Power Group) play a pivotal role in international trade financing, global KA contracting, and cross-border supply chain management, while semiconductor and electronics ODM firms in Taiwan, China procure mainland-manufactured cells for B2B device bundling.
- Southeast Asia: Experiences dual expansion in consumer demand—fueled by urbanization in Indonesia, the Philippines, and Vietnam—and industrial capacity additions as Chinese and Singaporean groups expand factories in Vietnam, Malaysia, and Thailand.
- Japan and the Republic of Korea: Highly mature markets with over 80% alkaline adoption. Carbon-Zinc demand is confined to specialized low-drain precision instruments, educational kits, and emergency preparedness bundles.
● Middle East and Africa
Representing the fastest-growing volume corridor globally, Sub-Saharan Africa and developing Middle Eastern economies treat Carbon-Zinc dry cells as primary off-grid energy infrastructure. Chronic electricity grid deficits and low household incomes sustain massive import volumes of R20 (D), R14 (C), and R6 (AA) cells to power LED torches, portable radios, and domestic lanterns. Chinese exporters—led by Guangzhou Tiger Head (whose 555 and Tiger Head brands enjoy quasi-currency status in parts of West and East Africa), Guangdong Liwang, Zhejiang Hengwei, and Zhejiang Mustang—dominate wholesale distributor channels.
● Europe
Western and Eastern Europe maintain baseline alkaline penetration above 80%. However, persistent inflationary pressures and a multi-year cost-of-living squeeze across European households have catalyzed a visible consumer trade-down phenomenon, bolstering demand for discount supermarket private-label Carbon-Zinc multipacks (e.g., Carrefour, Metro, Tesco, Aldi, Lidl). Counterbalancing this volume resilience is the world's most punitive regulatory environment: the European Union Battery Regulation, REACH chemical restrictions, and strict EPR take-back mandates impose heavy administrative, carbon-footprint auditing, and recycling fee burdens on importers, squeezing smaller third-party brands out of the European Economic Area.
● North America
In the United States and Canada, high-energy alkaline and lithium primary cells dominate mainstream retail. Carbon-Zinc occupies a rigid value niche inside dollar-store chains (such as Family Dollar / Greenbrier International), hardware stores, club channels, and factory-bundled OEM electronics. Market volumes in 2025 and early 2026 experienced cyclical turbulence due to retail inventory destocking and tariff-induced procurement shifts away from Mainland China toward Vietnamese contract manufacturing lines. Energizer Holdings anchors the branded segment (via Eveready and Rayovac), while Asian ODM exporters supply the vast majority of private-label retail programs.
● Latin America
Latin America exhibits sustained structural demand for heavy-duty zinc chloride cells across urban working-class and rural demographics for portable audio, flashlights, toys, and basic domestic appliances. Energizer Holdings (utilizing the Varta brand equity across Latin America alongside Eveready and Rayovac) competes fiercely against direct FOB container imports of Chinese private-label and proprietary brands distributed through traditional open-air markets and regional supermarket chains.
COMPETITIVE LANDSCAPE AND INSTITUTIONAL COMPANY DOSSIERS
1. Energizer Holdings, Inc.: global manufacturing and commercial distribution spanning over 140 countries.
- Carbon-Zinc Portfolio: Eveready (flagship global value brand), Rayovac, Energizer heritage lines, and Varta (regional brand rights in Latin America and Asia-Pacific).
- Strategic Pivots and Operational Moats: Energizer leverages an unmatched global omnichannel retail distribution moat, utilizing its Carbon-Zinc portfolio as a defensive flanker brand to protect premium shelf space for its flagship alkaline and lithium lines. By positioning Eveready Super Heavy Duty cells at entry-level price points across Latin America, APAC, and North American discount channels, Energizer captures price-elastic consumers while optimizing working capital velocity through selective third-party OEM sourcing for non-core SKUs.
2. GP Industries Limited / Gold Peak Technology Group Limited: major manufacturing hubs in Ningbo (Mainland China), Malaysia, and Ho Chi Minh City (Vietnam).
- Carbon-Zinc Portfolio: GP Greencell, GP Super Heavy Duty, and Pairdeer (via 70%-owned subsidiary Zhongyin (Ningbo) Battery Co., Ltd.).
- Strategic Pivots and Operational Moats: GP Industries possesses the industry's most mature geographic diversification moat. By commissioning a 1-billion-unit primary battery manufacturing complex in Vietnam alongside Malaysian operations, GP successfully insulated its global KA retail and B2B industrial OEM matching contracts from U.S.-China tariff friction and Mainland China's 2026-2027 VAT rebate cancellation well ahead of domestic Chinese rivals.
3. VARTA AG: extensive pan-European sales and distribution infrastructure.
- Carbon-Zinc Portfolio: VARTA Superlife / Super Heavy Duty (spanning R03, R6, R14, R20, 3R12, and 6F22 formats).
- Strategic Pivots and Operational Moats: While VARTA AG has navigated severe corporate restructuring and capital reallocation within its lithium-ion microbattery and energy storage divisions in recent years, its consumer household battery segment remains a resilient European cash cow. VARTA's operational moat rests on deep brand trust in DACH and European retail channels, compliant EU Battery Regulation packaging protocols, and strategic outsourcing of mature zinc-chloride cell production to cost-optimized Asian OEM partners, converting fixed manufacturing overhead into variable procurement costs.
4. Eveready Industries India Ltd: domestic manufacturing facilities across India.
- Carbon-Zinc Portfolio: Eveready ("Give Me Red" iconic brand architecture across AA, AAA, C, D, and 6F22 cells).
- Strategic Pivots and Operational Moats: Eveready India operates arguably the strongest localized distribution moat in the global primary battery sector, commanding over 50% share of India's 2.4-billion-unit dry cell market. Its network penetrates 4.5 million retail outlets down to rural villages where global competitors cannot economically distribute. Strategic pivots include aggressive EPR compliance framework integration under Indian waste rules and leveraging its debt-light balance sheet to defend rural R20/R14 torch battery volumes while expanding into higher-margin alkaline and portable LED lighting verticals.
5. Anhui Anfu Battery Technology Co., Ltd. / Nanfu Battery
- Carbon-Zinc Portfolio: Nanfu and NRG (Nanfu Huanqiu) heavy-duty dry cells.
- Strategic Pivots and Operational Moats: Commanding an overwhelming retail monopoly in Mainland China's domestic primary battery market (with over 80% share in domestic alkaline), Nanfu utilizes its sprawling domestic sales network of over 3 million retail terminals as an impenetrable distribution moat. While capital allocation prioritizes high-margin alkaline cells (benefiting from China's 4% consumption tax exemption), Nanfu maintains standardized, zero-mercury Carbon-Zinc lines to fulfill domestic B2B industrial OEM bundling contracts (smart meters, appliances, remotes) and budget rural demand.
6. Zhejiang Mustang Battery Co., Ltd.
- Carbon-Zinc Portfolio: Mustang (Yema) proprietary brand and high-volume ODM/OEM private labels.
- Strategic Pivots and Operational Moats: Mustang's operational moat lies in ultra-high-speed, automated assembly lines and deep integration with global retail KAs (Carrefour, Family Dollar / Greenbrier International, S2S Global). Recognizing the margin existential threat posed by U.S. tariffs and China's VAT export rebate phase-out, Mustang proactively executed a brownfield/greenfield pivot into Vietnam, establishing offshore production capacity to retain North American and European private-label contracts.
7. Zhejiang Hengwei Battery Co., Ltd.
- Carbon-Zinc Portfolio: Hengwei brand and customized global retail private labels (R03, R6, R14, R20, 6F22).
- Strategic Pivots and Operational Moats: Hengwei excels in export-oriented ODM execution for stringent Japanese, South Korean, European, and North American retail specifications. Its operational moat combines rigorous static-aging quality control (minimizing field leakage claims in long-sea-transit containers) with early supply chain localization in Vietnam, allowing seamless tariff-free fulfillment to Western discount and supermarket chains.
8. Guangzhou Tiger Head Battery Group Co., Ltd.
- Carbon-Zinc Portfolio: 555, Tiger Head, TIHAD, and private-label export lines.
- Strategic Pivots and Operational Moats: As one of China's largest state-backed dry cell exporters, Tiger Head possesses an unmatched brand equity moat across Sub-Saharan Africa and the Middle East. Decades of deeply entrenched distributor relationships make its R20 (D) and R6 (AA) cells staple commodities in off-grid African trade corridors. To offset Mainland export tax headwinds, the group is pivoting toward higher-value heavy-duty zinc chloride formulations and bundled solar/portable lighting product ecosystems in emerging markets.
9. Sichuan Changhong NewEnergy Technology Co., Ltd.
- Carbon-Zinc Portfolio: Changhong, Grand-Fly (Feishi), and international OEM private labels.
- Strategic Pivots and Operational Moats: Backed by the industrial scale of the Changhong electronics conglomerate, the company benefits from captive internal B2B OEM demand (bundling starter batteries with Changhong televisions and appliances) alongside massive external OEM scale via its Grand-Fly acquisition. Its strategic investment in a Thai manufacturing base provides a vital Southeast Asian export platform to bypass Sino-U.S. trade friction and Mainland VAT rebate reductions.
10. Guangdong Liwang New Energy Co., Ltd.
- Carbon-Zinc Portfolio: Kendal proprietary brand and extensive OEM/ODM private-label lines.
- Strategic Pivots and Operational Moats: Positioned inside the Pearl River Delta electronics manufacturing cluster, Liwang captures immediate logistics arbitrage for B2B industrial OEM matching with local toy and consumer electronics factories. Concurrently, its dual-track strategy scales the proprietary Kendal brand across Latin America, MEA, and Southeast Asia to capture higher OBM margins and reduce reliance on low-margin FOB contract manufacturing.
11. Golden Power Group Holdings Limited
- Carbon-Zinc Portfolio: Golden Power, Source Natural eco-friendly series, and private-label industrial lines.
- Strategic Pivots and Operational Moats: Golden Power leverages over five decades of electrochemical engineering to serve specialized healthcare instruments, novelty toys, and smart-home OEMs across Europe, North America, and Asia. Its operational moat centers on flexible batch customization, RoHS/REACH environmental compliance verification, and a diversified portfolio spanning cylindrical heavy-duty cells, 6F22 layer-built batteries, and micro button cells.
12. Indo National Limited
- Carbon-Zinc Portfolio: Nippo dry cell series.
- Strategic Pivots and Operational Moats: Holding the strong number-two market position in India's vast Carbon-Zinc duopoly, Indo National commands dominant regional shelf presence across Southern and Western India. Its moat is anchored in deep rural distribution capillarity and high brand recall for torch and radio batteries, supported by strategic diversification into LED luminaires, mosquito bats, and electrical accessories sold through the identical wholesale hardware network.
13. SM BEXEL Co., Ltd.
- Carbon-Zinc Portfolio: BEXEL standard and heavy-duty manganese dry cell series.
- Strategic Pivots and Operational Moats: Operating within a domestic market exceeding 80% alkaline penetration, SM BEXEL maintains a protected operational moat supplying South Korean domestic retail, industrial instrument OEMs, and specialized defense/public-sector procurement channels where domestic quality assurance and stable 1.5V low-drain reliability remain mandatory.
1.1 Scope of the Study and Carbon-Zinc Battery Product Definition 1
1.2 Research Methodology and Analytical Framework 2
1.3 Primary and Secondary Data Triangulation Sources 4
1.4 Key Macroeconomic and Industry Forecasting Assumptions 5
1.5 List of Abbreviations and Technical Nomenclature 6
Chapter 2 Carbon-Zinc Battery Value Chain Architecture and Supply Chain Bottlenecks 7
2.1 End-to-End Value Chain Mapping and Margin Distribution 7
2.2 Upstream Raw Material Supply Dynamics and Cost Sensitivity 8
2.3 Manufacturing Process Analysis: Paste-Lined vs. Paper-Lined Technologies 11
2.4 Patent Landscape and Technological Evolution in Anti-Leakage Sealing 12
2.5 Supply Chain Bottlenecks, Logistics Constraints, and Commodity Volatility 13
Chapter 3 Global Carbon-Zinc Battery Market Dynamics: Capacity, Production, Consumption and Value Migration 14
3.1 Global Carbon-Zinc Battery Capacity and Utilization Rate Analysis (2021-2031) 14
3.2 Global Production Volume and Output Value Trends (2021-2031) 15
3.3 Global Consumption Volume and Market Size Valuation (2021-2031) 16
3.4 Average Selling Price (ASP) Trajectory and Bill of Materials (BOM) Breakdown (2021-2031) 18
3.5 Value Migration: Carbon-Zinc vs. Alkaline Primary Battery Substitution Dynamics 19
Chapter 4 Market Segmentation by Electrolyte Chemistry and Physical Structure (2021-2031) 21
4.1 Global Carbon-Zinc Battery Market Overview by Electrolyte Chemistry 21
4.2 Global Carbon-Zinc Battery Market Overview by Physical Structure 24
4.3 Cross-Segment Profitability Comparison and IEC 60086 Standard Alignment 27
Chapter 5 Downstream Application Demand and Market Model Evolution (2021-2031) 28
5.1 Global Consumption Breakdown by Downstream Application 28
5.1.1 Consumer Electronics & Home Automation 29
5.1.2 Portable Lighting & Audio 30
5.1.3 Toys & Novelties 31
5.1.4 Instruments & Safety Devices 32
5.2 Market Channel Architecture and Commercial Model Segmentation 33
5.2.1 ODM/OEM Model 33
5.2.2 Own Brand Manufacturers (OBM) 34
5.2.3 Industrial OEM Matching (B2B) 34
Chapter 6 Global Trade Flows, Import/Export Dynamics and Tariff Impacts 35
6.1 Global Export Volume and Value by Major Manufacturing Hubs (2021-2026) 35
6.2 Global Import Volume and Value by Key Demand Centers (2021-2026) 36
6.3 Bilateral Trade Balances and Inter-Regional Maritime Logistics Corridors 37
6.4 Trade Barriers, Anti-Dumping Duties, and Customs Compliance under HS Code 850610 39
Chapter 7 Asia-Pacific Carbon-Zinc Battery Market Analysis (2021-2031) 40
7.1 Asia-Pacific Regional Market Overview: Capacity, Production, Consumption and Market Size 40
7.2 China 41
7.3 India 42
7.4 Japan 43
7.5 South Korea 44
7.6 Southeast Asia 45
Chapter 8 North America and Europe Carbon-Zinc Battery Market Analysis (2021-2031) 47
8.1 North America Regional Market Overview: Production, Consumption and Market Size 47
8.2 United States 48
8.3 Canada 49
8.4 Mexico 49
8.5 Europe Regional Market Overview: Production, Consumption and Market Size 50
8.6 Germany 51
8.7 United Kingdom 51
8.8 France 52
8.9 Poland 52
8.10 Italy & Rest of Europe 53
Chapter 9 South America, Middle East and Africa Carbon-Zinc Battery Market Analysis (2021-2031) 54
9.1 South America Regional Market Overview: Production, Consumption and Market Size 54
9.2 Brazil 55
9.3 Argentina 55
9.4 Colombia 56
9.5 Middle East and Africa Regional Market Overview: Production, Consumption and Market Size 56
9.6 Nigeria 57
9.7 South Africa 57
9.8 Egypt 58
9.9 Kenya 58
9.10 United Arab Emirates 59
Chapter 10 Corporate Competitive Landscape and Market Share Analysis 60
10.1 Global Manufacturer Capacity and Production Volume Rankings (2021-2026) 60
10.2 Global Manufacturer Revenue and Market Share Concentration (CR5 and CR10) 61
10.3 Competitive Matrix: OBM Brand Equity vs. ODM/OEM Scale Efficiency 63
10.4 Strategic Mergers, Acquisitions, and Manufacturing Footprint Realignment 64
Chapter 11 Key Market Players Corporate Intelligence Profiles 65
11.1 Energizer 65
11.1.1 Corporate Profile and Strategic Positioning 65
11.1.2 SWOT Analysis 65
11.1.3 Carbon-Zinc Battery Operations: Capacity, Production, Utilization Rate, Price, Cost, Gross Margin and Market Share (2021-2026) 66
11.1.4 Global Go-To-Market (GTM) Strategy and Retail Channel Management 68
11.2 GP Industries Limited 69
11.2.1 Corporate Profile and Strategic Positioning 69
11.2.2 SWOT Analysis 69
11.2.3 Carbon-Zinc Battery Operations: Capacity, Production, Utilization Rate, Price, Cost, Gross Margin and Market Share (2021-2026) 70
11.2.4 R&D Expenditure and Southeast Asian Manufacturing Realignment 72
11.3 VARTA AG 73
11.3.1 Corporate Profile and Strategic Positioning 73
11.3.2 SWOT Analysis 73
11.3.3 Carbon-Zinc Battery Operations: Capacity, Production, Utilization Rate, Price, Cost, Gross Margin and Market Share (2021-2026) 74
11.3.4 European Omnichannel Distribution and Private Label Strategy 76
11.4 Anhui Anfu Battery Technology Co. Ltd./Nanfu 77
11.4.1 Corporate Profile and Strategic Positioning 77
11.4.2 SWOT Analysis 77
11.4.3 Carbon-Zinc Battery Operations: Capacity, Production, Utilization Rate, Price, Cost, Gross Margin and Market Share (2021-2026) 78
11.4.4 Domestic Distribution Penetration and Sub-Brand Portfolio Strategy 80
11.5 Guangdong Liwang New Energy Co. Ltd. 81
11.5.1 Corporate Profile and Strategic Positioning 81
11.5.2 SWOT Analysis 81
11.5.3 Carbon-Zinc Battery Operations: Capacity, Production, Utilization Rate, Price, Cost, Gross Margin and Market Share (2021-2026) 82
11.5.4 Automated Production Line Upgrades and B2B OEM Matching Strategy 84
11.6 SM BEXEL Co. Ltd. 85
11.6.1 Corporate Profile and Strategic Positioning 85
11.6.2 SWOT Analysis 85
11.6.3 Carbon-Zinc Battery Operations: Capacity, Production, Utilization Rate, Price, Cost, Gross Margin and Market Share (2021-2026) 86
11.6.4 Domestic Industrial Supply and Export Market Positioning 88
11.7 Zhejiang Hengwei Battery Co. Ltd. 89
11.7.1 Corporate Profile and Strategic Positioning 89
11.7.2 SWOT Analysis 89
11.7.3 Carbon-Zinc Battery Operations: Capacity, Production, Utilization Rate, Price, Cost, Gross Margin and Market Share (2021-2026) 90
11.7.4 Global Private Label ODM/OEM Contract Manufacturing Strategy 92
11.8 Golden Power Group Holdings Limited 93
11.8.1 Corporate Profile and Strategic Positioning 93
11.8.2 SWOT Analysis 93
11.8.3 Carbon-Zinc Battery Operations: Capacity, Production, Utilization Rate, Price, Cost, Gross Margin and Market Share (2021-2026) 94
11.8.4 Layer-Built Battery Specialization and Heavy-Duty Product R&D 96
11.9 Indo National Limited 97
11.9.1 Corporate Profile and Strategic Positioning 97
11.9.2 SWOT Analysis 97
11.9.3 Carbon-Zinc Battery Operations: Capacity, Production, Utilization Rate, Price, Cost, Gross Margin and Market Share (2021-2026) 98
11.9.4 Rural Indian Distribution Network and Pricing Strategy 100
11.10 Sichuan Changhong NewEnergy Technology Co. Ltd. 101
11.10.1 Corporate Profile and Strategic Positioning 101
11.10.2 SWOT Analysis 101
11.10.3 Carbon-Zinc Battery Operations: Capacity, Production, Utilization Rate, Price, Cost, Gross Margin and Market Share (2021-2026) 102
11.10.4 Consumer Electronics Bundling and Export Expansion Strategy 104
11.11 Guangzhou Tiger Head Battery Group 105
11.11.1 Corporate Profile and Strategic Positioning 105
11.11.2 SWOT Analysis 105
11.11.3 Carbon-Zinc Battery Operations: Capacity, Production, Utilization Rate, Price, Cost, Gross Margin and Market Share (2021-2026) 106
11.11.4 Emerging Market OBM Dominance in Africa and Middle East 108
11.12 Zhejiang Mustang Battery Co. Ltd 109
11.12.1 Corporate Profile and Strategic Positioning 109
11.12.2 SWOT Analysis 109
11.12.3 Carbon-Zinc Battery Operations: Capacity, Production, Utilization Rate, Price, Cost, Gross Margin and Market Share (2021-2026) 110
11.12.4 High-Speed Manufacturing Efficiency and Global Retail Sourcing 112
11.13 Eveready Industries India Ltd 113
11.13.1 Corporate Profile and Strategic Positioning 113
11.13.2 SWOT Analysis 113
11.13.3 Carbon-Zinc Battery Operations: Capacity, Production, Utilization Rate, Price, Cost, Gross Margin and Market Share (2021-2026) 114
11.13.4 Brand Equity Defense and Rural Market Penetration in South Asia 116
Chapter 12 Environmental Governance, Regulatory Compliance and Strategic Risk Matrix (2026-2031) 117
Table 1.2 Research Assumptions and Currency Exchange Rate Benchmarks (2021-2031) 5
Table 1.3 Industry Abbreviations and Technical Nomenclature 6
Table 2.1 Carbon-Zinc Battery Raw Material Cost Structure and Supplier Concentration 8
Table 2.2 Electrolytic Manganese Dioxide (EMD) vs. Natural Manganese Dioxide (NMD) Performance Matrix 9
Table 2.3 Comparison of Paste-Lined and Paper-Lined Manufacturing Processes 11
Table 2.4 Key Active Patents in Carbon-Zinc Battery Sealing and Anti-Leakage Architecture 12
Table 3.1 Global Carbon-Zinc Battery Capacity, Production, and Utilization Rate (2021-2031) 14
Table 3.2 Global Carbon-Zinc Battery Consumption Volume and Market Size (2021-2031) 16
Table 3.3 Global Carbon-Zinc Battery Average Selling Price (ASP) and Manufacturing Cost (2021-2031) 18
Table 3.4 Total Cost of Ownership and Performance Comparison: Carbon-Zinc vs. Alkaline Batteries 20
Table 4.1 Global Carbon-Zinc Battery Production and Market Size by Electrolyte Chemistry (2021-2031) 21
Table 4.2 Standard Ammonium Chloride System Market Volume and Value by Region (2021-2031) 22
Table 4.3 Heavy-Duty Zinc Chloride System Market Volume and Value by Region (2021-2031) 23
Table 4.4 Global Carbon-Zinc Battery Production and Market Size by Physical Structure (2021-2031) 24
Table 4.5 Cylindrical Carbon-Zinc Battery Market Breakdown by Cell Size (R6, R03, R14, R20) (2021-2031) 25
Table 4.6 Layer-Built Carbon-Zinc Battery Market Breakdown by Cell Size (6F22, 4R25) (2021-2031) 26
Table 5.1 Global Carbon-Zinc Battery Consumption Volume by Application (2021-2031) 28
Table 5.2 Global Carbon-Zinc Battery Market Size by Application (2021-2031) 29
Table 5.3 Global Carbon-Zinc Battery Revenue Breakdown by Market Model (ODM/OEM, OBM, B2B) (2021-2031) 33
Table 6.1 Top 10 Exporting Countries of Carbon-Zinc Batteries by Volume and Value (2021-2026) 35
Table 6.2 Top 10 Importing Countries of Carbon-Zinc Batteries by Volume and Value (2021-2026) 36
Table 6.3 Import Tariff Rates and Non-Tariff Regulatory Barriers for HS Code 850610 Across Major Markets 39
Table 7.1 Asia-Pacific Carbon-Zinc Battery Capacity, Production, Consumption and Market Size (2021-2031) 40
Table 7.2 Asia-Pacific Carbon-Zinc Battery Consumption Volume by Country (2021-2031) 41
Table 7.3 Asia-Pacific Carbon-Zinc Battery Market Size by Country (2021-2031) 42
Table 8.1 North America Carbon-Zinc Battery Production, Consumption and Market Size (2021-2031) 47
Table 8.2 North America Carbon-Zinc Battery Market Size by Country (2021-2031) 48
Table 8.3 Europe Carbon-Zinc Battery Production, Consumption and Market Size (2021-2031) 50
Table 8.4 Europe Carbon-Zinc Battery Market Size by Country (2021-2031) 51
Table 9.1 South America Carbon-Zinc Battery Production, Consumption and Market Size (2021-2031) 54
Table 9.2 South America Carbon-Zinc Battery Market Size by Country (2021-2031) 55
Table 9.3 Middle East and Africa Carbon-Zinc Battery Production, Consumption and Market Size (2021-2031) 56
Table 9.4 Middle East and Africa Carbon-Zinc Battery Market Size by Country (2021-2031) 57
Table 10.1 Global Carbon-Zinc Battery Capacity by Key Manufacturers (2021-2026) 60
Table 10.2 Global Carbon-Zinc Battery Production Volume by Key Manufacturers (2021-2026) 61
Table 10.3 Global Carbon-Zinc Battery Revenue by Key Manufacturers (2021-2026) 62
Table 10.4 Global Carbon-Zinc Battery Market Share by Key Manufacturers (2021-2026) 62
Table 11.1 Energizer Corporate Profile and Key Operational Metrics 65
Table 11.2 Energizer Carbon-Zinc Battery Capacity, Production, Price, Cost and Gross Profit Margin (2021-2026) 66
Table 11.3 GP Industries Limited Corporate Profile and Key Operational Metrics 69
Table 11.4 GP Industries Limited Carbon-Zinc Battery Capacity, Production, Price, Cost and Gross Profit Margin (2021-2026) 70
Table 11.5 VARTA AG Corporate Profile and Key Operational Metrics 73
Table 11.6 VARTA AG Carbon-Zinc Battery Capacity, Production, Price, Cost and Gross Profit Margin (2021-2026) 74
Table 11.7 Anhui Anfu Battery Technology Co. Ltd./Nanfu Corporate Profile and Key Operational Metrics 77
Table 11.8 Anhui Anfu Battery Technology Co. Ltd./Nanfu Carbon-Zinc Battery Capacity, Production, Price, Cost and Gross Profit Margin (2021-2026) 78
Table 11.9 Guangdong Liwang New Energy Co. Ltd. Corporate Profile and Key Operational Metrics 81
Table 11.10 Guangdong Liwang New Energy Co. Ltd. Carbon-Zinc Battery Capacity, Production, Price, Cost and Gross Profit Margin (2021-2026) 82
Table 11.11 SM BEXEL Co. Ltd. Corporate Profile and Key Operational Metrics 85
Table 11.12 SM BEXEL Co. Ltd. Carbon-Zinc Battery Capacity, Production, Price, Cost and Gross Profit Margin (2021-2026) 86
Table 11.13 Zhejiang Hengwei Battery Co. Ltd. Corporate Profile and Key Operational Metrics 89
Table 11.14 Zhejiang Hengwei Battery Co. Ltd. Carbon-Zinc Battery Capacity, Production, Price, Cost and Gross Profit Margin (2021-2026) 90
Table 11.15 Golden Power Group Holdings Limited Corporate Profile and Key Operational Metrics 93
Table 11.16 Golden Power Group Holdings Limited Carbon-Zinc Battery Capacity, Production, Price, Cost and Gross Profit Margin (2021-2026) 94
Table 11.17 Indo National Limited Corporate Profile and Key Operational Metrics 97
Table 11.18 Indo National Limited Carbon-Zinc Battery Capacity, Production, Price, Cost and Gross Profit Margin (2021-2026) 98
Table 11.19 Sichuan Changhong NewEnergy Technology Co. Ltd. Corporate Profile and Key Operational Metrics 101
Table 11.20 Sichuan Changhong NewEnergy Technology Co. Ltd. Carbon-Zinc Battery Capacity, Production, Price, Cost and Gross Profit Margin (2021-2026) 102
Table 11.21 Guangzhou Tiger Head Battery Group Corporate Profile and Key Operational Metrics 105
Table 11.22 Guangzhou Tiger Head Battery Group Carbon-Zinc Battery Capacity, Production, Price, Cost and Gross Profit Margin (2021-2026) 106
Table 11.23 Zhejiang Mustang Battery Co. Ltd Corporate Profile and Key Operational Metrics 109
Table 11.24 Zhejiang Mustang Battery Co. Ltd Carbon-Zinc Battery Capacity, Production, Price, Cost and Gross Profit Margin (2021-2026) 110
Table 11.25 Eveready Industries India Ltd Corporate Profile and Key Operational Metrics 113
Table 11.26 Eveready Industries India Ltd Carbon-Zinc Battery Capacity, Production, Price, Cost and Gross Profit Margin (2021-2026) 114
Table 12.1 Global Environmental Regulatory Compliance Matrix for Carbon-Zinc Batteries 117
Table 12.2 Strategic Risk Assessment and Mitigation Matrix for Carbon-Zinc Battery Manufacturers 119
Figure 1.1 Carbon-Zinc Battery Product Classification Tree 2
Figure 1.2 Research Methodology and Bottom-Up/Top-Down Market Sizing Logic 3
Figure 2.1 Global Carbon-Zinc Battery Value Chain and Margin Pool Distribution 7
Figure 2.2 LME Zinc Ingot and Electrolytic Manganese Dioxide (EMD) Historical Price Trends (2021-2026) 10
Figure 2.3 Cross-Sectional Structural Diagram of Cylindrical and Layer-Built Carbon-Zinc Cells 11
Figure 3.1 Global Carbon-Zinc Battery Capacity, Production Volume and Utilization Rate (2021-2031) 15
Figure 3.2 Global Carbon-Zinc Battery Consumption Volume and Market Value Growth (2021-2031) 17
Figure 3.3 Global Carbon-Zinc Battery Bill of Materials (BOM) Cost Breakdown in 2026 18
Figure 3.4 Primary Battery Chemistry Share Shift: Carbon-Zinc vs. Alkaline vs. Lithium Primary (2021-2031) 19
Figure 4.1 Global Carbon-Zinc Battery Consumption Share by Electrolyte Chemistry (2021-2031) 21
Figure 4.2 Discharge Voltage Profiles: Ammonium Chloride vs. Heavy-Duty Zinc Chloride Systems 23
Figure 4.3 Global Carbon-Zinc Battery Consumption Share by Physical Structure (2021-2031) 24
Figure 4.4 Gross Margin Comparison Across Carbon-Zinc Battery Form Factors (2026) 27
Figure 5.1 Global Carbon-Zinc Battery Consumption Share by Downstream Application (2021-2031) 28
Figure 5.2 Demand Dynamics in Consumer Electronics & Home Automation (2021-2031) 29
Figure 5.3 Demand Dynamics in Portable Lighting & Audio (2021-2031) 30
Figure 5.4 Demand Dynamics in Toys & Novelties (2021-2031) 31
Figure 5.5 Demand Dynamics in Instruments & Safety Devices (2021-2031) 32
Figure 5.6 Global Carbon-Zinc Battery Volume Share by Market Model (ODM/OEM, OBM, Industrial B2B) 34
Figure 6.1 Global Carbon-Zinc Battery Trade Flow Map and Net Export/Import Balances (2026) 38
Figure 7.1 Asia-Pacific Carbon-Zinc Battery Market Size and Share by Country (2021-2031) 40
Figure 7.2 China Carbon-Zinc Battery Production, Domestic Consumption, and Export Volume (2021-2031) 41
Figure 7.3 India Carbon-Zinc Battery Consumption Volume and Rural vs. Urban Demand Split (2021-2031) 42
Figure 8.1 North America Carbon-Zinc Battery Market Size by Country (2021-2031) 47
Figure 8.2 Europe Carbon-Zinc Battery Market Size by Country (2021-2031) 50
Figure 9.1 South America Carbon-Zinc Battery Market Size by Country (2021-2031) 54
Figure 9.2 Middle East and Africa Carbon-Zinc Battery Market Size by Country (2021-2031) 56
Figure 10.1 Global Carbon-Zinc Battery Market Concentration (CR5 and CR10) Evolution (2021-2026) 61
Figure 10.2 Competitive Positioning Matrix of Key Carbon-Zinc Battery Manufacturers (2026) 63
Figure 11.1 Energizer Carbon-Zinc Battery Market Share (2021-2026) 67
Figure 11.2 GP Industries Limited Carbon-Zinc Battery Market Share (2021-2026) 71
Figure 11.3 VARTA AG Carbon-Zinc Battery Market Share (2021-2026) 75
Figure 11.4 Anhui Anfu Battery Technology Co. Ltd./Nanfu Carbon-Zinc Battery Market Share (2021-2026) 79
Figure 11.5 Guangdong Liwang New Energy Co. Ltd. Carbon-Zinc Battery Market Share (2021-2026) 83
Figure 11.6 SM BEXEL Co. Ltd. Carbon-Zinc Battery Market Share (2021-2026) 87
Figure 11.7 Zhejiang Hengwei Battery Co. Ltd. Carbon-Zinc Battery Market Share (2021-2026) 91
Figure 11.8 Golden Power Group Holdings Limited Carbon-Zinc Battery Market Share (2021-2026) 95
Figure 11.9 Indo National Limited Carbon-Zinc Battery Market Share (2021-2026) 99
Figure 11.10 Sichuan Changhong NewEnergy Technology Co. Ltd. Carbon-Zinc Battery Market Share (2021-2026) 103
Figure 11.11 Guangzhou Tiger Head Battery Group Carbon-Zinc Battery Market Share (2021-2026) 107
Figure 11.12 Zhejiang Mustang Battery Co. Ltd Carbon-Zinc Battery Market Share (2021-2026) 111
Figure 11.13 Eveready Industries India Ltd Carbon-Zinc Battery Market Share (2021-2026) 115
Figure 12.1 EU Battery Regulation (EU) 2023/1542 Compliance Timeline for Portable Primary Batteries 118
Research Methodology
- Market Estimated Methodology:
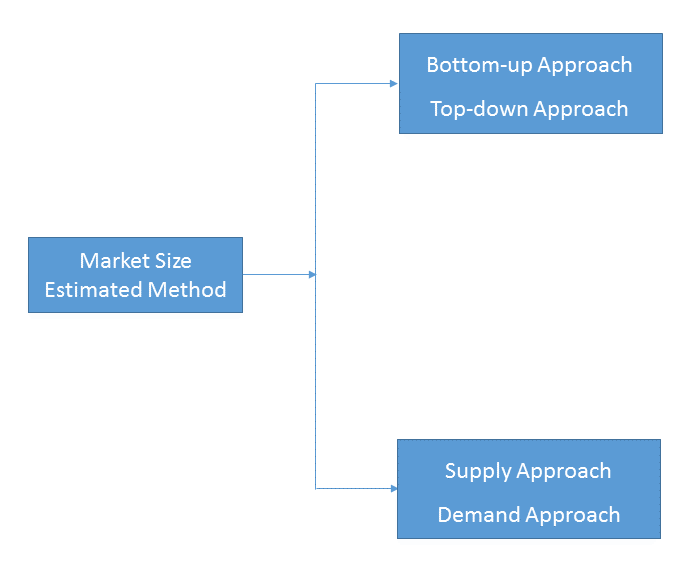
Bottom-up & top-down approach, supply & demand approach are the most important method which is used by HDIN Research to estimate the market size.
1)Top-down & Bottom-up Approach
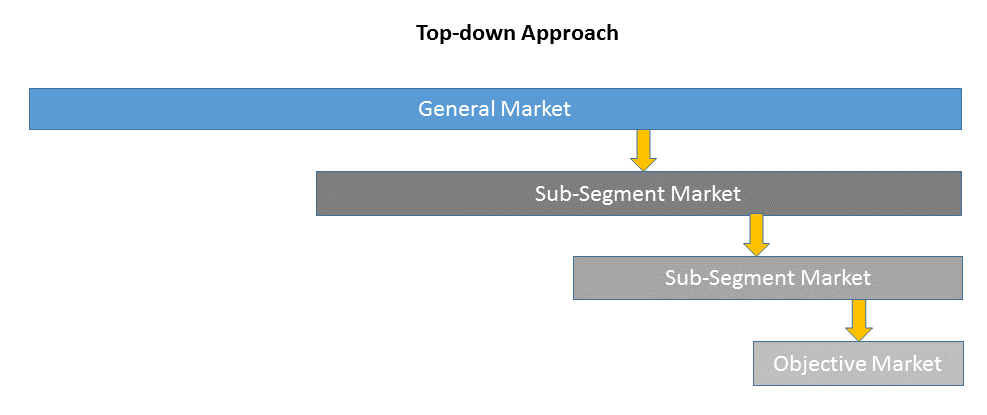
Top-down approach uses a general market size figure and determines the percentage that the objective market represents.
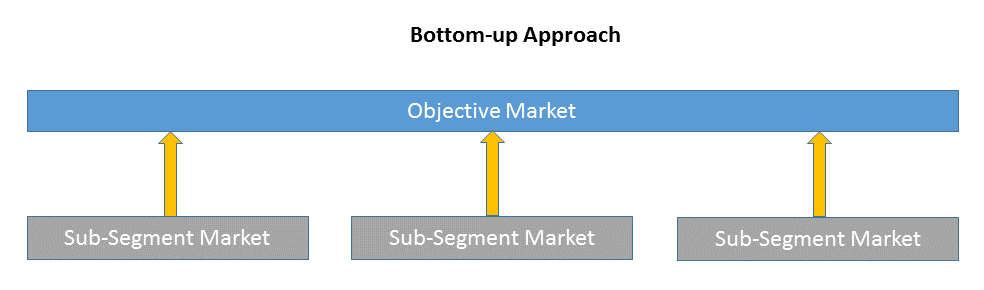
Bottom-up approach size the objective market by collecting the sub-segment information.
2)Supply & Demand Approach
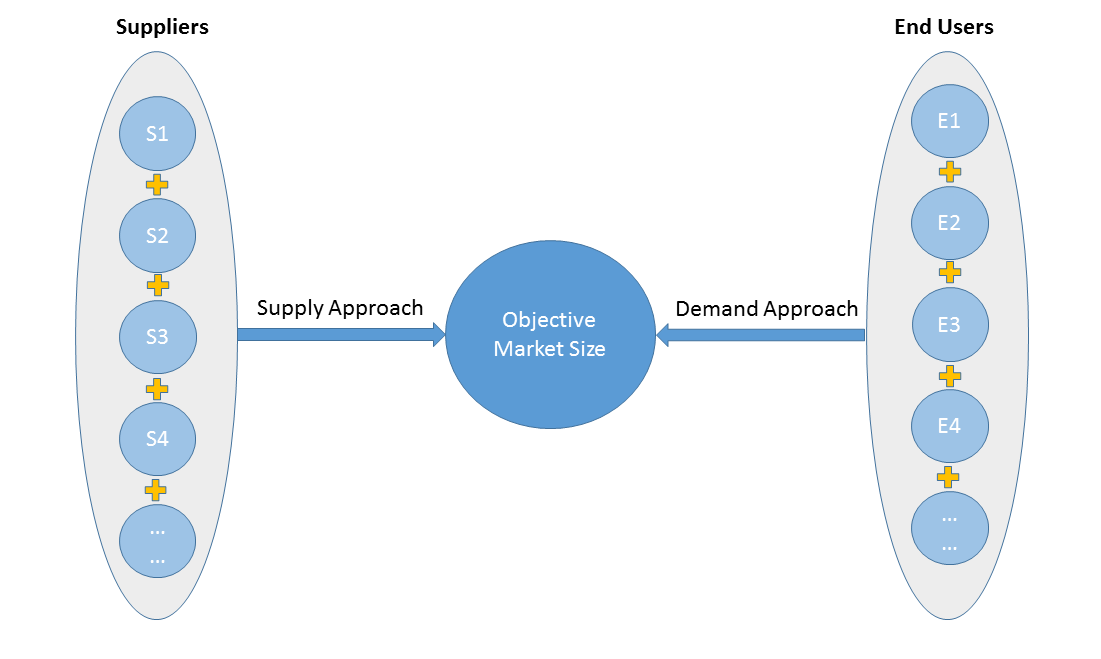
Supply approach is based on assessments of the size of each competitor supplying the objective market.
Demand approach combine end-user data within a market to estimate the objective market size. It is sometimes referred to as bottom-up approach.
- Forecasting Methodology
- Numerous factors impacting the market trend are considered for forecast model:
- New technology and application in the future;
- New project planned/under contraction;
- Global and regional underlying economic growth;
- Threatens of substitute products;
- Industry expert opinion;
- Policy and Society implication.
- Analysis Tools
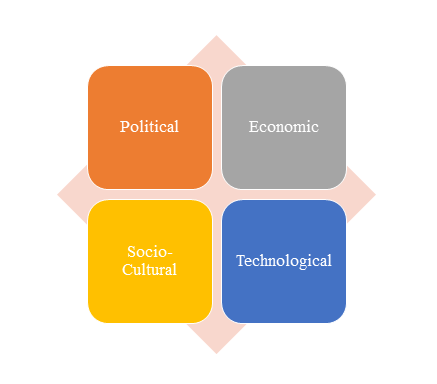
1)PEST Analysis
PEST Analysis is a simple and widely used tool that helps our client analyze the Political, Economic, Socio-Cultural, and Technological changes in their business environment.
- Benefits of a PEST analysis:
- It helps you to spot business opportunities, and it gives you advanced warning of significant threats.
- It reveals the direction of change within your business environment. This helps you shape what you’re doing, so that you work with change, rather than against it.
- It helps you avoid starting projects that are likely to fail, for reasons beyond your control.
- It can help you break free of unconscious assumptions when you enter a new country, region, or market; because it helps you develop an objective view of this new environment.
2)Porter’s Five Force Model Analysis
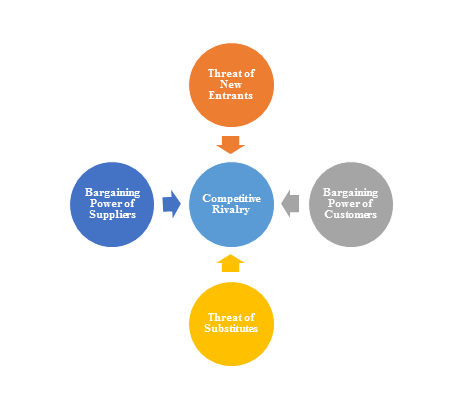
The Porter’s Five Force Model is a tool that can be used to analyze the opportunities and overall competitive advantage. The five forces that can assist in determining the competitive intensity and potential attractiveness within a specific area.
- Threat of New Entrants: Profitable industries that yield high returns will attract new firms.
- Threat of Substitutes: A substitute product uses a different technology to try to solve the same economic need.
- Bargaining Power of Customers: the ability of customers to put the firm under pressure, which also affects the customer's sensitivity to price changes.
- Bargaining Power of Suppliers: Suppliers of raw materials, components, labor, and services (such as expertise) to the firm can be a source of power over the firm when there are few substitutes.
- Competitive Rivalry: For most industries the intensity of competitive rivalry is the major determinant of the competitiveness of the industry.
3)Value Chain Analysis
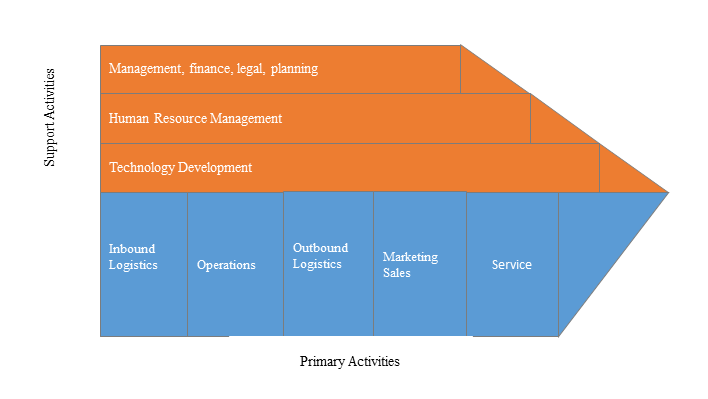
Value chain analysis is a tool to identify activities, within and around the firm and relating these activities to an assessment of competitive strength. Value chain can be analyzed by primary activities and supportive activities. Primary activities include: inbound logistics, operations, outbound logistics, marketing & sales, service. Support activities include: technology development, human resource management, management, finance, legal, planning.
4)SWOT Analysis
SWOT analysis is a tool used to evaluate a company's competitive position by identifying its strengths, weaknesses, opportunities and threats. The strengths and weakness is the inner factor; the opportunities and threats are the external factor. By analyzing the inner and external factors, the analysis can provide the detail information of the position of a player and the characteristics of the industry.
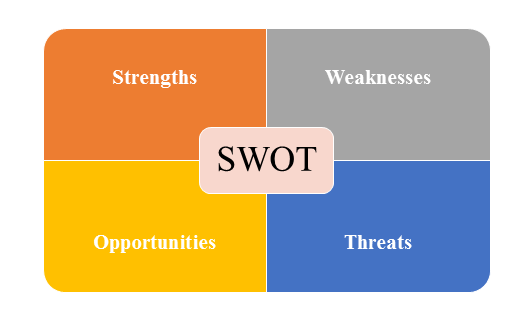
- Strengths describe what the player excels at and separates it from the competition
- Weaknesses stop the player from performing at its optimum level.
- Opportunities refer to favorable external factors that the player can use to give it a competitive advantage.
- Threats refer to factors that have the potential to harm the player.
- Data Sources
| Primary Sources | Secondary Sources |
|---|---|
| Face to face/Phone Interviews with market participants, such as: Manufactures; Distributors; End-users; Experts. Online Survey |
Government/International Organization Data: Annual Report/Presentation/Fact Book Internet Source Information Industry Association Data Free/Purchased Database Market Research Report Book/Journal/News |