Global NiMH Battery Market Strategy & Forecast (2021-2031)
- Single User License (1 Users) $ 3,500
- Team License (2~5 Users) $ 4,500
- Corporate License (>5 Users) $ 5,500
The global Nickel-Metal Hydride (NiMH) battery market size is valued between 3.2 billion USD and 4.0 billion USD in 2026, with a compound annual growth rate (CAGR) of 1.8% to 2.8% through 2031. Manufacturing capacity remains heavily concentrated in the Asia-Pacific corridor—specifically across mainland China (Hunan, Guangdong, Liaoning, Anhui, and Inner Mongolia) and Japan (Takasaki and Tottori). However, capital allocation is actively migrating toward Southeast Asian export hubs in Vietnam, Malaysia, and Thailand to bypass escalating trade barriers and tax policy shifts. The competitive architecture is bifurcated between global Own Brand Manufacturers (OBM) controlling retail shelf space—such as Energizer Holdings, Duracell, Anhui Anfu Battery Technology (Nanfu), GP Industries, Panasonic Energy, and VARTA AG—and specialized B2B/ODM industrial integrators including FDK Corporation, Hunan Corun New Energy, Shenzhen Highpower Technology, Liaoning Time Wanheng, and Arts Energy.
ELECTROCHEMICAL ARCHITECTURE AND PRODUCT TAXONOMY
● Intrinsic Electrochemical Moats
While lithium-ion chemistries (such as lithium iron phosphate and lithium cobalt oxide) capture mass-market electric mobility and portable electronics due to superior gravimetric energy density, strategic audits reveal that NiMH retains an unshakeable engineering moat across three operational vectors:
- Intrinsic Thermal Safety: The water-based alkaline KOH electrolyte is fundamentally non-flammable. This aqueous architecture eliminates the risk of exothermic thermal runaway and oxygen evolution seen in organic carbonate-based lithium cells, reducing bill-of-materials (BOM) complexity by allowing simpler battery management systems (BMS) and lighter mechanical shielding.
- Extreme Thermal Resilience: Standard industrial NiMH formulations operate reliably between -20 degrees Celsius and +70 degrees Celsius. Specialized high-temperature and automotive-grade series extend this operational envelope from -40 degrees Celsius to +85 degrees Celsius, where standard lithium-ion electrolytes suffer from severe lithium plating (at sub-zero temperatures) or solid-electrolyte interphase (SEI) decomposition (at elevated temperatures).
- Environmental Compliance and Cycle Durability: Completely devoid of toxic heavy metals such as cadmium and lead, NiMH cells effortlessly clear regulatory thresholds under the European Union RoHS Directive and the EU Battery Regulation (EU 2023/1542). The chemistry delivers between 500 and 2,000+ deep discharge cycles and tolerates continuous trickle (float) charging over 5 to 10+ year lifespans without catastrophic degradation.
● Form Factor Classification and Technical Dynamics
1. Cylindrical NiMH Battery: Engineered via a spiral-wound (""jelly-roll"") electrode assembly hermetically or semi-sealed with a resealable safety vent inside a nickel-plated cylindrical steel canister. Standardized dimensional footprints include AA, AAA, C, D, 1/2AA, and 2/3A. Cylindrical cells represent the largest production volume across the global industry. Innovation is anchored in Low Self-Discharge (LSD) lattice modifications—utilizing super-lattice AB5/AB2 alloys and sulfonated polyolefin separators to retain 70% to 85% of charge capacity after 12 months of ambient storage. Furthermore, small-format cylindrical cells (such as 1/3AA, 2/3AA, and AA) are experiencing robust B2B pull as multi-cell packs for automotive eCall / T-Box modules. FDK Corporation manufactures high-reliability cylindrical lines (including the industry-benchmark HR-3UTG series) at its Takasaki and Tottori plants in Japan. In China, Liaoning Time Wanheng Co., Ltd. (operating under Nine-Power Energy) produces cylindrical cells certified under the stringent IATF 16949 automotive quality management standard, while Shenzhen Highpower Technology Co., Ltd. supplies high-capacity cylindrical solutions for global consumer electronics and industrial IoT OEMs.
2. Prismatic and Flat Geometry NiMH Battery: Constructed using stacked or flat-wound rectangular positive and negative electrode plates housed within laser-welded steel or high-strength engineered plastic prismatic casings. The prismatic geometry optimizes volumetric packaging density within constrained chassis architectures while maximizing planar surface area. This geometry enables superior thermal dissipation during the high-current pulse discharging and regenerative braking pulse-charging cycles inherent to non-plug-in Hybrid Electric Vehicles (HEVs), notably across Toyota Motor Corporation's Prius, Corolla, Camry, and RAV4 HEV platforms. Hunan Corun New Energy Co., Ltd. and its joint venture Corun PEVE serve as the exclusive domestic supply chain backbone for Toyota's HEV NiMH traction modules in China. Upstream integration is secured through subsidiaries Hunan Corun Power and Foshan Corun Power, which specialize in high-performance HEV positive and negative electrode plates.
3. Coin and Button NiMH Battery: Compact disc-shaped single cells (1.2V) or vertically stacked, spot-welded modular assemblies (2.4V, 3.6V, 4.8V) encapsulated in corrosion-resistant stainless steel button housings, utilizing either mass-type (pressed powder) or foam-metal electrode structures. Engineered specifically for micro-power, continuous trickle-charge environments. Primary use cases encompass real-time clock (RTC) memory backup on industrial motherboards, smart utility metering (gas, water, electricity), wearable medical sensors, and energy-harvesting IoT nodes requiring maintenance-free operation over 5 to 10+ years. GP Industries Limited (Gold Peak Technology Group) and VARTA AG maintain formidable design-in moats in industrial coin cells across smart home and medical device ecosystems. Simultaneously, Anhui Anfu Battery Technology (Nanfu Battery) has aggressively expanded its ""Chuanying"" specialty micro-battery portfolio to capture automotive smart key fobs and IoT backup sockets.
DOWNSTREAM APPLICATION ECOSYSTEM AND OPERATING MODELS
1. Downstream Application Segmentation
● Automotive and Mobility Segment
- HEV Traction Power: Despite aggressive electrification incentives favoring battery electric vehicles (BEVs), non-plug-in HEVs demonstrate remarkable consumer stickiness in North America, Japan, China, and developing markets lacking dense charging infrastructure. NiMH prismatic packs remain the workhorse for high-volume HEV platforms due to their ability to handle high C-rate pulse power, exceptional 10+ year calendar durability, zero fire propagation risk in high-speed collisions, and lower total cost of ownership per kilowatt-hour of usable power buffer.
- Automotive Telematics (T-Box / eCall): Global regulatory mandates requiring automated crash-notification systems (such as the European Union eCall standard and China's GB 19951 / national T-Box standards) dictate that onboard telematics units must feature an independent backup battery. Because T-Box modules are frequently mounted near the vehicle roof shark-fin antenna or behind the dashboard, the backup cell must survive ambient soak temperatures from -40 degrees Celsius in arctic winters to +85 degrees Celsius under direct summer solar load—an operational envelope where NiMH systematically outperforms lithium chemistries.
- Rail Transit and Aviation: Large-format industrial NiMH and sintered/fiber-plate assemblies provide fail-safe auxiliary backup power for railway emergency lighting, automated door actuation, locomotive pantograph lifting controls, and commercial aviation emergency instrumentation.
● Consumer Electronics and Household Appliances Segment
- High-Drain Domestic Hardware: Cylindrical and custom-pack NiMH cells power personal care appliances (rotary and foil shavers, oscillating electric toothbrushes, water flossers), motorized toys, wireless gaming controllers, DECT cordless telephony, vacuum cleaners, and high-lumen LED torches.
- Consumer Retail Replacements: The retail aftermarket for standard AA and AAA cells is increasingly influenced by environmental legislation phasing out single-use alkaline and zinc-carbon primaries in favor of pre-charged LSD NiMH rechargeables capable of replacing hundreds of disposable cells over their lifecycle.
● Others (Industrial, Medical, Infrastructure, and Defense)
- Automated Guided Vehicles (AGVs) and Autonomous Mobile Robots (AMRs): Factory automation facilities increasingly deploy 24V and 48V industrial NiMH battery packs (such as those engineered by FDK Corporation) for warehouse AGVs. Factory safety officers favor NiMH in indoor logistics because its non-flammable chemistry avoids the strict fire-suppression infrastructure and insurance premiums required for lithium-ion charging bays.
- Emergency Lighting and Off-Grid Solar Infrastructure: Commercial building codes mandate independent backup power for exit signs and emergency luminaires. Arts Energy and VARTA AG supply high-temperature cylindrical and button cells engineered to endure constant float charging adjacent to hot LED ballasts or inside outdoor solar streetlamps.
- Medical and Defense Systems: Infusion pumps, portable patient monitors, surgical power tools, and military tactical radios rely on customized NiMH assemblies (supplied by specialists including Ultralife Corporation, Arts Energy, and FDK) where field reliability and immunity to catastrophic thermal failure under ballistic or mechanical impact are paramount.
2. Market Operating Models Analysis
● Own Brand Manufacturer (OBM) Model: OBM entities control the entire downstream value chain, encompassing proprietary cell R&D, automated manufacturing (or tightly managed contract sourcing), consumer brand equity management, and omnichannel retail distribution across big-box mass merchandisers, hardware chains, and global e-commerce platforms. Energizer Holdings and Duracell dominate North American and European retail shelf space through high-visibility point-of-sale displays. GP Industries leverages its GP and GP ReCyko brands across Asia and Europe. In China, Anhui Anfu (Nanfu Battery) commands an unmatched domestic moat, operating a multi-brand distribution network (Nanfu, TENAVOLTS, Chuanying, Fenglan No.1) penetrating over 1 million brick-and-mortar retail terminals.
● ODM / OEM Contract Manufacturing Model: Contract manufacturers engineer and fabricate cells, battery management circuitry, and plastic housings tailored to the exact electrical and mechanical blueprints of global consumer electronics brands, power tool vendors, and supermarket private-label programs. Shenzhen Highpower Technology utilizes a direct B2B OEM/ODM sales model to supply customized NiMH solutions to Fortune 500 technology and personal care conglomerates. Liaoning Time Wanheng (Nine-Power Energy) operates as a primary OEM/ODM cell and pack provider for international cordless power tool and consumer battery brand holders.
● Industrial OEM Matching (B2B Supply Chain Model): Characterized by deep, multi-year engineering design-in cycles. Battery manufacturers establish dedicated production lines (often co-located or synchronized via just-in-time logistics) exclusively serving specific automotive Tier-1 suppliers, vehicle OEMs, or industrial equipment builders. Qualification barriers (such as IATF 16949 automotive audits and 36-month validation testing) create immense switching costs. Hunan Corun and Corun PEVE operate dedicated production lines supplying prismatic HEV traction modules directly into Toyota's Chinese vehicle assembly plants. FDK Corporation and VARTA AG execute direct B2B design-in integration for automotive T-Box telematics modules, smart utility meters, and medical equipment OEMs.
GLOBAL REGIONAL MARKET DYNAMICS AND REGULATORY ARBITRAGE
1. Regional Market Performance and Growth Intervals (2026-2031)
● Asia-Pacific (APAC): APAC serves as both the undisputed global manufacturing engine and the fastest-growing consumption market for NiMH technology, anchored by China, Japan, and South Korea, alongside advanced electronics ODM integration across Taiwan, China. In mainland China, shipments of small rechargeable batteries and upstream active materials continue to expand rapidly, supported by high-density automotive manufacturing, domestic HEV adoption, and the proliferation of smart home IoT ecosystems. To insulate margins from geopolitical friction and domestic tax policy shifts, APAC manufacturers are actively deploying capital into greenfield and brownfield assembly facilities in Vietnam and Malaysia.
- Key Regional Players: Hunan Corun New Energy, FDK Corporation, GP Industries, Shenzhen Highpower Technology, Anhui Anfu (Nanfu Battery), Panasonic Energy, and Liaoning Time Wanheng.
● North America: North America represents a high-value revenue pool bifurcated between high-volume consumer replacement cells (AA/AAA) distributed via warehouse clubs and mass merchandisers, and high-margin B2B industrial packs for warehouse automation (AGVs), medical instrumentation, defense procurement, and HEV replacement/OEM demand. Landed costs for Asian-sourced cells face persistent headwinds from United States Section 301 tariffs, compelling major retail distributors and brand owners to optimize working capital inventory and mandate non-China origin sourcing from their ODM partners.
- Key Regional Players: Energizer Holdings, Duracell, GP Batteries (Americas) Inc., Ultralife Corporation, FDK America, and Highpower Technology.
● Europe: Europe operates as a mature, heavily regulated market where demand is underpinned by strict commercial building safety codes (emergency lighting), smart utility metering rollouts, solar street lighting, and mandatory eCall automotive telematics. In the consumer retail channel, persistent macroeconomic inflation has triggered a pronounced consumer trade-down effect, with shoppers migrating from premium branded cells (such as VARTA, Energizer, and Duracell) toward discounted supermarket and hardware store private-label offerings.
- Key Regional Players: Energizer International / APS NV, Arts Energy, GP Batteries Europe, FDK Europe, and VARTA AG.
● South America: Latin America functions as an emerging growth corridor centered on consumer replacement batteries, telecommunications base-station backup, and national smart metering infrastructure upgrades in Brazil, Mexico, and Chile. Expanding organized retail distribution and rising penetration of personal care electronics sustain steady volume absorption.
- Key Regional Players: Energizer Holdings (which holds and markets the Varta brand rights across Latin America), GP Batteries, and Shenzhen Highpower Technology.
● Middle East and Africa (MEA): The MEA region exhibits strong structural demand for extreme-temperature industrial NiMH formulations. With ambient summer temperatures routinely exceeding 50 degrees Celsius in the Gulf Cooperation Council (GCC) states, lithium-ion batteries face rapid calendar aging in outdoor applications. Consequently, municipal solar street lighting, off-grid telecom repeaters, and smart utility meters in the region rely heavily on high-temperature NiMH cells. While localized geopolitical conflicts periodically disrupt Red Sea maritime logistics, underlying infrastructure procurement remains robust.
- Key Regional Players: Energizer Middle East and Africa LLC, Arts Energy, and Shenzhen Highpower Technology.
2. Regulatory Framework and Policy Shock Analysis
● Phase-Out of Export Tax Rebates in China (The 13% Margin Squeeze)
- Regulatory Mechanism: Pursuant to Joint Announcements issued by China's Ministry of Finance and the State Taxation Administration—specifically Announcement No. 15 of 2024 and Announcement No. 2 of 2026—the Chinese central government has instituted a phased elimination of Value-Added Tax (VAT) export rebates for battery products. The export rebate rate was initially cut from 13% to 9% effective December 1, 2024. It undergoes a second reduction to 6% effective April 1, 2026, and is scheduled for complete elimination (0%) effective January 1, 2027.
- Strategic Impact: For China-based NiMH exporters operating on historical net margins of 5% to 10%, the removal of a 13% VAT rebate represents an existential cost shock. This policy is deliberately designed by Beijing to halt the export of subsidized, low-value manufacturing capacity, curb international anti-dumping friction, and force domestic consolidation. Tier-3 and Tier-4 Chinese cell assemblers lacking pricing power are being forced out of the market. Meanwhile, Tier-1 players (such as Shenzhen Highpower, Liaoning Time Wanheng, and GP Industries' Chinese plants) are executing a three-pronged defense: renegotiating FOB pricing contracts to pass costs to Western buyers, pivoting capacity toward high-margin automotive T-Box cells, and accelerating ""China Plus One"" cell and pack assembly in Vietnam and Malaysia before the January 1, 2027 zero-rebate deadline.
● EU Battery Regulation (EU 2023/1542) and Environmental Directives
- Regulatory Mechanism: Replacing the legacy 2006 Battery Directive, EU Regulation 2023/1542 enforces comprehensive lifecycle governance, including strict hazardous substance ceilings, progressively rising portable battery collection targets (63% by end-2027, 73% by end-2030), mandatory minimum recycled metal content disclosures, carbon footprint declarations, and digital ""Battery Passports"" for industrial and traction batteries exceeding 2 kWh.
- Strategic Impact: NiMH technology enjoys a substantial structural advantage under EU 2023/1542. Because NiMH is completely free of cadmium and lead, it has systematically captured market share vacated by the regulatory ban on industrial and portable Nickel-Cadmium (NiCd) batteries in Europe. Furthermore, the high intrinsic value of nickel, cobalt, and rare-earth elements within spent NiMH cells supports an already profitable, well-established pyrometallurgical and hydrometallurgical recycling loop in Europe, easing compliance with raw material recovery mandates compared to lithium iron phosphate (LFP) cells, which suffer from negative recycling economics.
● Import Tariffs and Trade Protectionism
- Regulatory Mechanism: Evolving tariff walls, anchored by United States Section 301 tariffs on Chinese battery imports and heightened customs scrutiny regarding forced-labor supply chain traceability, have permanently elevated the landed duty cost of Chinese-manufactured cells entering North America.
- Strategic Impact: Multinational OBM buyers (such as Energizer and Duracell) and industrial OEMs have institutionalized dual-sourcing mandates. Suppliers capable of offering tariff-exempt certificates of origin from Japanese facilities (FDK, Panasonic), European plants (Arts Energy, VARTA), or ASEAN manufacturing hubs (GP Industries in Malaysia/Vietnam, Highpower in Vietnam) command a clear commercial arbitrage window over purely domestic Chinese producers.
COMPETITIVE LANDSCAPE AND COMPANY PROFILES
● Energizer Holdings, Inc.
- Market Model: Own Brand Manufacturer (OBM).
- Brand Portfolio: Energizer, Rayovac, Varta (consumer retail rights across Latin America and Asia-Pacific).
- Operational Moat: Energizer commands one of the most extensive global fast-moving consumer goods (FMCG) distribution networks, spanning hundreds of thousands of retail checkouts across North America, Europe, Latin America, and MEA. By acquiring the Rayovac portfolio and international Varta consumer rights, Energizer established a tiered pricing architecture that captures both premium brand-loyal consumers (Energizer Recharge) and value-conscious buyers (Rayovac).
● Duracell Inc.
- Market Model: Consumer OBM and Retail Distribution.
- Brand Portfolio: Duracell Rechargeable (StayCharged / Pre-Charged).
- Operational Moat: Backed by the patient capital structure of Berkshire Hathaway, Duracell leverages immense brand equity in the global consumer battery aisle. Its NiMH portfolio focuses heavily on high-volume, pre-charged AA and AAA formats utilizing advanced Low Self-Discharge (LSD) technology engineered to hold charge for up to 12 months in storage and deliver up to 400+ recharge cycles for high-drain gaming controllers, digital cameras, and household electronics.
● Anhui Anfu Battery Technology Co., Ltd. / Nanfu Battery
- Market Model: OBM (Domestic Retail Leadership) and Domestic/Export OEM.
- Brand Portfolio: Nanfu, TENAVOLTS, Chuanying, Fenglan No.1.
- Operational Moat: Nanfu operates an unrivaled capillary distribution network across mainland China, directly reaching over 1 million retail terminals—from hypermarkets down to rural convenience stores. This distribution moat gives Nanfu extraordinary bargaining power over retail shelf space and insulates its domestic margins from foreign competitors.
● FDK CORPORATION
- Market Model: OBM and Industrial B2B OEM.
- Brand Portfolio: Fujitsu, FDK.
- Operational Moat: A subsidiary of Fujitsu Limited (with strategic alignment in the Taiwanese/Japanese electronics ecosystem), FDK is widely recognized as the technological gold standard in cylindrical NiMH engineering. Operating highly automated manufacturing plants in Takasaki and Tottori, Japan (producing the iconic HR-3UTG series and high-durability industrial cells), FDK enjoys complete vertical integration into rare-earth AB5/super-lattice hydrogen storage alloys via its subsidiary Baotou FDK Co., Ltd. in Inner Mongolia.
● Gold Peak Technology Group Limited / GP Industries Limited
- Market Model: OBM and Industrial B2B.
- Brand Portfolio: GP, GP ReCyko, Pairdeer.
- Operational Moat: GP Industries operates a balanced dual-engine model, combining strong global consumer retail recognition (particularly through its eco-focused GP ReCyko LSD rechargeable line across Europe and Asia) with deep B2B industrial OEM integration in coin cells, custom cylindrical packs, and smart home backup solutions.
● Panasonic Energy
- Market Model: OBM and Automotive B2B OEM.
- Brand Portfolio: Panasonic, Eneloop.
- Operational Moat: Following the historic integration of Sanyo Electric's battery operations, Panasonic controls the ""Eneloop"" brand—universally regarded as the consumer industry benchmark for Low Self-Discharge (LSD) NiMH performance (retaining up to 70% capacity after 10 years of storage and enduring up to 2,100 cycles). Furthermore, Panasonic possesses decades of metallurgic and electrochemical IP in automotive HEV NiMH modules alongside Toyota.
● VARTA AG
- Market Model: Dual OBM (Consumer Retail) and Industrial OEM/B2B.
- Brand Portfolio: VARTA Recharge Accu (Power/Endless), VARTA Industrial Pro, and OEM Custom Solutions.
- Operational Moat: As a premier European battery manufacturer, VARTA commands exceptional brand trust across European consumer retail channels for its ""Ready to Use"" cylindrical cells (AA, AAA, C, D, and 9V blocks). Technologically, VARTA's core industrial moat lies in its proprietary mass-electrode and foam-electrode NiMH button/coin cell architectures, which offer industry-leading volumetric efficiency and minimal self-discharge for micro-power applications.
● Shenzhen Highpower Technology Co., Ltd.
- Market Model: OEM/ODM and Direct B2B Sales.
- Brand Portfolio: Highpower.
- Operational Moat: Shenzhen Highpower has established itself as one of the world's largest volume producers of small cylindrical NiMH cells, operating a streamlined direct-sales OEM/ODM business model serving global Fortune 500 brands in personal care (shavers, oral care), smart home devices, and portable electronics. Highpower's automated manufacturing scale and rigorous quality control allow it to meet the exacting tolerances of tier-one Western and Japanese brand owners.
● Hunan Corun New Energy Co., Ltd.
- Market Model: Industrial B2B Matching and Full Chain Integration.
- Brand Portfolio: Corun, Corun Power, Corun PEVE.
- Operational Moat: Hunan Corun possesses the most deeply integrated vertical supply chain in the global prismatic NiMH sector. Its subsidiary, Changde Corun, is the world's largest producer of battery foam nickel (achieving 2025 HEV foam nickel sales of 2.8508 million square meters). Downstream, its subsidiaries Hunan Corun Power and Foshan Corun Power manufacture positive and negative electrode plates, feeding directly into its joint venture, Corun PEVE, which operates dedicated production lines as the exclusive domestic supplier of NiMH traction battery modules for Toyota's vast HEV manufacturing ecosystem in China.
● Liaoning Time Wanheng Co., Ltd.
- Market Model: OEM/ODM and B2B Industrial Supply.
- Brand Portfolio: Nine-Power Energy.
- Operational Moat: Operating through its core battery subsidiary Nine-Power Energy, Liaoning Time Wanheng is a specialized metallurgical and electrochemical manufacturer focused on high-rate cylindrical NiMH cells (such as SC, C, D, and AA formats). The company holds full IATF 16949 automotive quality management certification, positioning it inside the high-barrier automotive supply chain.
● Arts Energy
- Market Model: Industrial B2B and Niche OBM.
- Brand Portfolio: Arts Energy.
- Operational Moat: Headquartered in Nersac, France (originating from the historic Saft small nickel battery division), Arts Energy is Europe's premier pure-play industrial NiMH specialist. Its operational moat is built on proprietary sintered, plastic-bonded, and foam electrode technologies designed specifically for extreme high-temperature endurance (+70 degrees Celsius to +85 degrees Celsius) and permanent float-charge longevity.
OPPORTUNITIES AND CHALLENGES
● Core Growth Drivers and Strategic Opportunities
- Mandated Automotive Telematics (T-Box / eCall) Expansion: As global vehicle safety regulators enforce mandatory automated crash reporting and connected vehicle diagnostics across passenger and commercial fleets, the addressable market for T-Box backup batteries continues to compound. Because these compact cylindrical or prismatic packs must guarantee pulse transmission at -40 degrees Celsius after a winter crash or endure +85 degrees Celsius roof-mount heat soak for 5 to 8 years without swelling or venting, automotive-grade NiMH remains the undisputed chemistry of choice, delivering gross margins double those of standard consumer cells.
- Non-Plug-In HEV Traction Longevity: Consumer hesitancy regarding BEV charging availability, grid reliability, and residual battery value has sparked a global renaissance in non-plug-in Hybrid Electric Vehicles.Prismatic NiMH traction modules—perfected by the Toyota, Panasonic, and Hunan Corun ecosystem—offer proven 10 to 15-year operational lifespans, exceptional high-rate pulse capture during regenerative braking, and absolute passive safety, securing multi-million-unit annual demand visibility through 2031.
- Smart Infrastructure and Industrial IoT Proliferation: The global rollout of automated utility metering (smart gas and water meters), wireless industrial sensors, motorized smart-home window blinds, and solar outdoor lighting creates structural pull for coin and small cylindrical NiMH cells capable of handling continuous micro-current trickle charging from solar cells or main lines over a decade of service.
- Circular Economy Consumer Transition: Heightened consumer environmental awareness and European regulatory mandates penalizing single-use primary cells are accelerating household conversion from alkaline disposables to LSD NiMH rechargeables that retain up to 85% capacity after a year of storage.
● Structural Inhibitors and Operational Challenges
- The Chinese VAT Rebate Squeeze and Margin Compression: The scheduled drop of China's battery VAT export rebate to 6% on April 1, 2026, and its total elimination (0%) on January 1, 2027, represents an immediate 13% structural cost penalty on Chinese export factories compared to pre-December 2024 baselines. Manufacturers unable to pass this cost to price-sensitive retail buyers face severe balance sheet distress.
- Retail Trade-Down and Private-Label Cannibalization: Prolonged cost-of-living pressures in North America and Europe have altered consumer purchasing behavior in the retail battery aisle. Shoppers are increasingly trading down from premium branded OBM lines (Energizer, Duracell, VARTA) to lower-priced retailer private-label rechargeables, shifting margin capture from battery brand owners to big-box retail syndicates.
- Upstream Commodity Volatility: Cell BOM costs remain heavily exposed to speculative cycles in LME refined nickel, cobalt (used for conductive cathode coatings), and Chinese domestic quotas on rare-earth lanthanum and cerium (essential for AB5 hydrogen storage alloys).
- Targeted Lithium-Ion Encroachment: In medium-drain consumer electronics, cordless power tools, and entry-level personal care appliances operating solely at room temperature, small-format LiFePO4, LCO, and 1.5V buck-regulated USB-C lithium cells continue to erode legacy NiMH volume.
1.1 Report Overview and Scope Definition 1
1.2 Research Methodology and Analytical Framework 3
1.3 Data Sources, Triangulation, and Core Assumptions 4
1.4 Key Abbreviations and Technical Nomenclature 6
Chapter 2 Global NiMH Battery Value Chain and Supply Bottleneck Architecture 7
2.1 Global NiMH Battery Value Chain Architecture 7
2.2 Upstream Raw Material Supply Dynamics (Spherical Nickel Hydroxide, Rare Earth AB5/AB2 Hydrogen Storage Alloys, Cobalt Additives, Alkaline Electrolyte) 8
2.3 Midstream Cell Manufacturing Process and Sintered vs. Foam Nickel Electrode Technologies 10
2.4 Cost Structure Breakdown and Raw Material Price Sensitivity Analysis 11
2.5 Global Patent Landscape and Bipolar NiMH Technological Evolution 12
Chapter 3 Global NiMH Battery Market Dynamics, Capacity, Production, and Trade Logistics 14
3.1 Global NiMH Battery Capacity, Production, and Utilization Rate Analysis (2021-2031) 14
3.2 Global NiMH Battery Consumption Volume and Market Size Valuation (2021-2031) 16
3.3 Average Selling Price (ASP) Trajectories Across Form Factors and Chemistries (2021-2031) 17
3.4 Global Trade Logistics, Import/Export Flows, and Tariff Regimes 18
3.5 Supply Chain Bottlenecks and Rare Earth Mischmetal Dependency Risks 20
Chapter 4 Global NiMH Battery Market Segmentation by Form Factor 21
4.1 Global NiMH Battery Market Overview by Form Factor (Production, Consumption, Market Size, ASP) 21
4.2 Cylindrical NiMH Battery 23
4.3 Prismatic/Flat Geometry NiMH Battery 24
4.4 Coin NiMH Battery 26
Chapter 5 Global NiMH Battery Market Segmentation by Application 27
5.1 Global NiMH Battery Market Overview by Application (Consumption, Market Size, Value Share) 27
5.2 Automotive & Mobility 29
5.3 Consumer Electronics & Household Appliances 30
5.4 Others 32
Chapter 6 Global NiMH Battery Market Segmentation by Market Model 33
6.1 Global NiMH Battery Value Migration and Revenue Distribution by Market Model 33
6.2 ODM/OEM Model 34
6.3 Own Brand Manufacturers (OBM) 35
6.4 Industrial OEM Matching (B2B) 36
Chapter 7 North America NiMH Battery Market Analysis 38
7.1 North America NiMH Battery Market Overview (Capacity, Production, Consumption, Market Size, Import/Export) 38
7.2 United States 40
7.3 Canada 41
7.4 Mexico 42
Chapter 8 Europe NiMH Battery Market Analysis 43
8.1 Europe NiMH Battery Market Overview (Capacity, Production, Consumption, Market Size, Import/Export) 43
8.2 Germany 45
8.3 France 46
8.4 United Kingdom 47
8.5 Italy & Rest of Europe 48
Chapter 9 Asia-Pacific NiMH Battery Market Analysis 49
9.1 Asia-Pacific NiMH Battery Market Overview (Capacity, Production, Consumption, Market Size, Import/Export) 49
9.2 China 51
9.3 Japan 52
9.4 South Korea 53
9.5 India 54
9.6 Southeast Asia 55
Chapter 10 South America and Middle East & Africa NiMH Battery Market Analysis 56
10.1 South America NiMH Battery Market Overview (Production, Consumption, Market Size, Import/Export) 56
10.2 Brazil 57
10.3 Middle East & Africa NiMH Battery Market Overview (Consumption, Market Size, Import/Export) 58
10.4 GCC Countries 59
10.5 South Africa 59
Chapter 11 Corporate Competitive Landscape and Market Share Migration 60
11.1 Global NiMH Battery Competitive Matrix and Tier Stratification 60
11.2 Global Corporate Capacity and Production Share Analysis (2021-2026) 61
11.3 Global Corporate Revenue and Market Share Ranking (2021-2026) 62
11.4 Market Concentration (CR3, CR5, HHI) and Vertical Integration Dynamics 64
Chapter 12 Key Market Players Corporate Intelligence 65
12.1 Energizer 65
12.1.1 Corporate Profile and Strategic Positioning 65
12.1.2 SWOT Analysis 66
12.1.3 NiMH Battery Operational Performance (Capacity, Production, Utilization Rate, Price, Cost, Gross Margin, Market Share) 67
12.1.4 R&D Expenditure and Go-To-Market (GTM) Strategy 68
12.2 Duracell 69
12.2.1 Corporate Profile and Strategic Positioning 69
12.2.2 SWOT Analysis 70
12.2.3 NiMH Battery Operational Performance (Capacity, Production, Utilization Rate, Price, Cost, Gross Margin, Market Share) 71
12.2.4 R&D Expenditure and Go-To-Market (GTM) Strategy 72
12.3 Anhui Anfu Battery Technology Co. Ltd./Nanfu 73
12.3.1 Corporate Profile and Strategic Positioning 73
12.3.2 SWOT Analysis 74
12.3.3 NiMH Battery Operational Performance (Capacity, Production, Utilization Rate, Price, Cost, Gross Margin, Market Share) 75
12.3.4 R&D Expenditure and Go-To-Market (GTM) Strategy 76
12.4 FDK CORPORATION 77
12.4.1 Corporate Profile and Strategic Positioning 77
12.4.2 SWOT Analysis 78
12.4.3 NiMH Battery Operational Performance (Capacity, Production, Utilization Rate, Price, Cost, Gross Margin, Market Share) 79
12.4.4 R&D Expenditure and Go-To-Market (GTM) Strategy 80
12.5 GP Industries Limited 81
12.5.1 Corporate Profile and Strategic Positioning 81
12.5.2 SWOT Analysis 82
12.5.3 NiMH Battery Operational Performance (Capacity, Production, Utilization Rate, Price, Cost, Gross Margin, Market Share) 83
12.5.4 R&D Expenditure and Go-To-Market (GTM) Strategy 84
12.6 Panasonic Energy 85
12.6.1 Corporate Profile and Strategic Positioning 85
12.6.2 SWOT Analysis 86
12.6.3 NiMH Battery Operational Performance (Capacity, Production, Utilization Rate, Price, Cost, Gross Margin, Market Share) 87
12.6.4 R&D Expenditure and Go-To-Market (GTM) Strategy 88
12.7 VARTA AG 89
12.7.1 Corporate Profile and Strategic Positioning 89
12.7.2 SWOT Analysis 90
12.7.3 NiMH Battery Operational Performance (Capacity, Production, Utilization Rate, Price, Cost, Gross Margin, Market Share) 91
12.7.4 R&D Expenditure and Go-To-Market (GTM) Strategy 92
12.8 Shenzhen Highpower Technology Co. Ltd. 93
12.8.1 Corporate Profile and Strategic Positioning 93
12.8.2 SWOT Analysis 94
12.8.3 NiMH Battery Operational Performance (Capacity, Production, Utilization Rate, Price, Cost, Gross Margin, Market Share) 95
12.8.4 R&D Expenditure and Go-To-Market (GTM) Strategy 96
12.9 Hunan Corun New Energy Co. Ltd. 97
12.9.1 Corporate Profile and Strategic Positioning 97
12.9.2 SWOT Analysis 98
12.9.3 NiMH Battery Operational Performance (Capacity, Production, Utilization Rate, Price, Cost, Gross Margin, Market Share) 99
12.9.4 R&D Expenditure and Go-To-Market (GTM) Strategy 100
12.10 Liaoning Time Wanheng Co. Ltd. 101
12.10.1 Corporate Profile and Strategic Positioning 101
12.10.2 SWOT Analysis 102
12.10.3 NiMH Battery Operational Performance (Capacity, Production, Utilization Rate, Price, Cost, Gross Margin, Market Share) 103
12.10.4 R&D Expenditure and Go-To-Market (GTM) Strategy 104
12.11 Arts Energy 105
12.11.1 Corporate Profile and Strategic Positioning 105
12.11.2 SWOT Analysis 106
12.11.3 NiMH Battery Operational Performance (Capacity, Production, Utilization Rate, Price, Cost, Gross Margin, Market Share) 107
12.11.4 R&D Expenditure and Go-To-Market (GTM) Strategy 108
Chapter 13 Technology Substitution Dynamics, Regulatory Compliance, and Strategic Outlook (2027-2031) 109
Table 1.2 Industry Abbreviations and Technical Nomenclature 6
Table 2.1 Upstream Raw Material Specifications and Key Global Suppliers (Nickel Hydroxide, AB5/AB2 Alloys, Separators) 8
Table 2.2 Technical Comparison of Sintered vs. Foam Nickel Positive Electrode Manufacturing Processes 10
Table 2.3 Global NiMH Battery Manufacturing Cost Structure Breakdown by Component (2026) 11
Table 2.4 Core Active Patents in Low Self-Discharge (LSD) and Bipolar NiMH Battery Architecture 12
Table 3.1 Global NiMH Battery Capacity, Production, and Utilization Rate (2021-2031) 14
Table 3.2 Global NiMH Battery Consumption Volume and Market Size Valuation (2021-2031) 16
Table 3.3 Global NiMH Battery Import and Export Volume by Major Trade Hubs (2021-2026) 18
Table 3.4 Tariff Rates and Trade Compliance Barriers for NiMH Battery Cells and Packs across Key Jurisdictions 19
Table 4.1 Global NiMH Battery Production Volume by Form Factor (2021-2031) 21
Table 4.2 Global NiMH Battery Consumption Volume by Form Factor (2021-2031) 21
Table 4.3 Global NiMH Battery Market Size by Form Factor (2021-2031) 22
Table 4.4 Global NiMH Battery Average Selling Price (ASP) by Form Factor (2021-2031) 22
Table 4.5 Global Cylindrical NiMH Battery Market Volume and Value (2021-2031) 23
Table 4.6 Global Prismatic/Flat Geometry NiMH Battery Market Volume and Value (2021-2031) 24
Table 4.7 Global Coin NiMH Battery Market Volume and Value (2021-2031) 26
Table 5.1 Global NiMH Battery Consumption Volume by Application (2021-2031) 27
Table 5.2 Global NiMH Battery Market Size by Application (2021-2031) 28
Table 5.3 Global NiMH Battery Demand in Automotive & Mobility (HEV Power-Split Modules, E-Call Backup) (2021-2031) 29
Table 5.4 Global NiMH Battery Demand in Consumer Electronics & Household Appliances (2021-2031) 30
Table 5.5 Global NiMH Battery Demand in Other Applications (Medical Devices, Telecom Base Stations, Emergency Lighting) (2021-2031) 32
Table 6.1 Global NiMH Battery Market Size and Volume Share by Market Model (2021-2031) 33
Table 6.2 Global ODM/OEM Model NiMH Battery Revenue and Margin Profile (2021-2031) 34
Table 6.3 Global Own Brand Manufacturers (OBM) NiMH Battery Revenue and Margin Profile (2021-2031) 35
Table 6.4 Global Industrial OEM Matching (B2B) NiMH Battery Revenue and Margin Profile (2021-2031) 36
Table 7.1 North America NiMH Battery Capacity, Production, Consumption, and Market Size (2021-2031) 38
Table 7.2 North America NiMH Battery Import and Export Volume (2021-2026) 39
Table 7.3 North America NiMH Battery Consumption Volume by Country (2021-2031) 39
Table 8.1 Europe NiMH Battery Capacity, Production, Consumption, and Market Size (2021-2031) 43
Table 8.2 Europe NiMH Battery Import and Export Volume (2021-2026) 44
Table 8.3 Europe NiMH Battery Consumption Volume by Country (2021-2031) 44
Table 9.1 Asia-Pacific NiMH Battery Capacity, Production, Consumption, and Market Size (2021-2031) 49
Table 9.2 Asia-Pacific NiMH Battery Import and Export Volume (2021-2026) 50
Table 9.3 Asia-Pacific NiMH Battery Consumption Volume by Country/Region (2021-2031) 50
Table 10.1 South America NiMH Battery Production, Consumption, Market Size, and Trade Balance (2021-2031) 56
Table 10.2 Middle East & Africa NiMH Battery Consumption, Market Size, and Import Volume (2021-2031) 58
Table 11.1 Global Top Manufacturers NiMH Battery Capacity (2021-2026) 61
Table 11.2 Global Top Manufacturers NiMH Battery Production Volume (2021-2026) 61
Table 11.3 Global Top Manufacturers NiMH Battery Revenue (2021-2026) 62
Table 11.4 Global Top Manufacturers NiMH Battery Market Share by Revenue (2021-2026) 63
Table 12.1 Energizer NiMH Battery Capacity, Production, Price, Cost and Gross Profit Margin (2021-2026) 67
Table 12.2 Duracell NiMH Battery Capacity, Production, Price, Cost and Gross Profit Margin (2021-2026) 71
Table 12.3 Anhui Anfu Battery Technology Co. Ltd./Nanfu NiMH Battery Capacity, Production, Price, Cost and Gross Profit Margin (2021-2026) 75
Table 12.4 FDK CORPORATION NiMH Battery Capacity, Production, Price, Cost and Gross Profit Margin (2021-2026) 79
Table 12.5 GP Industries Limited NiMH Battery Capacity, Production, Price, Cost and Gross Profit Margin (2021-2026) 83
Table 12.6 Panasonic Energy NiMH Battery Capacity, Production, Price, Cost and Gross Profit Margin (2021-2026) 87
Table 12.7 VARTA AG NiMH Battery Capacity, Production, Price, Cost and Gross Profit Margin (2021-2026) 91
Table 12.8 Shenzhen Highpower Technology Co. Ltd. NiMH Battery Capacity, Production, Price, Cost and Gross Profit Margin (2021-2026) 95
Table 12.9 Hunan Corun New Energy Co. Ltd. NiMH Battery Capacity, Production, Price, Cost and Gross Profit Margin (2021-2026) 99
Table 12.10 Liaoning Time Wanheng Co. Ltd. NiMH Battery Capacity, Production, Price, Cost and Gross Profit Margin (2021-2026) 103
Table 12.11 Arts Energy NiMH Battery Capacity, Production, Price, Cost and Gross Profit Margin (2021-2026) 107
Table 13.1 Performance and TCO Matrix: Bipolar NiMH vs. Standard Prismatic NiMH vs. LFP Cells (2026) 109
Figure 1.1 NiMH Battery Market Research Methodology and Bottom-Up/Top-Down Data Triangulation 3
Figure 2.1 Global NiMH Battery Value Chain and Material Processing Flow 7
Figure 2.2 Historical Price Trajectories of Battery-Grade Nickel and Rare Earth Lanthanum/Cerium Metals (2021-2026) 9
Figure 2.3 Sensitivity of NiMH Cell Gross Margin to Nickel and Rare Earth Alloy Price Fluctuations 11
Figure 3.1 Global NiMH Battery Capacity, Production Volume, and Utilization Rate Trends (2021-2031) 15
Figure 3.2 Global NiMH Battery Consumption Volume and Market Value Forecast (2021-2031) 16
Figure 3.3 Global NiMH Battery Average Selling Price (ASP) Evolution (2021-2031) 17
Figure 3.4 Global NiMH Battery Trade Flow Map and Net Exporting/Importing Regions (2026) 18
Figure 4.1 Global NiMH Battery Consumption Share by Form Factor (2021 vs. 2026 vs. 2031) 22
Figure 4.2 Cylindrical NiMH Battery Demand Breakdown by Cell Size (AA, AAA, C, D, Sub-C) (2026) 23
Figure 4.3 Prismatic/Flat Geometry NiMH Battery Module Deployment in Hybrid Automotive Drivetrains (2021-2031) 25
Figure 4.4 Coin NiMH Battery Consumption in Real-Time Clock (RTC) and Memory Backup Circuits (2021-2031) 26
Figure 5.1 Global NiMH Battery Market Value Share by Application (2021 vs. 2026 vs. 2031) 28
Figure 5.2 Global HEV Production Volume and NiMH Battery Penetration Rate vs. Lithium-Ion (2021-2031) 29
Figure 5.3 Consumer Electronics & Household Appliances NiMH Battery Demand by Sub-Segment (2026) 31
Figure 6.1 Value Migration Across ODM/OEM, OBM, and Industrial OEM Matching (B2B) Models (2021-2031) 33
Figure 7.1 United States, Canada, and Mexico NiMH Battery Market Size Comparison (2021-2031) 40
Figure 8.1 Germany, France, United Kingdom, and Italy NiMH Battery Market Size Comparison (2021-2031) 45
Figure 9.1 China, Japan, South Korea, India, and Southeast Asia NiMH Battery Market Size Comparison (2021-2031) 51
Figure 10.1 South America and Middle East & Africa NiMH Battery Market Size Trajectory (2021-2031) 57
Figure 11.1 Global NiMH Battery Competitive Positioning Matrix (Production Scale vs. Application Diversity, 2026) 60
Figure 11.2 Global NiMH Battery Market Concentration Ratios (CR3 and CR5) Evolution (2021-2026) 64
Figure 12.1 Energizer NiMH Battery Market Share (2021-2026) 68
Figure 12.2 Duracell NiMH Battery Market Share (2021-2026) 72
Figure 12.3 Anhui Anfu Battery Technology Co. Ltd./Nanfu NiMH Battery Market Share (2021-2026) 76
Figure 12.4 FDK CORPORATION NiMH Battery Market Share (2021-2026) 80
Figure 12.5 GP Industries Limited NiMH Battery Market Share (2021-2026) 84
Figure 12.6 Panasonic Energy NiMH Battery Market Share (2021-2026) 88
Figure 12.7 VARTA AG NiMH Battery Market Share (2021-2026) 92
Figure 12.8 Shenzhen Highpower Technology Co. Ltd. NiMH Battery Market Share (2021-2026) 96
Figure 12.9 Hunan Corun New Energy Co. Ltd. NiMH Battery Market Share (2021-2026) 100
Figure 12.10 Liaoning Time Wanheng Co. Ltd. NiMH Battery Market Share (2021-2026) 104
Figure 12.11 Arts Energy NiMH Battery Market Share (2021-2026) 108
Figure 13.1 Discharge Efficiency Comparison of NiMH vs. Lithium-Ion Batteries Across Extreme Operating Temperatures (-30°C to +65°C) 110
Figure 13.2 Hydrometallurgical Closed-Loop Recovery Architecture for Spent NiMH Battery Packs 112
Research Methodology
- Market Estimated Methodology:
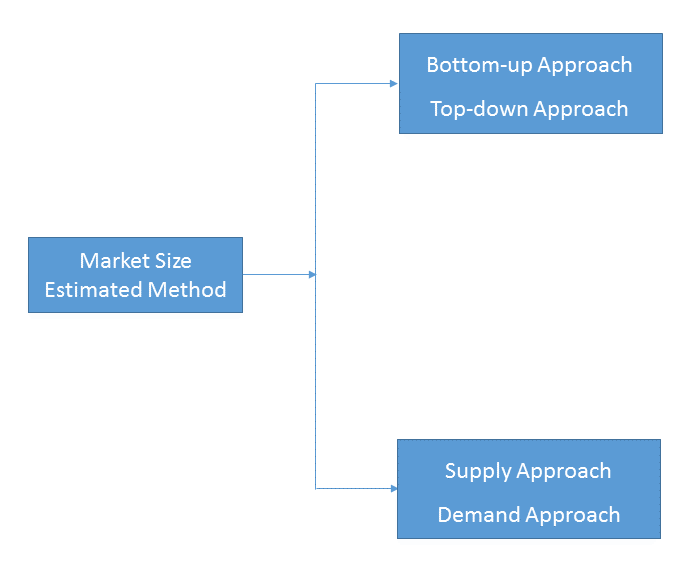
Bottom-up & top-down approach, supply & demand approach are the most important method which is used by HDIN Research to estimate the market size.
1)Top-down & Bottom-up Approach
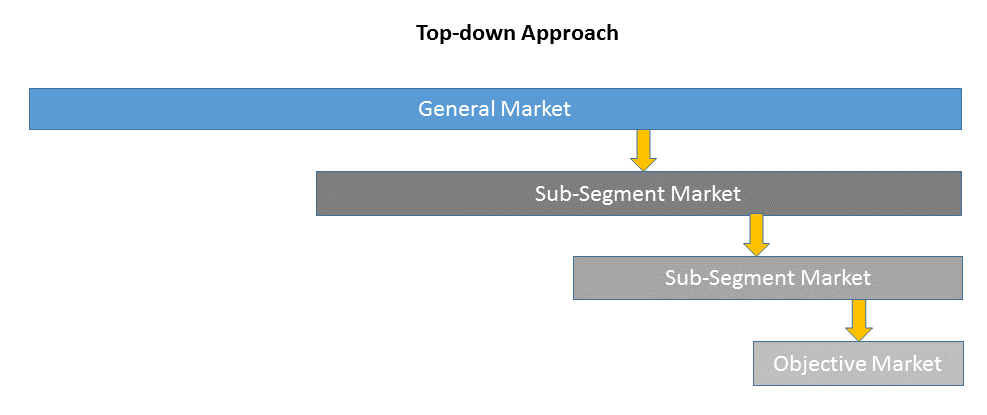
Top-down approach uses a general market size figure and determines the percentage that the objective market represents.
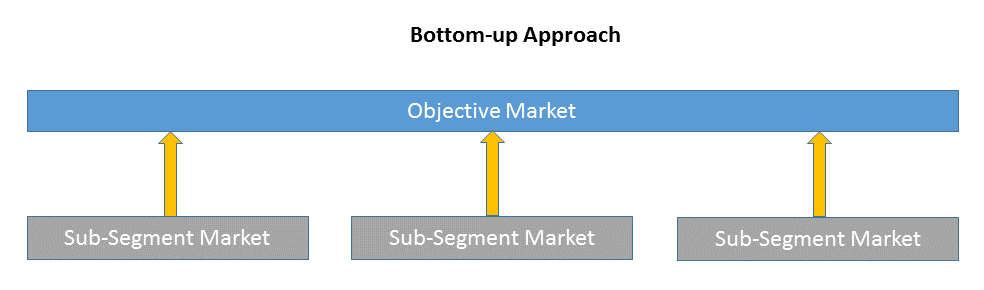
Bottom-up approach size the objective market by collecting the sub-segment information.
2)Supply & Demand Approach
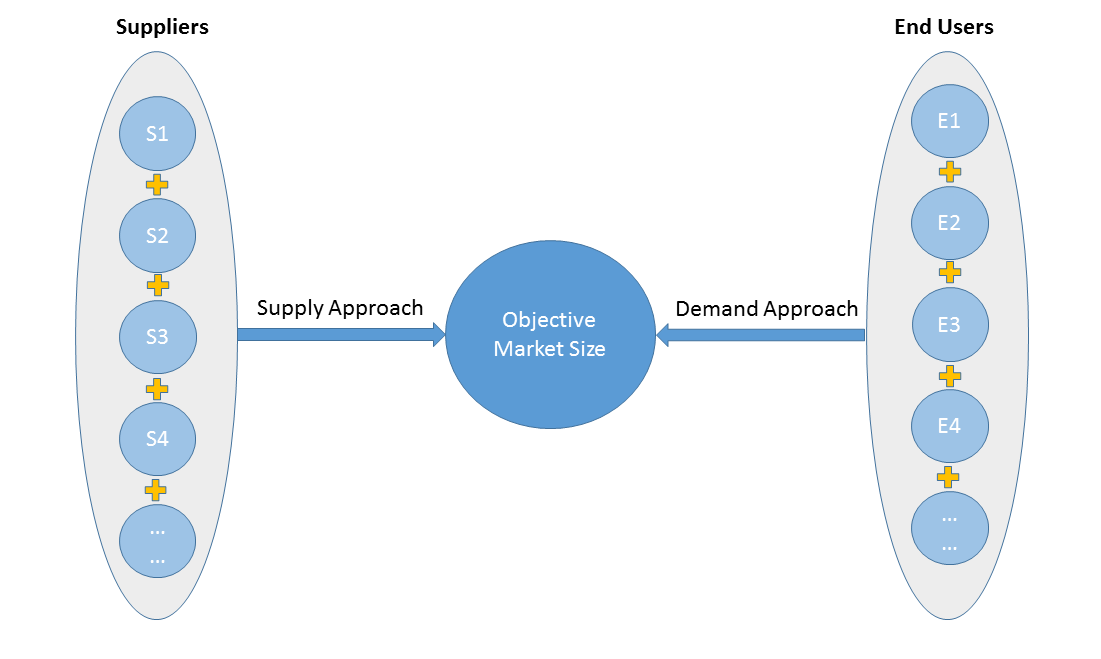
Supply approach is based on assessments of the size of each competitor supplying the objective market.
Demand approach combine end-user data within a market to estimate the objective market size. It is sometimes referred to as bottom-up approach.
- Forecasting Methodology
- Numerous factors impacting the market trend are considered for forecast model:
- New technology and application in the future;
- New project planned/under contraction;
- Global and regional underlying economic growth;
- Threatens of substitute products;
- Industry expert opinion;
- Policy and Society implication.
- Analysis Tools
1)PEST Analysis
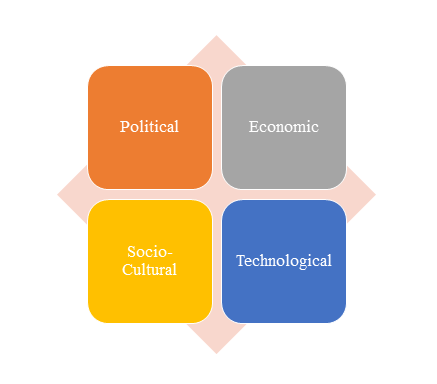
PEST Analysis is a simple and widely used tool that helps our client analyze the Political, Economic, Socio-Cultural, and Technological changes in their business environment.
- Benefits of a PEST analysis:
- It helps you to spot business opportunities, and it gives you advanced warning of significant threats.
- It reveals the direction of change within your business environment. This helps you shape what you’re doing, so that you work with change, rather than against it.
- It helps you avoid starting projects that are likely to fail, for reasons beyond your control.
- It can help you break free of unconscious assumptions when you enter a new country, region, or market; because it helps you develop an objective view of this new environment.
2)Porter’s Five Force Model Analysis
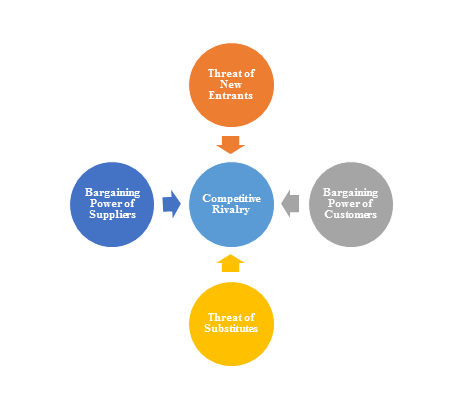
The Porter’s Five Force Model is a tool that can be used to analyze the opportunities and overall competitive advantage. The five forces that can assist in determining the competitive intensity and potential attractiveness within a specific area.
- Threat of New Entrants: Profitable industries that yield high returns will attract new firms.
- Threat of Substitutes: A substitute product uses a different technology to try to solve the same economic need.
- Bargaining Power of Customers: the ability of customers to put the firm under pressure, which also affects the customer's sensitivity to price changes.
- Bargaining Power of Suppliers: Suppliers of raw materials, components, labor, and services (such as expertise) to the firm can be a source of power over the firm when there are few substitutes.
- Competitive Rivalry: For most industries the intensity of competitive rivalry is the major determinant of the competitiveness of the industry.
3)Value Chain Analysis
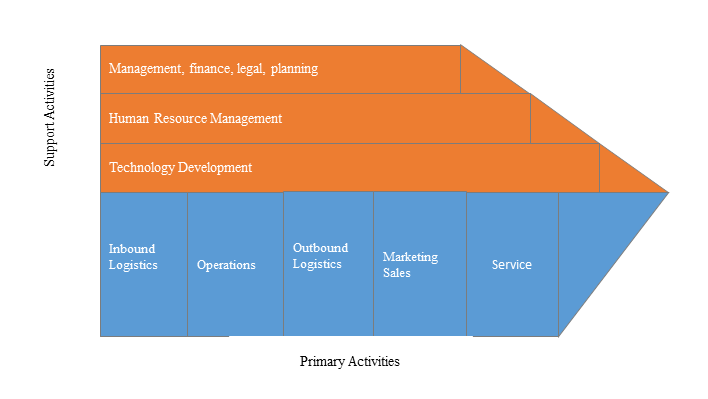
Value chain analysis is a tool to identify activities, within and around the firm and relating these activities to an assessment of competitive strength. Value chain can be analyzed by primary activities and supportive activities. Primary activities include: inbound logistics, operations, outbound logistics, marketing & sales, service. Support activities include: technology development, human resource management, management, finance, legal, planning.
4)SWOT Analysis
SWOT analysis is a tool used to evaluate a company's competitive position by identifying its strengths, weaknesses, opportunities and threats. The strengths and weakness is the inner factor; the opportunities and threats are the external factor. By analyzing the inner and external factors, the analysis can provide the detail information of the position of a player and the characteristics of the industry.
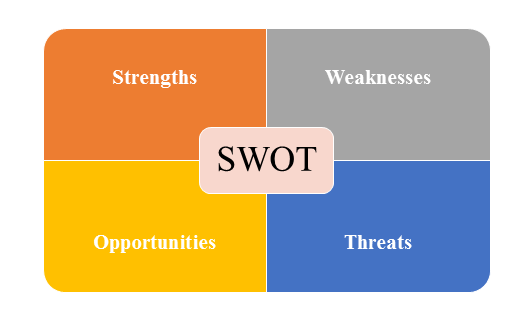
- Strengths describe what the player excels at and separates it from the competition
- Weaknesses stop the player from performing at its optimum level.
- Opportunities refer to favorable external factors that the player can use to give it a competitive advantage.
- Threats refer to factors that have the potential to harm the player.
- Data Sources
| Primary Sources | Secondary Sources |
|---|---|
| Face to face/Phone Interviews with market participants, such as: Manufactures; Distributors; End-users; Experts. Online Survey |
Government/International Organization Data: Annual Report/Presentation/Fact Book Internet Source Information Industry Association Data Free/Purchased Database Market Research Report Book/Journal/News |