Lithium Coin Battery Market Size, Supply Chain & Forecast
- Single User License (1 Users) $ 3,500
- Team License (2~5 Users) $ 4,500
- Corporate License (>5 Users) $ 5,500
The global Lithium Coin Battery market is valued between 1.8 billion USD and 2.8 billion USD in 2026, with a compound annual growth rate (CAGR) of 8% to 14% through 2031.
The global producing center is East Asia (specifically Guangdong, Hubei, and Zhejiang provinces in China, alongside Kyoto and Osaka in Japan) and emerging Southeast Asian manufacturing nodes such as Vietnam. Consumption value remains heavily concentrated in North America and the European Union, where stringent statutory frameworks dictate product design.
TECHNICAL ARCHITECTURE & ELECTROCHEMICAL DIFFERENTIATION
A Lithium Coin Battery is a hermetically sealed, disc-shaped electrochemical power source utilizing metallic lithium or lithium-intercalating compounds as the negative electrode (anode), paired with specialized solid or liquid positive electrode (cathode) active materials and a non-aqueous organic electrolyte. Standardized via international alphanumeric nomenclature (under IEC 60086-3, where CR2032 designates a Chromium/Lithium Manganese Dioxide chemistry measuring 20.0 mm in diameter and 3.2 mm in height), these cells deliver volumetric energy densities between 300 Wh/L and 950 Wh/L. Unlike conventional 1.5V alkaline or zinc-carbon systems that exhibit a sloping discharge curve and elevated gas generation, lithium coin cells operate at a nominal 3.0V (primary) to 3.6V-3.7V (secondary) with a flat discharge plateau and annual self-discharge rates below 1% at room temperature, enabling 5- to 15-year operational lifespans.
1. Primary Lithium Manganese Dioxide Coin Batteries (Li/MnO2, CR Series)
- Electrochemical Structure: Pairs a high-purity metallic lithium foil anode with a heat-treated Electrolytic Manganese Dioxide (EMD) cathode. The separator—typically microporous polypropylene or polyethylene—is saturated with a non-aqueous organic electrolyte composed of cyclic and linear carbonates or ethers, such as propylene carbonate and 1,2-dimethoxyethane, containing dissolved lithium perchlorate (LiClO4) or lithium trifluoromethanesulfonate.
- Operational Profile: Delivers a nominal voltage of 3.0V across standard formats including CR2032, CR2025, CR2016, CR2430, CR2450, CR1632, and CR1220. Standard consumer and industrial variants operate from -20 degrees Celsius (or -30 degrees Celsius depending on electrolyte viscosity) to +70 degrees Celsius or +85 degrees Celsius.
- Economic Moat: Represents the foundational volume driver of the global market, offering an optimal cost-to-pulse-current ratio. Leading suppliers include EVE Energy, Power Glory (Lijia), Anhui Anfu (Nanfu/Chuanying), Panasonic Energy, Maxell, Energizer, Duracell, GP Industries, VARTA, Renata, Golden Power, and FDK Corporation.
2. Primary Lithium Carbon Monofluoride Coin Batteries (Li/CFx, BR Series)
- Electrochemical Structure: Combines a metallic lithium anode with a poly-carbon monofluoride (CFx) cathode synthesized via the high-temperature fluorination of carbon polymorphs.
- Operational Profile: Operates at a nominal voltage of 3.0V (with an open-circuit voltage of approximately 3.1V to 3.2V) across geometries such as BR2032, BR2330, BR2477, and specialized tabbed/pin configurations. The carbon-fluorine covalent bond imparts exceptional chemical and thermal stability, preventing cathode degradation and electrolyte oxidation at elevated temperatures.
- Economic Moat: Engineered for extreme thermal tolerance (-40 degrees Celsius to +125 degrees Celsius) and ultra-low self-discharge (<0.5% per year), supporting 10- to 15-year maintenance-free deployment. While Li/CFx commands a significant unit price premium over CR series cells and exhibits higher internal impedance at low temperatures, it occupies an unassailable moat in automotive TPMS, emergency call (eCall) telematics, and aerospace telemetry. Key manufacturers include Maxell, Panasonic Energy, Power Glory (Omnergy), and EVE Energy.
3. Secondary Rechargeable Lithium Coin & Button Micro Batteries (ML, LIR, Solid-State)
- Electrochemical Structure: Replaces metallic lithium foils with lithium-intercalating anodes (carbon, synthetic graphite, or lithium-aluminum alloys) and transition metal oxide cathodes, including Lithium Cobalt Oxide (LCO), Lithium Nickel Manganese Cobalt Oxide (NMC), or lithiated manganese oxides. These are housed in laser-welded or precision-crimped stainless steel coin/button casings.
- Operational Profile: ML series (Manganese Lithium rechargeable) cells operate around 3.0V, whereas LIR series and steel-cased button lithium-ion cells operate at a nominal 3.6V to 3.7V, with upper charge cut-off voltages ranging from 4.2V to 4.5V. Cycle life spans 300 to over 1,200 charge-discharge cycles at 80% State of Health (SOH).
- Technological Frontier: To eliminate transient voltage drops during high-pulse RF transmissions (such as NB-IoT, Bluetooth Low Energy, and Zigbee), manufacturers are deploying hybrid architectures that pair primary coin cells with supercapacitors or battery capacitors (exemplified by EVE Energy's SPC and ES composite systems, and Power Glory's LSC series). At the upper echelon of R&D, Maxell has commercialized sulfide-based all-solid-state coin batteries, replacing flammable liquid organic electrolytes with solid ceramic/sulfide electrolytes to achieve zero leakage, non-flammability, and stable cycling across -40 degrees Celsius to +125 degrees Celsius. Key players across the rechargeable micro segment include EVE Energy, Maxell, Power Glory, VARTA, SYNergy ScienTech Corp., and specialized consumer audio suppliers.
DOWNSTREAM APPLICATION MATRIX & VALUE MIGRATION
1. Consumer Electronics & Smart Home
- Core Applications: Automotive remote keyless entry (RKE) fobs, smart door locks, True Wireless Stereo (TWS) Bluetooth earbuds, smartwatches, fitness trackers, wireless remote controls, gas stove pulse igniters, digital scales, calculators, and motherboard CMOS real-time clock (RTC) backup.
- Technical & Commercial Dynamics: While consumer replacement demand provides steady baseline cash flow, retail channel margins are heavily scrutinized. Procurement is dictated by anti-leakage guarantees (preventing terminal corrosion in high-drain smart fobs), child-secure bitter coatings such as denatonium benzoate (Bitrex), and compliance with mandatory child-resistant blister packaging. Furthermore, EU Regulation 2023/1542 is forcing wearable and small appliance designers to transition from sealed pouch batteries back to replaceable steel-cased button and coin cells.
2. Automotive & Smart Mobility
- Core Applications: Direct Tire Pressure Monitoring Systems (TPMS) mounted inside the wheel rim, Electronic Toll Collection (ETC/eTag) transponders, automated Emergency Call (eCall) modules, ultra-wideband (UWB) digital car keys, and electronic control unit (ECU) memory backup.
- Technical & Commercial Dynamics: Automotive TPMS represents one of the highest-margin B2B segments in the micro-battery industry. Cells mounted directly on tire valves experience centrifugal forces exceeding 1,500 G, severe mechanical vibration, and thermal extremes ranging from -40 degrees Celsius on winter asphalt to +125 degrees Celsius during heavy braking. Standard consumer CR2032 cells fail rapidly under these conditions due to electrolyte vaporization and seal deformation. Automotive-grade CR and BR cells utilize specialized high-boiling-point organic solvents, reinforced heat-resistant gaskets, and laser-welded tabs, requiring 18- to 36-month automotive Tier-1 qualification cycles (under AEC-Q200 equivalent reliability testing).
3. IoT & Industrial Automation
- Core Applications: Smart utility meters (water, gas, electricity, and heat meters), Electronic Shelf Labels (ESL) in retail automation, active Radio Frequency Identification (RFID) asset tracking tags, cold-chain logistics loggers, programmable logic controller (PLC) RAM backup, absolute rotary encoders on industrial robotics, and Automated Guided Vehicles (AGVs).
- Technical & Commercial Dynamics: The global rollout of ESLs across North American, European, and East Asian supermarkets is a massive volume catalyst. Each digital price tag utilizes one to two CR2450 or CR2032 cells engineered to last 5 to 7 years while executing multiple daily e-paper screen refreshes via high-pulse wireless protocols. Similarly, industrial encoders and smart meters require 10+ year maintenance-free lifespans, driving demand for hybrid Li/MnO2-capacitor modules that prevent passivation-induced voltage delay.
4. Medical & Healthcare Devices
- Core Applications: Continuous Glucose Monitoring (CGM) epidermal patches, Automated External Defibrillators (AEDs), wearable insulin delivery pumps, ambulatory infusion pumps, smart autoinjectors, digital clinical thermometers, capsule endoscopes, and implantable/wearable cardiac telemetry sensors.
- Technical & Commercial Dynamics: Medical device electrification—led by over-the-counter and prescription CGM patches—represents the fastest-growing high-specification niche. A CGM sensor patch operates on the skin for 10 to 15 days, requiring a micro coin cell (such as custom low-profile CR1620, CR1632, or specialized manganese/silver/lithium variants) that exhibits zero voltage drop during continuous interstitial fluid data transmission via Bluetooth Low Energy (BLE). Suppliers face stringent FDA and EU MDR regulatory audits, requiring full batch traceability, zero defect tolerance, and automated optical/electrical aging inspections.
COMMERCIAL MONETIZATION & MARKET MODELS
1. ODM / OEM Contract Manufacturing Model
- Operational Mechanics: Manufacturers engineer and assemble coin cells to the exact electrochemical specifications, tab/pin welding geometries, and blister packaging designs dictated by third-party brand owners, international supermarket chains (e.g., Walmart, Carrefour, Tesco, Metro, Costco), or consumer electronics brands.
- Financial & Strategic Profile: Characterized by high asset turnover, low selling, general, and administrative (SG&A) expenses, and thinner gross margins (typically 12% to 22%). Profitability relies on extreme manufacturing scale, automated high-speed punching/crimping lines, and upstream raw material cost pass-through mechanisms. Key practitioners include Power Glory Battery Tech, Sichuan Changhong NewEnergy, Zhejiang Hengwei, Zhejiang Mustang, and Guangzhou Tiger Head.
2. Own Brand Manufacturer (OBM) Model
- Operational Mechanics: Vertically integrated producers or brand holding companies design, manufacture (or contract-manufacture), market, and distribute cells globally under proprietary trademarks across brick-and-mortar retail, pharmacy networks, and direct-to-consumer e-commerce platforms (Amazon, Tmall, JD.com, TikTok).
- Financial & Strategic Profile: Commands premium gross margins (often exceeding 40% to 55% at the brand level) supported by decades of consumer brand equity, point-of-sale checkout visibility, and patented safety packaging. However, OBMs must absorb heavy slotting fees, advertising expenditures, and working capital inventory risks. Dominant OBMs include Energizer (Energizer, Rayovac, Eveready), Duracell, Anhui Anfu (Nanfu, Chuanying), Panasonic, Maxell, VARTA, GP Industries (GP, Pairdeer), Golden Power, and EVE Energy.
3. Industrial OEM Matching Model (B2B Direct Supply)
- Operational Mechanics: Direct engineering collaboration with Tier-1 automotive suppliers (e.g., Continental, Bosch, Denso), medical device OEMs (e.g., Abbott, Dexcom, Medtronic), and industrial automation leaders.
- Financial & Strategic Profile: Requires 12 to 24+ months of rigorous environmental, thermal, and lifecycle qualification to secure design-in inclusion on a client's Bill of Materials (BOM). Once locked into a medical or automotive BOM, switching costs are prohibitively high for the buyer, granting the battery supplier multi-year volume visibility, immune from retail price wars, with gross margins ranging from 28% to 45%. Leading B2B matching specialists include Maxell, Panasonic Energy, EVE Energy, Renata SA, Power Glory (Omnergy), VARTA, FDK Corporation, and SYNergy ScienTech Corp.
REGIONAL MARKET DYNAMICS & REGULATORY ARBITRAGE
1. North America (United States, Canada, Mexico): North America represents the highest-margin consumer replacement market globally, alongside a rapidly expanding B2B market for medical CGM patches, retail ESLs, and smart home security sensors. In the United States, CPSC enforcement of 16 CFR Part 1263 (under Reese's Law) mandates that all consumer lithium coin cells (specifically those 32 mm or smaller in diameter) utilize child-resistant packaging compliant with 16 CFR 1700.15 poison prevention standards, alongside dual-action or tool-secured battery compartments in end-use devices. This regulatory wall has effectively purged low-cost, uncertified white-label imports from major North American retail shelves, consolidating pricing power in the hands of Energizer and Duracell. Meanwhile, Canada and Mexico function as vital automotive manufacturing corridors under the USMCA framework, driving steady Tier-1 OEM procurement of high-temperature TPMS and RKE coin cells.
2. Asia-Pacific: APAC serves as both the undisputed manufacturing workshop of the world and the fastest-growing consumption hub.
- China: Anchored by the NDRC Catalogue for Guiding Industry Restructuring (2024 Edition) and the MIIT Light Industry Steady Growth Plan (2025-2026), China dominates global output. The domestic market is bifurcated between Anhui Anfu/Nanfu—whose Chuanying brand commands domestic retail and smart car key replacement channels—and massive B2B/ODM industrial exporters led by EVE Energy, Power Glory, Sichuan Changhong NewEnergy, Zhejiang Hengwei, Zhejiang Mustang, and Guangzhou Tiger Head.
- Japan: Functions as the global R&D sanctuary for advanced materials and ultra-reliable micro batteries. Following Maxell's absorption of Murata Manufacturing's micro primary battery business on March 1, 2026, Japan's triad of Maxell, Panasonic Energy, and FDK Corporation exercises near-monopolistic control over ultra-high-reliability automotive BR series cells and solid-state coin technologies.
- Taiwan (China): Operates as a specialized design and manufacturing cluster for customized micro-lithium polymer, button-type, and pin-type rechargeable batteries. Firms such as SYNergy ScienTech Corp. supply bespoke rechargeable micro cells to global Bluetooth audio, wearable, and medical device OEMs, while Taiwan, China's broader electronics sector (seen in Silitech's March 2025 acquisition of a 45.07% stake in FDK) deepens cross-border supply chain integration.
- ASEAN & India: Vietnam, Malaysia, and Thailand are rapidly absorbing contract manufacturing capacity migrating out of China due to US tariffs and China's export VAT rebate elimination, while smart metering rollouts in India drive volume demand for primary lithium cells.
3. Europe: Europe is the world's premier regulatory standard-setter. The implementation of Regulation (EU) 2023/1542 (replacing Directive 2006/66/EC) is fundamentally reshaping product engineering. By mandating that portable batteries in consumer appliances must be readily removable and replaceable by the end-user, the EU has created a structural tailwind for standardized coin and button cells over integrated pouch batteries. Furthermore, strict Extended Producer Responsibility (EPR) collection targets, heavy metal restrictions, and carbon footprint declarations favor compliant European incumbents such as VARTA AG (Germany) and Renata SA (Switzerland), alongside established multinational brands (Energizer, Duracell, Panasonic, GP). Germany, France, and the UK anchor B2B demand across automotive telematics (mandatory eCall systems), factory automation encoders, and smart utility grids, while European supermarket chains maintain exceptionally high private-label penetration serviced by Asian ODMs.
4. South America: South America remains primarily an import-dependent consumer replacement and aftermarket automotive market, though industrial B2B demand is accelerating via smart grid modernization (particularly smart water and electricity meter deployments in Brazil and Chile) and agricultural IoT telemetry. Consumer retail channels are dominated by Energizer (leveraging the Rayovac, Eveready, and regional Varta trademarks), Duracell, and Panasonic, competing against price-competitive private-label imports sourced from Chinese contract manufacturers.
5. Middle East and Africa: The MEA region exhibits a sharp socio-economic duality. Gulf Cooperation Council (GCC) economies—led by the United Arab Emirates and Saudi Arabia—are executing capital-intensive smart city, automated retail (ESL), and cold-chain logistics infrastructure projects, generating robust demand for industrial IoT coin cells capable of surviving high ambient desert temperatures. Conversely, developing Sub-Saharan African markets consume high volumes of entry-level CR2032 and alkaline button cells for basic consumer electronics, medical thermometers, and small appliances, where Chinese export brands like Guangzhou Tiger Head (under the Tiger Head and 555 brands) and Golden Power maintain entrenched distribution networks.
COMPETITIVE LANDSCAPE & COMPANY DOSSIERS
1. Energizer Holdings, Inc.: Global OBM powerhouse marketing primary lithium coin cells (CR2032, CR2025, CR2016, CR2450) alongside cylindrical Ultimate Lithium, alkaline, zinc-air, and silver oxide lines under the Energizer, Rayovac, Eveready, and Varta (Latin America and APAC) brands. Energizer's primary moat lies in its unmatched North American and European retail distribution footprint (Walmart, Amazon, Costco, Home Depot) and its rapid capital deployment into Reese's Law compliant 16 CFR Part 1263 child-resistant packaging, combining secure blister architectures with bitterant and color-alert dyes ( alerting caregivers via blue oral dye upon contact with saliva). By leveraging Chinese ODM partners (such as Changhong NewEnergy) for baseline cell production while controlling brand equity and packaging IP, Energizer insulates its retail operating margins.
2. Duracell Inc.: Tier-1 global OBM and selective B2B supplier (via its Procell professional line). Offers a comprehensive primary Li/MnO2 coin cell portfolio (CR2032, CR2025, CR2016, CR2450, CR2430, CR1632, CR1620, CR1220). Backed by Berkshire Hathaway's balance sheet, Duracell pioneered the mass commercialization of non-toxic Bitrex (denatonium benzoate) ring coatings on lithium coin cells to deter pediatric ingestion. Strategically, Duracell is aggressively expanding its Procell Constant and Intense B2B lines—engineering cells specifically matched to the pulse-versus-continuous drain profiles of medical telemetry, hospitality smart locks, and security sensors, thereby capturing institutional maintenance, repair, and operations (MRO) budgets.
3. Anhui Anfu Battery Technology Co. Ltd. / Nanfu: Dominant domestic OBM and growing industrial OEM supplier. While historically anchored by its Polymer Ring alkaline batteries (holding the #1 retail share in China for 33 consecutive years through 2025), Anfu aggressively expanded into lithium coin batteries via its specialized sub-brand Chuanying, alongside Nanfu, Fenglan 1, Yiyuan, TRUSVOLT, and TENAVOLTS. Anfu executed a textbook consumer sub-brand segmentation strategy with Chuanying, engineering graphene-enhanced and high-pulse Li/MnO2 coin cells tailored explicitly for smart car keys, TPMS, smart home sensors, and medical CGM devices. Leveraging Nanfu's access to over three million offline retail terminals across China, Chuanying rapidly displaced imported Japanese brands in the domestic automotive aftermarket, while expanding B2B OEM supply to domestic tech giants such as Huawei and Midea.
4. FDK CORPORATION: OBM and B2B Industrial OEM specialist producing primary lithium coin and cylindrical batteries, high-durability NiMH rechargeable cells, alkaline batteries, and electronic power storage modules. Formerly a subsidiary of Fujitsu Limited, FDK underwent a major corporate ownership restructuring in March 2025 when Taiwan, China-based Silitech Technology Corporation (an affiliate of the Lite-On Group) acquired a 45.07% equity stake. FDK's operational moat rests on Japanese precision engineering in high-voltage, low-self-discharge primary lithium cells for smart meters, automotive electronics, and industrial PLC backup. The Silitech integration opens direct B2B cross-selling channels into Taiwanese and global automotive and computing OEMs.
5. GP Industries Limited: Hybrid global OBM and OEM/Joint-Venture operator. Produces primary lithium coin cells, alkaline, carbon-zinc, and Recyko NiMH batteries under the GP brand globally and the Pairdeer brand in China via its 70%-owned subsidiary, Zhongyin (Ningbo) Battery Co., Ltd. To mitigate tariff exposures and China's export VAT rebate cuts, GP Industries has systematically diversified its manufacturing footprint across Malaysia, Vietnam, and China. The company is pivoting its lithium coin portfolio toward high-drain IoT, smart home locks, and retail ESL contracts across Europe and Asia, utilizing automated production lines that guarantee tight batch-to-batch internal resistance consistency.
6. Panasonic Energy Co., Ltd.: Global Tier-1 B2B Industrial OEM matching leader and premium OBM. Manufactures a complete spectrum of primary Li/MnO2 (CR series), primary Li/CFx (BR series), and secondary rechargeable lithium coin batteries (ML and VL series), alongside cylindrical lithium and EV power batteries. Panasonic commands an entrenched technological and qualification moat in the global automotive TPMS, eCall, and industrial memory backup sectors. Its high-temperature BR series coin cells—capable of continuous operation at +125 degrees Celsius—are design-locked into the BOMs of top Japanese, European, and North American automotive Tier-1s. By maintaining high-speed, zero-defect manufacturing in Japan and Indonesia, Panasonic insulates its micro-battery margins from low-end consumer price wars.
7. VARTA AG: Premier European OBM and B2B Industrial OEM partner. Produces primary 3.0V Li/MnO2 coin cells (CR2032, CR2025, CR2016, CR2430, CR2450) including custom PCB-mountable tabbed/SMD variants, alongside silver oxide, zinc-air hearing aid, and rechargeable micro-lithium cells (CoinPower series). Following financial restructuring to stabilize its balance sheet after heavy capital expenditures in e-mobility and energy storage, VARTA is refocusing on its core, cash-generative micro-battery and household franchises. VARTA's highly automated German production facilities provide European automotive, medical, and smart metering OEMs with local, EU 2023/1542-compliant supply chain security and low carbon footprint traceability.
8. Maxell, Ltd.: Global technology pioneer operating on a B2B Industrial OEM matching and OBM model. Product architecture spans primary CR and heat-resistant BR lithium coin cells, silver oxide button cells, rechargeable ML/CLB coin batteries, and commercialized sulfide-based all-solid-state coin batteries (PSB series). Maxell executed the industry's most consequential consolidation move in recent years by acquiring Murata Manufacturing's micro primary battery business (originally Sony's battery division) effective March 1, 2026. This acquisition consolidates massive Japanese cleanroom capacity, patents, and medical/automotive client rosters under Maxell's roof. Furthermore, Maxell holds a multi-year technological lead in commercial sulfide-based solid-state micro batteries, capturing high-margin industrial IoT, sterilization-grade medical, and extreme-heat infrastructure sockets.
9. Golden Power Group Holdings Limited: Hybrid OBM (under the Golden Power brand) and private-label OEM/ODM manufacturer of micro button cells (lithium and alkaline), cylindrical primary batteries, and rechargeable cells. Golden Power leverages decades of cost-efficient manufacturing scale in the Pearl River Delta to serve private-label retail chains, medical thermometer makers, and electronic toy/novelty importers across Europe, North America, and Asia. To offset domestic export margin compression, the group is upgrading its automated dry-room lines to produce higher-capacity, mercury-free, and leak-proof CR2032 and CR2450 variants for smart home applications.
10. Sichuan Changhong NewEnergy Technology Co. Ltd.: Large-scale ODM/OEM contract manufacturer and domestic brand operator producing primary alkaline, carbon-zinc, high-rate cylindrical lithium-ion, and micro lithium coin batteries. Backed by the state-owned electronics conglomerate Sichuan Changhong Electric, Changhong NewEnergy serves as a strategic ODM manufacturing partner for global Tier-1 brands, including Energizer. By integrating automated high-speed coin cell assembly with rigorous quality control protocols aligned with Western brand audits, Changhong secures high-volume baseline utilization while expanding its B2B footprint in smart home and industrial sensing.
11. Zhejiang Hengwei Battery Co. Ltd.: Dedicated export-oriented ODM/OEM contract manufacturer specializing in high-performance alkaline batteries (LR03, LR6, LR14, LR20, 6LR61), carbon-zinc cells, and Li/MnO2 coin batteries.
12. Guangzhou Tiger Head Battery Group Co., Ltd.: State-owned enterprise and one of China's largest historical dry cell exporters, operating a dual OBM (Tiger Head and 555 brands) and ODM/OEM contract manufacturing model across 3.0V primary lithium coin cells (CR2032, CR2025, CR2016, CR1632, CR1220) and alkaline/carbon-zinc batteries. Tiger Head possesses an unmatched distribution moat across emerging markets in Sub-Saharan Africa, the Middle East, and Southeast Asia. Recognizing the structural decline of legacy carbon-zinc cells in developing nations, Tiger Head is utilizing its entrenched overseas trading networks to cross-sell high-margin lithium coin cells and solar/storage products, while servicing international supermarket private-label contracts.
13. Zhejiang Mustang Battery Co. Ltd.: Export-driven ODM/OEM manufacturer of alkaline, carbon-zinc, and newly scaled lithium coin battery lines for multinational retail chains and brand owners. Mustang demonstrated exceptional strategic agility in March 2025 by establishing overseas manufacturing operations in Vietnam. This geographic arbitrage allows Mustang to bypass North American tariff barriers and insulate its international ODM contracts from China's April 2026 and January 2027 export VAT rebate reductions, positioning the firm as a preferred supply chain de-risking partner for Western retailers.
14. Renata SA: Ultra-precision B2B Industrial OEM specialist and OBM (Renata brand). Produces an exhaustive array of 3.0V Li/MnO2 coin cells (from miniature CR1025 and CR1216 up to high-capacity CR2450N and CR2477N), SMD/tabbed variants, silver oxide watch cells, and rechargeable micro cells.
15. Power Glory Battery Tech (Hubei) Co. Ltd.: Premier global ODM for top international consumer battery brands alongside a powerhouse B2B Industrial OEM operation under its proprietary Lijia and Omnergy trademarks. Portfolio spans CR series Li/MnO2, BR series Li/CFx, ML series rechargeable coin cells, super lithium-ion capacitors (LSC), and ultra-thin lithium-manganese pouch cells.
16. EVE Energy Co., Ltd.: Global B2B Industrial OEM matching titan and OBM (EVE brand). Portfolio encompasses primary Li/MnO2 coin and cylindrical cells, Li/SOCl2 batteries, high-temperature automotive cells, SPC battery capacitors, ES composite power systems, and rechargeable steel-cased button/bean lithium-ion cells.
17. SYNergy ScienTech Corp.: Specialized B2B Industrial OEM designer and manufacturer of customized rechargeable micro-lithium polymer, shaped, pin-type, and coin/button-type lithium-ion batteries.
OPPORTUNITIES & RISKS
1. Growth Opportunities
- The ESL and Smart Metering Replacement Supercycle: Retail labor inflation in North America, Europe, and East Asia has turned Electronic Shelf Labels from a luxury into an operational necessity. With hundreds of millions of ESLs deployed globally—each housing 1 to 2 CR2450 or CR2032 cells on a 5-year replacement cycle—an annuity-like B2B replacement wave is compounding alongside greenfield installations. Similarly, smart water, gas, and heat meter mandates are driving multi-decade demand for hybrid coin/capacitor architectures.
- Medical CGM Democratization: As Continuous Glucose Monitoring expands from Type 1 diabetics to Type 2 insulin/non-insulin patients and general metabolic wellness consumers, annual CGM patch volumes are scaling into the hundreds of millions. Because each disposable 14-day sensor patch requires a dedicated, ultra-reliable micro coin cell, medical-grade battery suppliers with FDA-compliant traceability (such as EVE Energy, Renata, Maxell, and Anfu/Chuanying) enjoy exceptional pricing power and volume visibility.
- Regulatory Right-to-Repair Arbitrage (EU 2023/1542): The European Union's mandate requiring end-user battery replaceability is a hidden structural windfall for the coin and button cell sector. Hardware designers of ultra-compact wearables, trackers (such as Apple AirTag and Samsung Galaxy SmartTag equivalents), and personal care appliances are increasingly standardizing around socketed primary CR series or rechargeable LIR steel-cased button cells to ensure European statutory compliance without redesigning global SKUs.
- AI Edge Wearables & Solid-State Commercialization: The emergence of AI-integrated smart rings, smart glasses, and neural-interface wearables requires volumetric energy densities approaching 800 to 950 Wh/L alongside absolute thermal safety on the human body. This is accelerating capital allocation toward laser-welded steel-cased button cells and sulfide-based solid-state micro batteries.
2. Structural Risks
- The 2026-2027 China Export VAT Rebate Cliff: The scheduled reduction of China's primary lithium battery export VAT rebate to 6% on April 1, 2026, and 0% on January 1, 2027, represents an existential margin squeeze for tier-2 and tier-3 Chinese contract manufacturers lacking pricing power or overseas assembly footprints. Procurement executives must anticipate 5% to 10% FOB price adjustment requests from Chinese ODM suppliers over the next 12 months or actively shift sourcing to ASEAN-based facilities.
- Raw Material Volatility & Fluorochemical Bottlenecks: While metallic lithium foil accounts for a smaller mass fraction in a primary CR2032 cell (roughly 0.1 grams of lithium per cell) compared to EV traction batteries, violent swings in battery-grade lithium metal, cobalt salts (for LIR cells), high-purity EMD, and fluorinated carbon (CFx) directly impact gross margins. Unhedged ODM manufacturers remain vulnerable to upstream feedstock squeezes.
- Cross-Chemistry Substitution Threats: In entry-level, larger-format backup niches and low-voltage stationary sensors, the rapid maturation of sodium-ion micro batteries and advanced 1.6V nickel-zinc (NiZn) systems presents a partial substitution risk. While neither chemistry can match the 3.0V flat discharge plateau and 10-year shelf life of metallic lithium in ultra-thin coin geometries, they are competing on cost and non-hazardous shipping classifications.
- Escalating Compliance CAPEX and Litigation Liability: Pediatric ingestion litigation in North America and PFAS (per- and polyfluoroalkyl substances) regulatory scrutiny in Europe and the US represent severe tail risks. Because fluoropolymers (such as PTFE binders in cathodes or fluorinated electrolytes/gaskets) and Li/CFx chemistries intersect with broad PFAS chemical definitions, manufacturers must allocate significant R&D capital toward PFAS-free binder systems and non-fluorinated gasket elastomers to safeguard long-term market access in Europe and North America.
1.1 Report Overview and Core Analytical Framework 1
1.2 Product Taxonomy and Electrochemical Boundary Definitions 2
1.3 Research Methodology, Primary Interviews, and Triangulation Logic 3
1.4 Econometric Modeling Assumptions and Data Sources 5
1.5 Industry Abbreviations and Technical Nomenclature 6
Chapter 2 Industry Ecosystem, Value Chain Architecture, and Supply Chain Bottlenecks 7
2.1 Global Lithium Coin Battery Value Chain Architecture 7
2.2 Upstream Raw Material Supply Dynamics 8
2.3 Specialized Components: Precision Stamped Stainless Steel Cans, Polypropylene Micro-Porous Separators, and Organic Electrolytes 10
2.4 Supply Chain Bottlenecks, Raw Material Price Volatility, and Value Migration 11
Chapter 3 Global Market Dynamics: Capacity, Production, Consumption, and Value Migration (2021-2031) 13
3.1 Global Lithium Coin Battery Capacity and Capacity Utilization Rate (2021-2031) 13
3.2 Global Production Volume and Output Value Analysis (2021-2031) 15
3.3 Global Consumption Volume and Market Size Trajectory (2021-2031) 16
3.4 Average Selling Price (ASP) Evolution 18
Chapter 4 Technical Verticals: Chemistry Segmentation and Electrochemical Performance (2021-2031) 20
4.1 Global Market Breakdown by Type: Capacity, Production, Consumption, and Market Size 20
4.2 Primary Coin Battery (Lithium Manganese Dioxide) 21
4.3 Primary Coin Battery (Lithium Carbon Monofluoride) 23
4.4 Secondary Lithium Batteries 25
Chapter 5 Downstream Demand Architecture and Application Verticals (2021-2031) 27
5.1 Global Consumption Volume and Market Size Distribution by Application 27
5.2 Consumer Electronics & Smart Home 28
5.3 Automotive & Smart Mobility 30
5.4 IoT & Industrial Automation 31
5.5 Medical & Healthcare Device 32
Chapter 6 Commercial Go-To-Market Models and Channel Economics (2021-2031) 34
6.1 Global Revenue and Volume Share by Market Model 34
6.2 ODM/OEM Model 35
6.3 Own Brand Manufacturers (OBM) 36
6.4 Industrial OEM Matching (B2B) 37
Chapter 7 Manufacturing Process Engineering, Cost Structure, and Patent Landscape 39
7.1 Automated Cell Assembly, Crimping Sealing Technology, and Dry Room Dew Point Control 39
7.2 Unit Manufacturing Cost Breakdown: Raw Materials, Equipment Depreciation, Energy, and Yield Loss 40
7.3 Global Patent Filing Trends, High-Pulse Discharge Innovations, and Solid-State Micro-Battery IP Landscape 42
Chapter 8 Global Trade Flows, Import/Export Logistics, and Regulatory Compliance 44
8.1 Global Lithium Coin Battery Import and Export Volume Analysis (2021-2026) 44
8.2 Primary Exporting Hubs and Cross-Border Supply Corridors 45
8.3 Major Importing Markets and Regional Trade Balances 46
8.4 International Dangerous Goods Logistics (ICAO/IATA UN 3090 and UN 3091) and Tariff Regimes 47
Chapter 9 Asia-Pacific Market Analysis (2021-2031) 49
9.1 Asia-Pacific Capacity, Production, Consumption, and Market Size Overview 49
9.2 China 50
9.3 Japan 51
9.4 South Korea 52
9.5 Taiwan (China) 52
9.6 India 53
9.7 Southeast Asia 54
Chapter 10 North America Market Analysis (2021-2031) 55
10.1 North America Capacity, Production, Consumption, and Market Size Overview 55
10.2 United States 56
10.3 Canada 57
10.4 Mexico 57
Chapter 11 Europe Market Analysis (2021-2031) 58
11.1 Europe Capacity, Production, Consumption, and Market Size Overview 58
11.2 Germany 59
11.3 Switzerland 59
11.4 United Kingdom 60
11.5 France 60
11.6 Italy & Rest of Europe 61
Chapter 12 South America, Middle East, and Africa Market Analysis (2021-2031) 62
12.1 Regional Consumption Volume, Import Dependency, and Market Size Overview 62
12.2 Brazil 63
12.3 Argentina 63
12.4 GCC Countries 64
12.5 South Africa 64
Chapter 13 Competitive Landscape and Market Concentration Analysis 65
13.1 Global Corporate Ranking by Capacity, Production, and Revenue (2021-2026) 65
13.2 Market Concentration Indices (CR3, CR5, CR10, and Herfindahl-Hirschman Index) 66
13.3 Competitive Matrix: Global OBM Tier-1 Leaders vs High-Scale Asian ODM/B2B Manufacturers 67
Chapter 14 Corporate Intelligence and Operational Benchmarking 68
14.1 Energizer 68
14.1.1 Corporate Profile and Strategic Footprint 68
14.1.2 SWOT Analysis 69
14.1.3 Product-Specific Operations: Capacity, Production, Utilization Rate, Price, Cost, Gross Margin, and Market Share 69
14.1.4 Go-To-Market Strategy and Child-Resistant Packaging Compliance 71
14.2 Duracell 72
14.2.1 Corporate Profile and Strategic Footprint 72
14.2.2 SWOT Analysis 73
14.2.3 Product-Specific Operations: Capacity, Production, Utilization Rate, Price, Cost, Gross Margin, and Market Share 73
14.2.4 Go-To-Market Strategy and Bitrex Coating Deployment 75
14.3 Anhui Anfu Battery Technology Co. Ltd./Nanfu 76
14.3.1 Corporate Profile and Strategic Footprint 76
14.3.2 SWOT Analysis 77
14.3.3 Product-Specific Operations: Capacity, Production, Utilization Rate, Price, Cost, Gross Margin, and Market Share 77
14.3.4 Domestic Retail Channel Architecture and R&D Expenditure 79
14.4 FDK CORPORATION 80
14.4.1 Corporate Profile and Strategic Footprint 80
14.4.2 SWOT Analysis 81
14.4.3 Product-Specific Operations: Capacity, Production, Utilization Rate, Price, Cost, Gross Margin, and Market Share 81
14.4.4 High-Reliability Industrial and Automotive B2B Strategy 83
14.5 GP Industries Limited 84
14.5.1 Corporate Profile and Strategic Footprint 84
14.5.2 SWOT Analysis 85
14.5.3 Product-Specific Operations: Capacity, Production, Utilization Rate, Price, Cost, Gross Margin, and Market Share 85
14.5.4 Southeast Asian Manufacturing Footprint and Global OBM/OEM Strategy 87
14.6 Panasonic Energy 88
14.6.1 Corporate Profile and Strategic Footprint 88
14.6.2 SWOT Analysis 89
14.6.3 Product-Specific Operations: Capacity, Production, Utilization Rate, Price, Cost, Gross Margin, and Market Share 89
14.6.4 R&D Expenditure in Li-CFx (BR Series) and Automotive TPMS Qualification 91
14.7 VARTA AG 92
14.7.1 Corporate Profile and Strategic Footprint 92
14.7.2 SWOT Analysis 93
14.7.3 Product-Specific Operations: Capacity, Production, Utilization Rate, Price, Cost, Gross Margin, and Market Share 93
14.7.4 Rechargeable CoinPower Operations and European OEM Matching Strategy 95
14.8 Maxell Ltd. 96
14.8.1 Corporate Profile and Strategic Footprint 96
14.8.2 SWOT Analysis 97
14.8.3 Product-Specific Operations: Capacity, Production, Utilization Rate, Price, Cost, Gross Margin, and Market Share 97
14.8.4 R&D Expenditure in Medical-Grade and High-Temperature Coin Cells 99
14.9 Golden Power Group Holdings Limited 100
14.9.1 Corporate Profile and Strategic Footprint 100
14.9.2 SWOT Analysis 101
14.9.3 Product-Specific Operations: Capacity, Production, Utilization Rate, Price, Cost, Gross Margin, and Market Share 101
14.9.4 Automated Line Upgrades and Global Private Label OEM Strategy 103
14.10 Sichuan Changhong NewEnergy Technology Co. Ltd. 104
14.10.1 Corporate Profile and Strategic Footprint 104
14.10.2 SWOT Analysis 105
14.10.3 Product-Specific Operations: Capacity, Production, Utilization Rate, Price, Cost, Gross Margin, and Market Share 105
14.10.4 Capacity Expansion and International ODM Customer Acquisition 107
14.11 Zhejiang Hengwei Battery Co. Ltd 108
14.11.1 Corporate Profile and Strategic Footprint 108
14.11.2 SWOT Analysis 109
14.11.3 Product-Specific Operations: Capacity, Production, Utilization Rate, Price, Cost, Gross Margin, and Market Share 109
14.11.4 Export-Oriented ODM Business Model and Cost Control Architecture 111
14.12 Guangzhou Tiger Head Battery Group 112
14.12.1 Corporate Profile and Strategic Footprint 112
14.12.2 SWOT Analysis 113
14.12.3 Product-Specific Operations: Capacity, Production, Utilization Rate, Price, Cost, Gross Margin, and Market Share 113
14.12.4 Emerging Market Distribution Networks and Portfolio Strategy 115
14.13 Zhejiang Mustang Battery Co. Ltd 116
14.13.1 Corporate Profile and Strategic Footprint 116
14.13.2 SWOT Analysis 117
14.13.3 Product-Specific Operations: Capacity, Production, Utilization Rate, Price, Cost, Gross Margin, and Market Share 117
14.13.4 High-Speed Lithium Coin Cell Manufacturing and R&D Expenditure 119
14.14 Renata SA 120
14.14.1 Corporate Profile and Strategic Footprint 120
14.14.2 SWOT Analysis 121
14.14.3 Product-Specific Operations: Capacity, Production, Utilization Rate, Price, Cost, Gross Margin, and Market Share 121
14.14.4 Swiss Micro-Battery Precision Engineering and Medical/Horology B2B Matching 123
14.15 Power Glory Battery Tech(Hubei) Co. Ltd 124
14.15.1 Corporate Profile and Strategic Footprint 124
14.15.2 SWOT Analysis 125
14.15.3 Product-Specific Operations: Capacity, Production, Utilization Rate, Price, Cost, Gross Margin, and Market Share 125
14.15.4 Primary Lithium Micro-Power R&D and Electronic Shelf Label (ESL) Penetration 127
14.16 EVE Energy 128
14.16.1 Corporate Profile and Strategic Footprint 128
14.16.2 SWOT Analysis 129
14.16.3 Product-Specific Operations: Capacity, Production, Utilization Rate, Price, Cost, Gross Margin, and Market Share 129
14.16.4 R&D Expenditure in Li-MnO2/Li-CFx and Automotive/IoT B2B Matching 131
14.17 SYNergy ScienTech Corp. 132
14.17.1 Corporate Profile and Strategic Footprint 132
14.17.2 SWOT Analysis 133
14.17.3 Product-Specific Operations: Capacity, Production, Utilization Rate, Price, Cost, Gross Margin, and Market Share 133
14.17.4 Rechargeable Coin Cell R&D and Wearable Device OEM Strategy 135
Chapter 15 Strategic Outlook, Supply-Demand Risk Matrix, and Price Forecast (2026-2031) 136
Table 2 Technical Comparison of Lithium Coin Battery Chemistries (Li-MnO2, Li-CFx, LIR, ML, VL) 2
Table 3 Primary Research Interview Distribution by Stakeholder Type and Region 4
Table 4 Econometric Forecast Assumptions and Macroeconomic Baseline Parameters (2026-2031) 5
Table 5 Industry Abbreviations and Technical Nomenclature 6
Table 6 Upstream Raw Material Specifications and Key Global Suppliers (Lithium Strip, Electrolytic Manganese Dioxide, Fluorinated Carbon) 9
Table 7 Global Lithium Coin Battery Capacity, Production, Consumption, and Utilization Rate (2021-2031) 14
Table 8 Global Lithium Coin Battery Market Size (USD Million) and Average Selling Price (USD/Unit) (2021-2031) 17
Table 9 Global Lithium Coin Battery Production Volume by Standard Form Factor (CR2032, CR2025, CR2016, CR2450, Others) (2021-2031) 19
Table 10 Global Lithium Coin Battery Capacity and Production by Type (2021-2031) 20
Table 11 Global Lithium Coin Battery Consumption and Market Size by Type (2021-2031) 21
Table 12 Global Primary Coin Battery (Lithium Manganese Dioxide) Market Size and Volume Forecast (2021-2031) 22
Table 13 Global Primary Coin Battery (Lithium Carbon Monofluoride) Market Size and Volume Forecast (2021-2031) 24
Table 14 Global Secondary Lithium Batteries (Coin Type) Market Size and Volume Forecast (2021-2031) 26
Table 15 Global Lithium Coin Battery Consumption Volume by Application (2021-2031) 27
Table 16 Global Lithium Coin Battery Market Size (USD Million) by Application (2021-2031) 28
Table 17 Consumer Electronics & Smart Home Lithium Coin Battery Demand by Sub-Segment (2021-2031) 29
Table 18 Automotive & Smart Mobility Lithium Coin Battery Demand by Sub-Segment (Key Fobs, TPMS, E-Toll) (2021-2031) 30
Table 19 IoT & Industrial Automation Lithium Coin Battery Demand by Sub-Segment (ESL, Smart Meters, Trackers) (2021-2031) 31
Table 20 Medical & Healthcare Device Lithium Coin Battery Demand by Sub-Segment (CGM, Hearing Aids, Capsules) (2021-2031) 33
Table 21 Global Lithium Coin Battery Market Size and Volume Breakdown by Market Model (2021-2031) 34
Table 22 Margin Comparison Across ODM/OEM Model, Own Brand Manufacturers (OBM), and Industrial OEM Matching (B2B) (2026) 38
Table 23 Standard CR2032 Lithium Coin Battery Manufacturing Cost Structure Breakdown (2021-2026) 41
Table 24 Key Active Patents in Lithium Coin Battery Sealing, Electrolyte Formulation, and Pulse Discharge (2021-2026) 43
Table 25 Global Lithium Coin Battery Import and Export Volume by Major Country (2021-2026) 44
Table 26 HS Code 850650 and 850760 Tariff Rates and Trade Regulatory Barriers Across Major Markets (2026) 48
Table 27 Asia-Pacific Lithium Coin Battery Capacity, Production, Consumption, and Market Size (2021-2031) 49
Table 28 Asia-Pacific Lithium Coin Battery Consumption Volume by Country/Region (2021-2031) 50
Table 29 North America Lithium Coin Battery Capacity, Production, Consumption, and Market Size (2021-2031) 55
Table 30 North America Lithium Coin Battery Consumption Volume by Country (2021-2031) 56
Table 31 Europe Lithium Coin Battery Capacity, Production, Consumption, and Market Size (2021-2031) 58
Table 32 Europe Lithium Coin Battery Consumption Volume by Country (2021-2031) 59
Table 33 South America, Middle East, and Africa Lithium Coin Battery Consumption and Market Size by Country/Sub-Region (2021-2031) 62
Table 34 Global Top Manufacturers Lithium Coin Battery Capacity (Million Units) Ranking (2021-2026) 65
Table 35 Global Top Manufacturers Lithium Coin Battery Production (Million Units) Ranking (2021-2026) 66
Table 36 Global Top Manufacturers Lithium Coin Battery Revenue (USD Million) Ranking (2021-2026) 67
Table 37 Energizer Lithium Coin Battery Capacity, Production, Price, Cost and Gross Profit Margin (2021-2026) 70
Table 38 Duracell Lithium Coin Battery Capacity, Production, Price, Cost and Gross Profit Margin (2021-2026) 74
Table 39 Anhui Anfu Battery Technology Co. Ltd./Nanfu Lithium Coin Battery Capacity, Production, Price, Cost and Gross Profit Margin (2021-2026) 78
Table 40 FDK CORPORATION Lithium Coin Battery Capacity, Production, Price, Cost and Gross Profit Margin (2021-2026) 82
Table 41 GP Industries Limited Lithium Coin Battery Capacity, Production, Price, Cost and Gross Profit Margin (2021-2026) 86
Table 42 Panasonic Energy Lithium Coin Battery Capacity, Production, Price, Cost and Gross Profit Margin (2021-2026) 90
Table 43 VARTA AG Lithium Coin Battery Capacity, Production, Price, Cost and Gross Profit Margin (2021-2026) 94
Table 44 Maxell Ltd. Lithium Coin Battery Capacity, Production, Price, Cost and Gross Profit Margin (2021-2026) 98
Table 45 Golden Power Group Holdings Limited Lithium Coin Battery Capacity, Production, Price, Cost and Gross Profit Margin (2021-2026) 102
Table 46 Sichuan Changhong NewEnergy Technology Co. Ltd. Lithium Coin Battery Capacity, Production, Price, Cost and Gross Profit Margin (2021-2026) 106
Table 47 Zhejiang Hengwei Battery Co. Ltd Lithium Coin Battery Capacity, Production, Price, Cost and Gross Profit Margin (2021-2026) 110
Table 48 Guangzhou Tiger Head Battery Group Lithium Coin Battery Capacity, Production, Price, Cost and Gross Profit Margin (2021-2026) 114
Table 49 Zhejiang Mustang Battery Co. Ltd Lithium Coin Battery Capacity, Production, Price, Cost and Gross Profit Margin (2021-2026) 118
Table 50 Renata SA Lithium Coin Battery Capacity, Production, Price, Cost and Gross Profit Margin (2021-2026) 122
Table 51 Power Glory Battery Tech(Hubei) Co. Ltd Lithium Coin Battery Capacity, Production, Price, Cost and Gross Profit Margin (2021-2026) 126
Table 52 EVE Energy Lithium Coin Battery Capacity, Production, Price, Cost and Gross Profit Margin (2021-2026) 130
Table 53 SYNergy ScienTech Corp. Lithium Coin Battery Capacity, Production, Price, Cost and Gross Profit Margin (2021-2026) 134
Table 54 Global Lithium Coin Battery Supply-Demand Risk Matrix and Regulatory Compliance Impact Assessment (2026-2031) 137
Figure 1 Lithium Coin Battery Product Classification by Chemistry and Rechargeability 2
Figure 2 Research Methodology and Bottom-Up/Top-Down Market Sizing Triangulation 3
Figure 3 Global Lithium Coin Battery Value Chain Architecture and Margin Pool Distribution 7
Figure 4 Battery-Grade Lithium Metal and Electrolytic Manganese Dioxide (EMD) Historical Price Trends (2021-2026) 8
Figure 5 Supply Chain Bottleneck Analysis and Value Migration Trajectory (2021-2031) 12
Figure 6 Global Lithium Coin Battery Capacity, Production, and Utilization Rate Trajectory (2021-2031) 13
Figure 7 Global Lithium Coin Battery Consumption Volume and Market Size Growth (2021-2031) 16
Figure 8 Global Lithium Coin Battery Average Selling Price (ASP) Evolution by Chemistry (2021-2031) 18
Figure 9 Global Lithium Coin Battery Market Value Share by Type (2021, 2026, and 2031) 20
Figure 10 Discharge Curve Comparison: Li-MnO2 (CR Series) vs Li-CFx (BR Series) under High-Pulse Loads 23
Figure 11 Secondary Lithium Coin Battery Energy Density and Cycle Life Benchmarking 25
Figure 12 Global Lithium Coin Battery Market Size Share by Application (2021, 2026, and 2031) 27
Figure 13 Global Electronic Shelf Label (ESL) and Continuous Glucose Monitoring (CGM) Installed Base Growth Driving Coin Battery Demand (2021-2031) 32
Figure 14 Global Lithium Coin Battery Revenue Share by Market Model (ODM/OEM, OBM, B2B Industrial Matching) (2021-2031) 35
Figure 15 Automated Lithium Coin Cell Manufacturing Process Flow and Critical Quality Control Nodes 39
Figure 16 Global Lithium Coin Battery Unit Manufacturing Cost Breakdown (2026) 41
Figure 17 Global Patent Publications in Lithium Coin Battery Technology by Jurisdiction (2021-2026) 42
Figure 18 Global Lithium Coin Battery Trade Flow Map: Major Exporting Hubs to Primary Consumption Markets (2026) 45
Figure 19 Asia-Pacific Lithium Coin Battery Market Size and Production Share by Country/Region (2021-2031) 51
Figure 20 North America Lithium Coin Battery Market Size and Consumption Trajectory (2021-2031) 56
Figure 21 Europe Lithium Coin Battery Market Size and Consumption Trajectory (2021-2031) 60
Figure 22 South America, Middle East, and Africa Lithium Coin Battery Market Size Trajectory (2021-2031) 63
Figure 23 Global Lithium Coin Battery Market Concentration (CR3, CR5, CR10) Evolution (2021-2026) 66
Figure 24 Competitive Positioning Matrix of Key Lithium Coin Battery Players (2026) 67
Figure 25 Energizer Lithium Coin Battery Market Share (2021-2026) 70
Figure 26 Duracell Lithium Coin Battery Market Share (2021-2026) 74
Figure 27 Anhui Anfu Battery Technology Co. Ltd./Nanfu Lithium Coin Battery Market Share (2021-2026) 78
Figure 28 FDK CORPORATION Lithium Coin Battery Market Share (2021-2026) 82
Figure 29 GP Industries Limited Lithium Coin Battery Market Share (2021-2026) 86
Figure 30 Panasonic Energy Lithium Coin Battery Market Share (2021-2026) 90
Figure 31 VARTA AG Lithium Coin Battery Market Share (2021-2026) 94
Figure 32 Maxell Ltd. Lithium Coin Battery Market Share (2021-2026) 98
Figure 33 Golden Power Group Holdings Limited Lithium Coin Battery Market Share (2021-2026) 102
Figure 34 Sichuan Changhong NewEnergy Technology Co. Ltd. Lithium Coin Battery Market Share (2021-2026) 106
Figure 35 Zhejiang Hengwei Battery Co. Ltd Lithium Coin Battery Market Share (2021-2026) 110
Figure 36 Guangzhou Tiger Head Battery Group Lithium Coin Battery Market Share (2021-2026) 114
Figure 37 Zhejiang Mustang Battery Co. Ltd Lithium Coin Battery Market Share (2021-2026) 118
Figure 38 Renata SA Lithium Coin Battery Market Share (2021-2026) 122
Figure 39 Power Glory Battery Tech(Hubei) Co. Ltd Lithium Coin Battery Market Share (2021-2026) 126
Figure 40 EVE Energy Lithium Coin Battery Market Share (2021-2026) 130
Figure 41 SYNergy ScienTech Corp. Lithium Coin Battery Market Share (2021-2026) 134
Figure 42 Global Lithium Coin Battery Value Migration and Next-Generation Micro-Power Technology Roadmap (2026-2031) 138
Research Methodology
- Market Estimated Methodology:
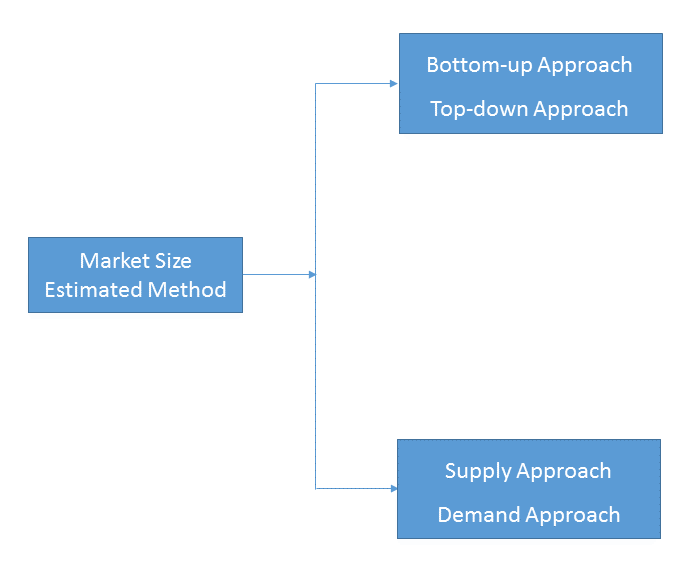
Bottom-up & top-down approach, supply & demand approach are the most important method which is used by HDIN Research to estimate the market size.
1)Top-down & Bottom-up Approach
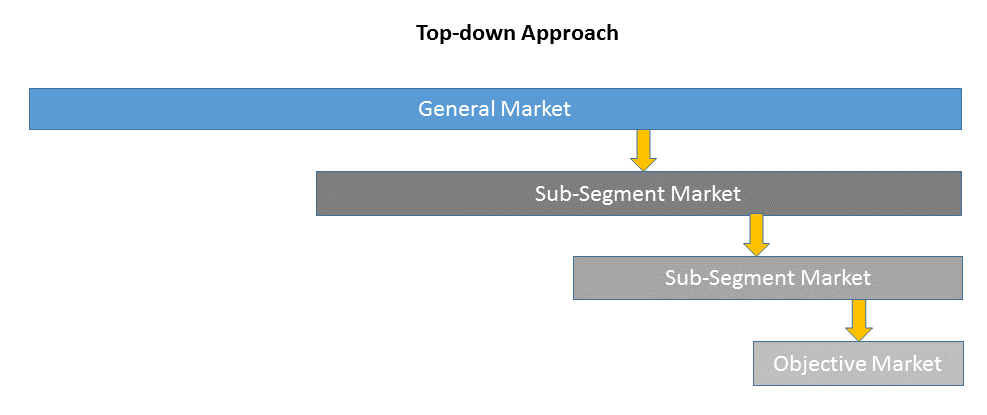
Top-down approach uses a general market size figure and determines the percentage that the objective market represents.
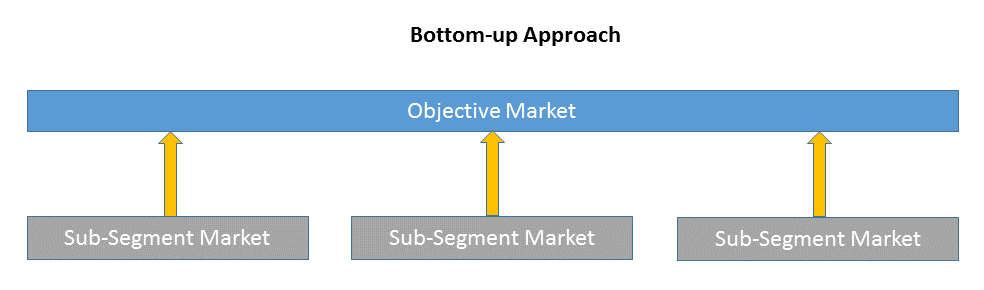
Bottom-up approach size the objective market by collecting the sub-segment information.
2)Supply & Demand Approach
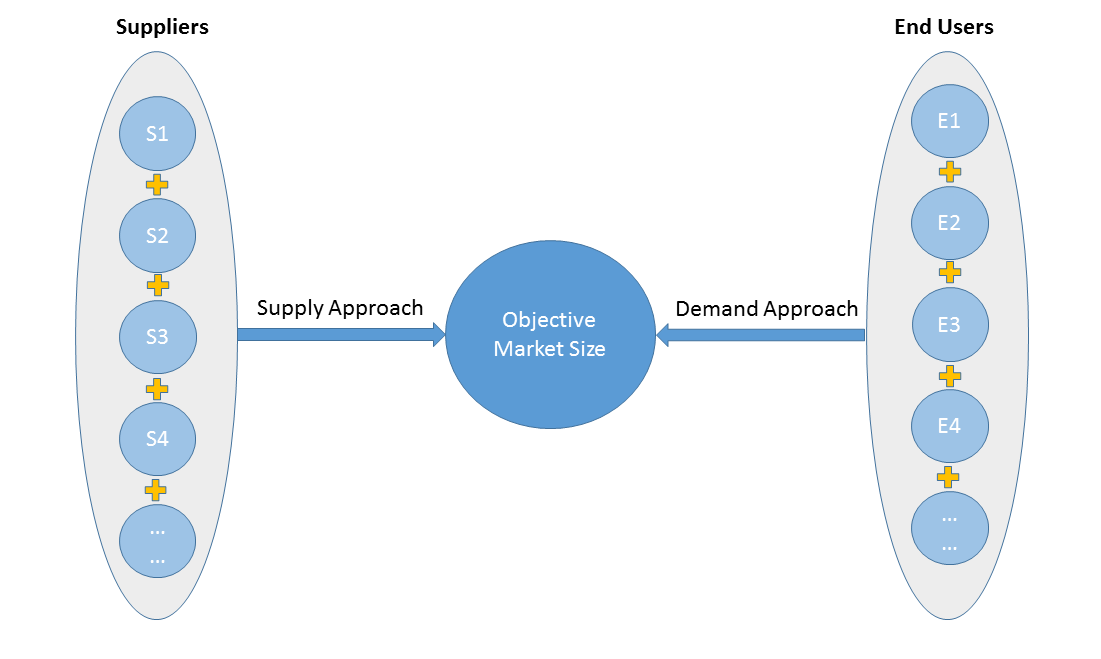
Supply approach is based on assessments of the size of each competitor supplying the objective market.
Demand approach combine end-user data within a market to estimate the objective market size. It is sometimes referred to as bottom-up approach.
- Forecasting Methodology
- Numerous factors impacting the market trend are considered for forecast model:
- New technology and application in the future;
- New project planned/under contraction;
- Global and regional underlying economic growth;
- Threatens of substitute products;
- Industry expert opinion;
- Policy and Society implication.
- Analysis Tools
1)PEST Analysis
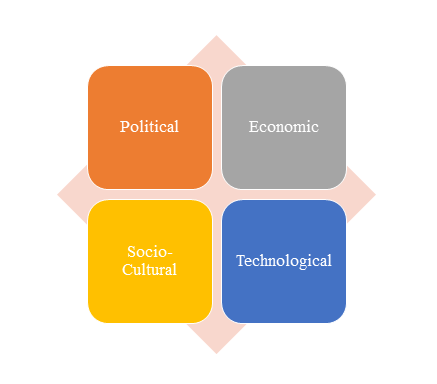
PEST Analysis is a simple and widely used tool that helps our client analyze the Political, Economic, Socio-Cultural, and Technological changes in their business environment.
- Benefits of a PEST analysis:
- It helps you to spot business opportunities, and it gives you advanced warning of significant threats.
- It reveals the direction of change within your business environment. This helps you shape what you’re doing, so that you work with change, rather than against it.
- It helps you avoid starting projects that are likely to fail, for reasons beyond your control.
- It can help you break free of unconscious assumptions when you enter a new country, region, or market; because it helps you develop an objective view of this new environment.
2)Porter’s Five Force Model Analysis
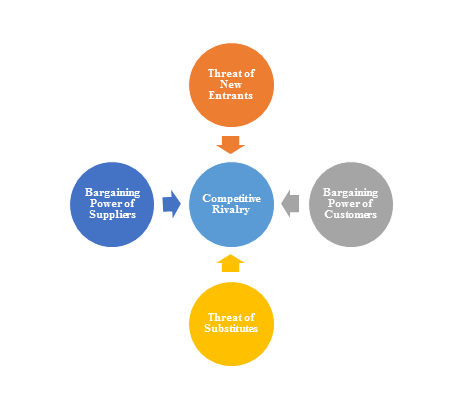
The Porter’s Five Force Model is a tool that can be used to analyze the opportunities and overall competitive advantage. The five forces that can assist in determining the competitive intensity and potential attractiveness within a specific area.
- Threat of New Entrants: Profitable industries that yield high returns will attract new firms.
- Threat of Substitutes: A substitute product uses a different technology to try to solve the same economic need.
- Bargaining Power of Customers: the ability of customers to put the firm under pressure, which also affects the customer's sensitivity to price changes.
- Bargaining Power of Suppliers: Suppliers of raw materials, components, labor, and services (such as expertise) to the firm can be a source of power over the firm when there are few substitutes.
- Competitive Rivalry: For most industries the intensity of competitive rivalry is the major determinant of the competitiveness of the industry.
3)Value Chain Analysis
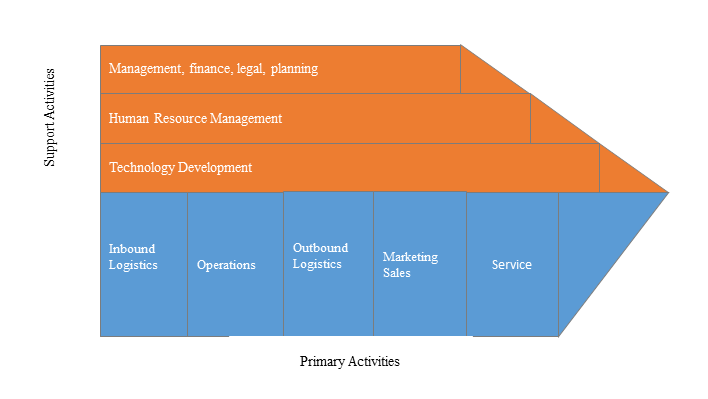
Value chain analysis is a tool to identify activities, within and around the firm and relating these activities to an assessment of competitive strength. Value chain can be analyzed by primary activities and supportive activities. Primary activities include: inbound logistics, operations, outbound logistics, marketing & sales, service. Support activities include: technology development, human resource management, management, finance, legal, planning.
4)SWOT Analysis
SWOT analysis is a tool used to evaluate a company's competitive position by identifying its strengths, weaknesses, opportunities and threats. The strengths and weakness is the inner factor; the opportunities and threats are the external factor. By analyzing the inner and external factors, the analysis can provide the detail information of the position of a player and the characteristics of the industry.
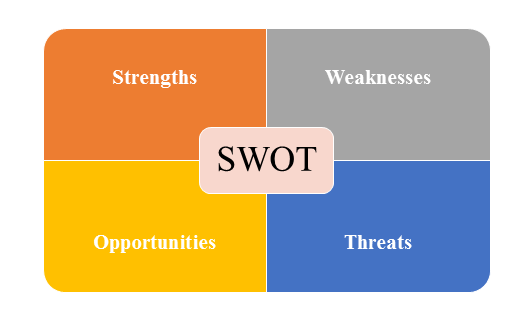
- Strengths describe what the player excels at and separates it from the competition
- Weaknesses stop the player from performing at its optimum level.
- Opportunities refer to favorable external factors that the player can use to give it a competitive advantage.
- Threats refer to factors that have the potential to harm the player.
- Data Sources
| Primary Sources | Secondary Sources |
|---|---|
| Face to face/Phone Interviews with market participants, such as: Manufactures; Distributors; End-users; Experts. Online Survey |
Government/International Organization Data: Annual Report/Presentation/Fact Book Internet Source Information Industry Association Data Free/Purchased Database Market Research Report Book/Journal/News |