Power Semiconductors Global Market Insights 2022, Analysis and Forecast to 2027, by Manufacturers, Regions, Technology, Application, Product Type
- Single User License (1 Users) $ 4,000
- Team License (2~5 Users) $ 5,000
- Corporate License (>5 Users) $ 6,000
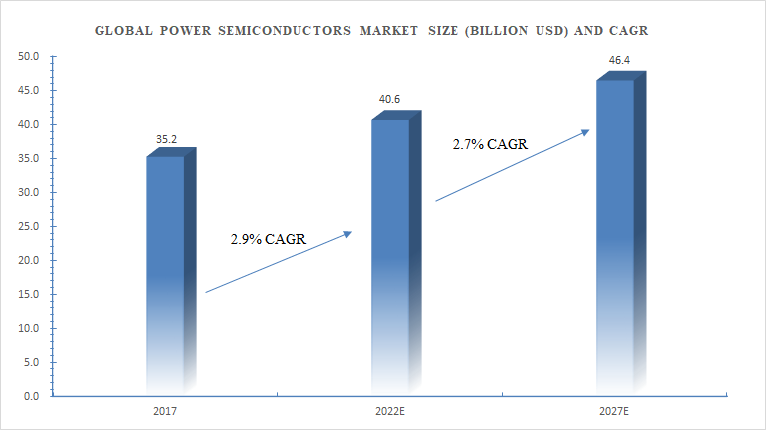
The global power semiconductors market size was USD 35.2 billion in 2017, growing to USD 40.6 billion in 2022, with a CAGR of 2.9% from 2017 to 2022. The global power semiconductors market size is expected to grow to USD 46.4 billion in 2027, with a CAGR of 2.7% from 2022 to 2027.
 For geography segment, regional supply, demand, major players, price is presented from 2017 to 2027. This report covers following regions:
North America
South America
Asia & Pacific
Europe
MEA
The key countries for each regions are also included such as United States, China, Japan, India, Korea, ASEAN, Germany, France, UK, Italy, Spain, CIS, and Brazil etc.
For competitor segment, the report include global key players of Power Semiconductors as well as some small players. The information for each competitor includes:
Company Profile
Main Business Information
SWOT Analysis
Sales Volume, Revenue, Price and Gross Margin
Market Share
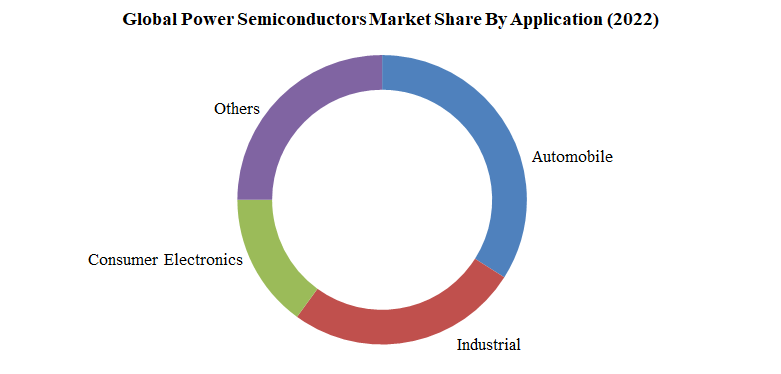
Applications Segments:
 Types Segments:
Diodes
Switches
Rectifiers
Others
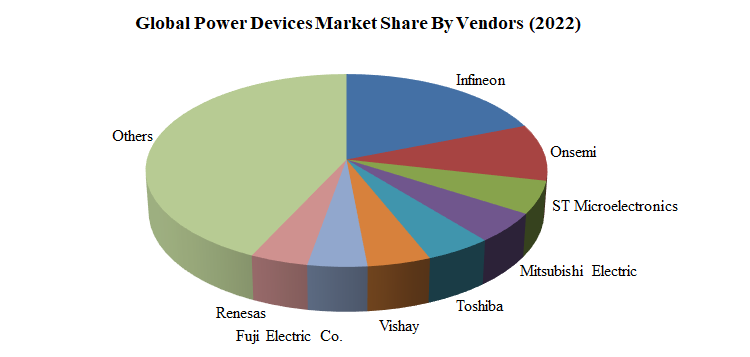
Companies Covered:
Fuji Electric
Toshiba
Mitsubishi
Littelfuse
Infineon
STMicroelectronics
International Rectifier
Vishay
Semikron
NXP Semiconductors
Renesas
Fairchild
etc.
 Please ask for sample pages for full companies list
Base Year: 2022
Historical Data: from 2017 to 2021
Forecast Data: from 2022 to 2027
Any special requirements about this report, please let us know and we can provide custom report.
Chapter 1 Executive Summary
Chapter 2 Abbreviation and Acronyms
Chapter 3 Preface
3.1 Research Scope
3.2 Research Sources
3.2.1 Data Sources
3.2.2 Assumptions
3.3 Research Method
Chapter 4 Market Landscape
4.1 Market Overview
4.2 Classification/Types
4.3 Application/End Users
Chapter 5 Market Trend Analysis
5.1 Introduction
5.2 Drivers
5.3 Restraints
5.4 Opportunities
5.5 Threats
Chapter 6 Industry Chain Analysis
6.1 Upstream/Suppliers Analysis
6.2 Power Semiconductors Analysis
6.2.1 Technology Analysis
6.2.2 Cost Analysis
6.2.3 Market Channel Analysis
6.3 Downstream Buyers/End Users
Chapter 7 Latest Market Dynamics
7.1 Latest News
7.2 Merger and Acquisition
7.3 Planned/Future Project
7.4 Policy Dynamics
Chapter 8 Trading Analysis
8.1 Export of Power Semiconductors by Region
8.2 Import of Power Semiconductors by Region
8.3 Balance of Trade
Chapter 9 Historical and Forecast Power Semiconductors Market in North America (2017-2027)
9.1 Power Semiconductors Market Size
9.2 Power Semiconductors Demand by End Use
9.3 Competition by Players/Suppliers
9.4 Type Segmentation and Price
9.5 Key Countries Analysis
9.5.1 United States
9.5.2 Canada
9.5.3 Mexico
Chapter 10 Historical and Forecast Power Semiconductors Market in South America (2017-2027)
10.1 Power Semiconductors Market Size
10.2 Power Semiconductors Demand by End Use
10.3 Competition by Players/Suppliers
10.4 Type Segmentation and Price
10.5 Key Countries Analysis
10.5.1 Brazil
10.5.2 Argentina
10.5.3 Chile
10.5.4 Peru
Chapter 11 Historical and Forecast Power Semiconductors Market in Asia & Pacific (2017-2027)
11.1 Power Semiconductors Market Size
11.2 Power Semiconductors Demand by End Use
11.3 Competition by Players/Suppliers
11.4 Type Segmentation and Price
11.5 Key Countries Analysis
11.5.1 China
11.5.2 India
11.5.3 Japan
11.5.4 South Korea
11.5.5 Southest Asia
11.5.6 Australia
Chapter 12 Historical and Forecast Power Semiconductors Market in Europe (2017-2027)
12.1 Power Semiconductors Market Size
12.2 Power Semiconductors Demand by End Use
12.3 Competition by Players/Suppliers
12.4 Type Segmentation and Price
12.5 Key Countries Analysis
12.5.1 Germany
12.5.2 France
12.5.3 United Kingdom
12.5.4 Italy
12.5.5 Spain
12.5.6 Belgium
12.5.7 Netherlands
12.5.8 Austria
12.5.9 Poland
12.5.10 Russia
Chapter 13 Historical and Forecast Power Semiconductors Market in MEA (2017-2027)
13.1 Power Semiconductors Market Size
13.2 Power Semiconductors Demand by End Use
13.3 Competition by Players/Suppliers
13.4 Type Segmentation and Price
13.5 Key Countries Analysis
13.5.1 Egypt
13.5.2 Israel
13.5.3 South Africa
13.5.4 Gulf Cooperation Council Countries
13.5.5 Turkey
Chapter 14 Summary For Global Power Semiconductors Market (2017-2022)
14.1 Power Semiconductors Market Size
14.2 Power Semiconductors Demand by End Use
14.3 Competition by Players/Suppliers
14.4 Type Segmentation and Price
Chapter 15 Global Power Semiconductors Market Forecast (2022-2027)
15.1 Power Semiconductors Market Size Forecast
15.2 Power Semiconductors Demand Forecast
15.3 Competition by Players/Suppliers
15.4 Type Segmentation and Price Forecast
Chapter 16 Analysis of Global Key Vendors
16.1 Fuji Electric
16.1.1 Company Profile
16.1.2 Main Business and Power Semiconductors Information
16.1.3 SWOT Analysis of Fuji Electric
16.1.4 Fuji Electric Power Semiconductors Sales, Revenue, Price and Gross Margin (2017-2022)
16.2 Toshiba
16.2.1 Company Profile
16.2.2 Main Business and Power Semiconductors Information
16.2.3 SWOT Analysis of Toshiba
16.2.4 Toshiba Power Semiconductors Sales, Revenue, Price and Gross Margin (2017-2022)
16.3 Mitsubishi
16.3.1 Company Profile
16.3.2 Main Business and Power Semiconductors Information
16.3.3 SWOT Analysis of Mitsubishi
16.3.4 Mitsubishi Power Semiconductors Sales, Revenue, Price and Gross Margin (2017-2022)
16.4 Littelfuse
16.4.1 Company Profile
16.4.2 Main Business and Power Semiconductors Information
16.4.3 SWOT Analysis of Littelfuse
16.4.4 Littelfuse Power Semiconductors Sales, Revenue, Price and Gross Margin (2017-2022)
16.5 Infineon
16.5.1 Company Profile
16.5.2 Main Business and Power Semiconductors Information
16.5.3 SWOT Analysis of Infineon
16.5.4 Infineon Power Semiconductors Sales, Revenue, Price and Gross Margin (2017-2022)
16.6 STMicroelectronics
16.6.1 Company Profile
16.6.2 Main Business and Power Semiconductors Information
16.6.3 SWOT Analysis of STMicroelectronics
16.6.4 STMicroelectronics Power Semiconductors Sales, Revenue, Price and Gross Margin (2017-2022)
16.7 International Rectifier
16.7.1 Company Profile
16.7.2 Main Business and Power Semiconductors Information
16.7.3 SWOT Analysis of International Rectifier
16.7.4 International Rectifier Power Semiconductors Sales, Revenue, Price and Gross Margin (2017-2022)
16.8 Vishay
16.8.1 Company Profile
16.8.2 Main Business and Power Semiconductors Information
16.8.3 SWOT Analysis of Vishay
16.8.4 Vishay Power Semiconductors Sales, Revenue, Price and Gross Margin (2017-2022)
16.9 Semikron
16.9.1 Company Profile
16.9.2 Main Business and Power Semiconductors Information
16.9.3 SWOT Analysis of Semikron
16.9.4 Semikron Power Semiconductors Sales, Revenue, Price and Gross Margin (2017-2022)
16.10 NXP Semiconductors
16.10.1 Company Profile
16.10.2 Main Business and Power Semiconductors Information
16.10.3 SWOT Analysis of NXP Semiconductors
16.10.4 NXP Semiconductors Power Semiconductors Sales, Revenue, Price and Gross Margin (2017-2022)
16.11 Renesas
16.11.1 Company Profile
16.11.2 Main Business and Power Semiconductors Information
16.11.3 SWOT Analysis of Renesas
16.11.4 Renesas Power Semiconductors Sales, Revenue, Price and Gross Margin (2017-2022)
16.12 Fairchild
16.12.1 Company Profile
16.12.2 Main Business and Power Semiconductors Information
16.12.3 SWOT Analysis of Fairchild
16.12.4 Fairchild Power Semiconductors Sales, Revenue, Price and Gross Margin (2017-2022)
Please ask for sample pages for full companies list
Table SWOT Analysis of Fuji Electric
Table 2017-2022 Fuji Electric Power Semiconductors Product Capacity Production Price Cost Production Value
Table Toshiba Information
Table SWOT Analysis of Toshiba
Table 2017-2022 Toshiba Power Semiconductors Product Capacity Production Price Cost Production Value
Table Mitsubishi Information
Table SWOT Analysis of Mitsubishi
Table 2017-2022 Mitsubishi Power Semiconductors Product Capacity Production Price Cost Production Value
Table Littelfuse Information
Table SWOT Analysis of Littelfuse
Table 2017-2022 Littelfuse Power Semiconductors Product Capacity Production Price Cost Production Value
Table Infineon Information
Table SWOT Analysis of Infineon
Table 2017-2022 Infineon Power Semiconductors Product Capacity Production Price Cost Production Value
Table STMicroelectronics Information
Table SWOT Analysis of STMicroelectronics
Table 2017-2022 STMicroelectronics Power Semiconductors Product Capacity Production Price Cost Production Value
Table International Rectifier Information
Table SWOT Analysis of International Rectifier
Table 2017-2022 International Rectifier Power Semiconductors Product Capacity Production Price Cost Production Value
Table Vishay Information
Table SWOT Analysis of Vishay
Table 2017-2022 Vishay Power Semiconductors Product Capacity Production Price Cost Production Value
Table Semikron Information
Table SWOT Analysis of Semikron
Table 2017-2022 Semikron Power Semiconductors Product Capacity Production Price Cost Production Value
Table NXP Semiconductors Information
Table SWOT Analysis of NXP Semiconductors
Table 2017-2022 NXP Semiconductors Power Semiconductors Product Capacity Production Price Cost Production Value
Table Renesas Information
Table SWOT Analysis of Renesas
Table 2017-2022 Renesas Power Semiconductors Product Capacity Production Price Cost Production Value
Table Fairchild Information
Table SWOT Analysis of Fairchild
Table 2017-2022 Fairchild Power Semiconductors Product Capacity Production Price Cost Production Value
Table Fuji Electric Information
Table SWOT Analysis of Fuji Electric
Table 2017-2022 Fuji Electric Power Semiconductors Product Capacity Production Price Cost Production Value
Table Toshiba Information
Table SWOT Analysis of Toshiba
Table 2017-2022 Toshiba Power Semiconductors Product Capacity Production Price Cost Production Value
Table Mitsubishi Information
Table SWOT Analysis of Mitsubishi
Table 2017-2022 Mitsubishi Power Semiconductors Product Capacity Production Price Cost Production Value
Table Littelfuse Information
Table SWOT Analysis of Littelfuse
Table 2017-2022 Littelfuse Power Semiconductors Product Capacity Production Price Cost Production Value
Table Infineon Information
Table SWOT Analysis of Infineon
Table 2017-2022 Infineo
Figure Market Size Estimated Method
Figure Major Forecasting Factors
Figure Power Semiconductors Picture
Figure 2017-2027 Regional Trade Balance
Figure 2017-2027 North America Power Semiconductors Market Size And Cagr
Figure 2017-2027 North America Power Semiconductors Market Volume And Cagr
Figure 2017-2027 South America Power Semiconductors Market Size And Cagr
Figure 2017-2027 South America Power Semiconductors Market Volume And Cagr
Figure 2017-2027 Asia & Pacific Power Semiconductors Market Size And Cagr
Figure 2017-2027 Asia & Pacific Power Semiconductors Market Volume And Cagr
Figure 2017-2027 Europe Power Semiconductors Market Size And Cagr
Figure 2017-2027 Europe Power Semiconductors Market Volume And Cagr
Figure 2017-2027 Mea Power Semiconductors Market Size And Cagr
Figure 2017-2027 Mea Power Semiconductors Market Volume And Cagr
Figure 2017-2022 Global Power Semiconductors Market Volume And Growth Rate
Figure 2017-2022 Global Power Semiconductors Market Size And Growth Rate
Figure 2022-2027 Global Power Semiconductors Market Volume And Growth Rate
Figure 2022-2027 Global Power Semiconductors Market Size And Growth Rate
Figure 2017-2022 Fuji Electric Power Semiconductors Capacity Production and Growth Rate
Figure 2017-2022 Fuji Electric Power Semiconductors Market Share
Figure 2017-2022 Toshiba Power Semiconductors Capacity Production and Growth Rate
Figure 2017-2022 Toshiba Power Semiconductors Market Share
Figure 2017-2022 Mitsubishi Power Semiconductors Capacity Production and Growth Rate
Figure 2017-2022 Mitsubishi Power Semiconductors Market Share
Figure 2017-2022 Littelfuse Power Semiconductors Capacity Production and Growth Rate
Figure 2017-2022 Littelfuse Power Semiconductors Market Share
Figure 2017-2022 Infineon Power Semiconductors Capacity Production and Growth Rate
Figure 2017-2022 Infineon Power Semiconductors Market Share
Figure 2017-2022 STMicroelectronics Power Semiconductors Capacity Production and Growth Rate
Figure 2017-2022 STMicroelectronics Power Semiconductors Market Share
Figure 2017-2022 International Rectifier Power Semiconductors Capacity Production and Growth Rate
Figure 2017-2022 International Rectifier Power Semiconductors Market Share
Figure 2017-2022 Vishay Power Semiconductors Capacity Production and Growth Rate
Figure 2017-2022 Vishay Power Semiconductors Market Share
Figure 2017-2022 Semikron Power Semiconductors Capacity Production and Growth Rate
Figure 2017-2022 Semikron Power Semiconductors Market Share
Figure 2017-2022 NXP Semiconductors Power Semiconductors Capacity Production and Growth Rate
Figure 2017-2022 NXP Semiconductors Power Semiconductors Market Share
Figure 2017-2022 Renesas Power Semiconductors Capacity Production and Growth Rate
Figure 2017-2022 Renesas Power Semiconductors Market Share
Figure 2017-2022 Fairchild Power Semiconductors Capacity Production and Growth Rate
Figure 2017-2022 Fairchild Power Semiconductors Market Share
Figure 2017-2022 Fuji Electric Power Semiconductors Capacity Production and Growth Rate
Figure 2017-2022 Fuji Electric Power Semiconductors Market Share
Figure 2017-2022 Toshiba Power Semiconductors Capacity Production and Growth Rate
Figure 2017-2022 Toshiba Power Semiconductors Market Share
Figure 2017-2022 Mitsubishi Power Semiconductors Capacity Production and Growth Rate
Figure 2017-2022 Mitsubishi Power Semiconductors Market
Research Methodology
- Market Estimated Methodology:
Bottom-up & top-down approach, supply & demand approach are the most important method which is used by HDIN Research to estimate the market size.

1)Top-down & Bottom-up Approach
Top-down approach uses a general market size figure and determines the percentage that the objective market represents.

Bottom-up approach size the objective market by collecting the sub-segment information.

2)Supply & Demand Approach
Supply approach is based on assessments of the size of each competitor supplying the objective market.
Demand approach combine end-user data within a market to estimate the objective market size. It is sometimes referred to as bottom-up approach.

- Forecasting Methodology
- Numerous factors impacting the market trend are considered for forecast model:
- New technology and application in the future;
- New project planned/under contraction;
- Global and regional underlying economic growth;
- Threatens of substitute products;
- Industry expert opinion;
- Policy and Society implication.
- Analysis Tools
1)PEST Analysis
PEST Analysis is a simple and widely used tool that helps our client analyze the Political, Economic, Socio-Cultural, and Technological changes in their business environment.

- Benefits of a PEST analysis:
- It helps you to spot business opportunities, and it gives you advanced warning of significant threats.
- It reveals the direction of change within your business environment. This helps you shape what you’re doing, so that you work with change, rather than against it.
- It helps you avoid starting projects that are likely to fail, for reasons beyond your control.
- It can help you break free of unconscious assumptions when you enter a new country, region, or market; because it helps you develop an objective view of this new environment.
2)Porter’s Five Force Model Analysis
The Porter’s Five Force Model is a tool that can be used to analyze the opportunities and overall competitive advantage. The five forces that can assist in determining the competitive intensity and potential attractiveness within a specific area.
- Threat of New Entrants: Profitable industries that yield high returns will attract new firms.
- Threat of Substitutes: A substitute product uses a different technology to try to solve the same economic need.
- Bargaining Power of Customers: the ability of customers to put the firm under pressure, which also affects the customer's sensitivity to price changes.
- Bargaining Power of Suppliers: Suppliers of raw materials, components, labor, and services (such as expertise) to the firm can be a source of power over the firm when there are few substitutes.
- Competitive Rivalry: For most industries the intensity of competitive rivalry is the major determinant of the competitiveness of the industry.

3)Value Chain Analysis
Value chain analysis is a tool to identify activities, within and around the firm and relating these activities to an assessment of competitive strength. Value chain can be analyzed by primary activities and supportive activities. Primary activities include: inbound logistics, operations, outbound logistics, marketing & sales, service. Support activities include: technology development, human resource management, management, finance, legal, planning.

4)SWOT Analysis
SWOT analysis is a tool used to evaluate a company's competitive position by identifying its strengths, weaknesses, opportunities and threats. The strengths and weakness is the inner factor; the opportunities and threats are the external factor. By analyzing the inner and external factors, the analysis can provide the detail information of the position of a player and the characteristics of the industry.

- Strengths describe what the player excels at and separates it from the competition
- Weaknesses stop the player from performing at its optimum level.
- Opportunities refer to favorable external factors that the player can use to give it a competitive advantage.
- Threats refer to factors that have the potential to harm the player.
- Data Sources
| Primary Sources | Secondary Sources |
|---|---|
| Face to face/Phone Interviews with market participants, such as: Manufactures; Distributors; End-users; Experts. Online Survey |
Government/International Organization Data: Annual Report/Presentation/Fact Book Internet Source Information Industry Association Data Free/Purchased Database Market Research Report Book/Journal/News |